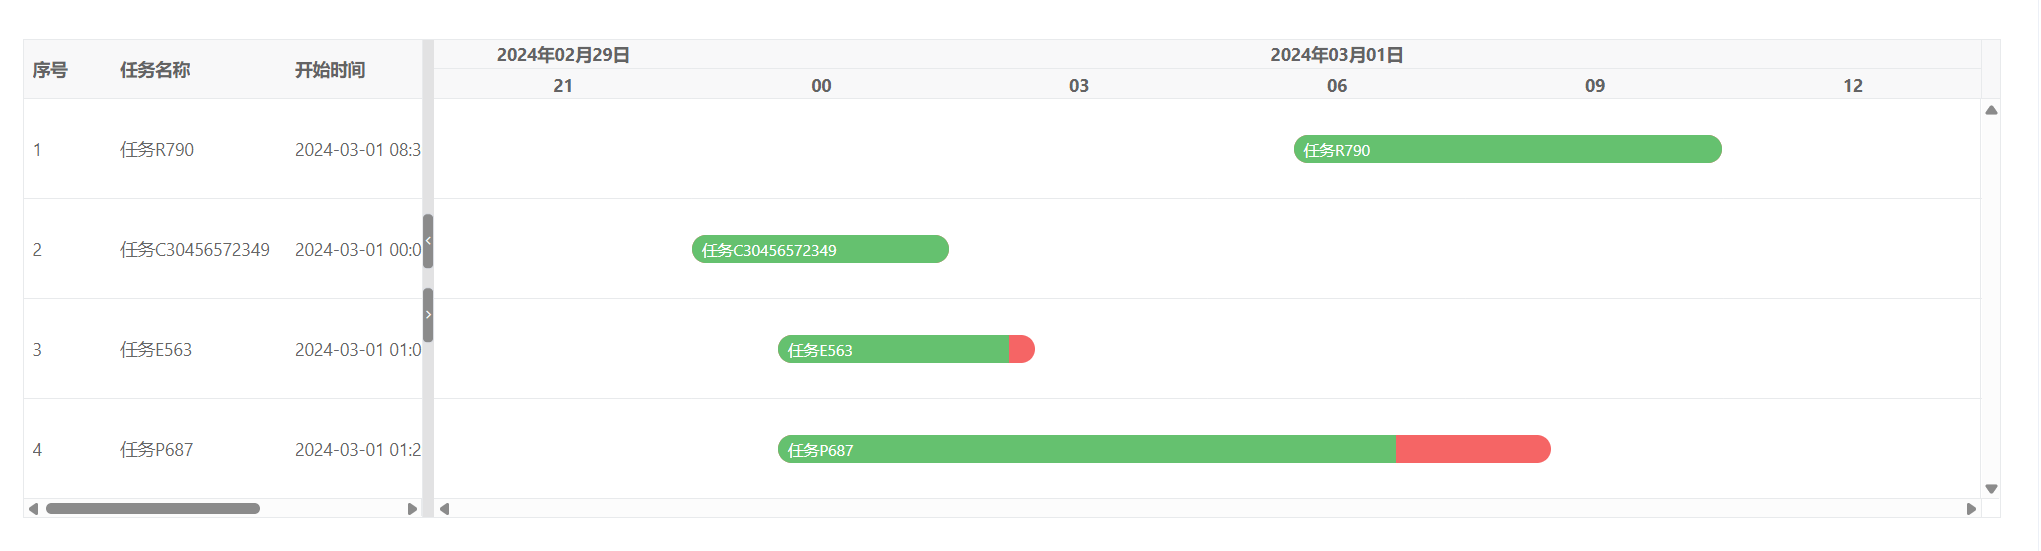
当任务时间跨度集中在数小时甚至分钟级别时,默认的时间轴粒度可能无法清晰展示任务细节。vxe-gantt 的小时视图(hour)结合 step 参数,可以灵活控制时间轴的显示密度,让短期任务的进度展示更紧凑、更直观。
核心配置
通过 taskViewConfig.scales 配置时间轴层级,将底层单位设为 hour,并设置 step: 3,表示每隔 3 个小时显示一个刻度。
javascript
taskViewConfig: {
  scales: [
    { type: 'date' },        // 顶层:以天为单位
    { type: 'hour', step: 3 } // 底层:每3小时一个刻度
  ]
}
代码
html
<template>
  <div>
    <vxe-gantt v-bind="ganttOptions"></vxe-gantt>
  </div>
</template>

<script setup>
import { reactive } from 'vue'

const ganttOptions = reactive({
  showOverflow: true,
  cellConfig: {
    height: 80
  },
  taskBarConfig: {
    showProgress: true,
    showContent: true,
    barStyle: {
      round: true,
      bgColor: '#f56565',
      completedBgColor: '#65c16f'
    }
  },
  taskViewConfig: {
    scales: [{ type: 'date' }, { type: 'hour', step: 3 }],
    tableStyle: {
      width: 320
    }
  },
  columns: [
    { type: 'seq', field: 'seq', width: 70 },
    { field: 'title', title: '任务名称', minWidth: 140 },
    { field: 'start', title: '开始时间', width: 160 },
    { field: 'end', title: '结束时间', width: 160 }
  ],
  data: [
    { id: 10001, title: '任务R790', start: '2024-03-01 08:30:20', end: '2024-03-01 09:30:30', progress: 100 },
    { id: 10002, title: '任务C30456572349', start: '2024-03-01 00:00:00', end: '2024-03-01 00:00:00', progress: 100 },
    { id: 10003, title: '任务E563', start: '2024-03-01 01:00:00', end: '2024-03-01 01:05:0', progress: 90 },
    { id: 10004, title: '任务P687', start: '2024-03-01 01:20:00', end: '2024-03-01 08:50:00', progress: 80 }
  ]
})
</script>
配置说明
| 配置项 | 值 | 说明 |
|---|---|---|
| scales 第一层 | { type: 'date' } | 顶层以天为刻度单位,显示日期(如 2024-03-01) |
| scales 第二层 | { type: 'hour', step: 3 } | 底层以小时为单位,每 3 小时显示一个刻度 |
| taskConfig.dateFormat | 不设置 | 默认解析到秒,精确匹配数据中的时间格式 |
- 效果:时间轴上会显示 00:00、03:00、06:00、09:00... 等刻度,任务条根据实际起止时间在单元格内精确定位。
调整更精细的间隔
如果需要更大的间隔(如每 4 小时或 6 小时),只需修改 step 值:
javascript
// 每4小时间隔
{ type: 'hour', step: 4 }

// 每6小时间隔
{ type: 'hour', step: 6 }
通过 scales 中的 step 参数,可以轻松控制小时视图的日期轴密度。对于需要按 3 小时间隔展示任务的场景,只需配置 { type: 'hour', step: 3 } 即可。结合 date 顶层,既能宏观看到日期分布,又能微观观察小时级别的任务细节,非常适合短期密集任务的排期展示。