及时做APP开发实战(十九):数据统计与图表展示功能实现
本文将详细介绍如何在"及时做"APP中实现专注数据统计和可视化图表展示功能。通过本文,您将学习到:数据模型设计、统计计算逻辑、图表组件实现以及数据查询优化等核心内容,帮助用户更好地了解自己的专注习惯。
一、功能需求分析
1.1 统计页面布局设计
图1:统计页面整体布局设计
┌─────────────────────────────────────┐
│  📊 专注统计                          │
├─────────────────────────────────────┤
│  ┌─────────────────────────────┐   │
│  │ 今日专注                     │   │
│  │                              │   │
│  │   🍅 8个番茄钟               │   │
│  │   ⏱️ 200分钟                 │   │
│  │   📝 完成5个待办             │   │
│  └─────────────────────────────┘   │
│                                     │
│  ┌─────────────────────────────┐   │
│  │ 本周统计                     │   │
│  │                              │   │
│  │  一  二  三  四  五  六  日   │   │
│  │  ▓▓  ▓▓▓ ▓▓ ▓▓▓▓ ▓▓ ▓  ▓▓▓  │   │
│  │  2   3   2   4    2   1   3   │   │
│  └─────────────────────────────┘   │
│                                     │
│  ┌─────────────────────────────┐   │
│  │ 累计统计                     │   │
│  │                              │   │
│  │   总专注时长: 50小时         │   │
│  │   总番茄钟: 100个            │   │
│  │   总待办: 80个               │   │
│  └─────────────────────────────┘   │
└─────────────────────────────────────┘
1.2 统计维度
| 维度 | 说明 | 展示方式 |
|---|---|---|
| 今日统计 | 今日专注数据 | 数字卡片 |
| 本周统计 | 近7天专注趋势 | 柱状图 |
| 本月统计 | 近30天专注趋势 | 折线图 |
| 累计统计 | 历史总数据 | 数字汇总 |
二、数据模型
2.1 统计数据模型
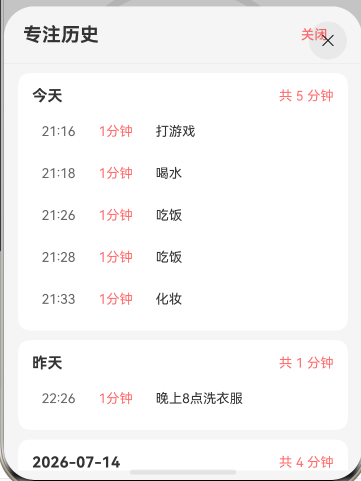
【图2:统计图表效果】
typescript
// src/main/ets/model/StatisticsModel.ets

export class DailyStatistics {
  date: string = '';              // 日期 YYYY-MM-DD
  pomodoroCount: number = 0;      // 番茄钟数
  focusMinutes: number = 0;       // 专注分钟数
  completedTodos: number = 0;     // 完成待办数
}

export class StatisticsSummary {
  // 今日统计
  todayPomodoros: number = 0;
  todayMinutes: number = 0;
  todayTodos: number = 0;

  // 本周统计
  weekPomodoros: number = 0;
  weekMinutes: number = 0;
  weekData: DailyStatistics[] = [];

  // 累计统计
  totalPomodoros: number = 0;
  totalMinutes: number = 0;
  totalTodos: number = 0;
}

export class ChartData {
  label: string = '';      // 标签(日期)
  value: number = 0;       // 数值
  color: string = '';      // 颜色
}
2.2 统计计算逻辑
typescript
// src/main/ets/viewmodel/StatisticsViewModel.ets

export class StatisticsViewModel {
  private focusRepository: FocusRepository;
  private todoRepository: TodoRepository;

  /**
   * 获取今日统计
   */
  async getTodayStatistics(): Promise<DailyStatistics> {
    const today = DateTimeUtil.formatDate(new Date());
    const records = await this.focusRepository.getRecordsByDate(today);

    const statistics = new DailyStatistics();
    statistics.date = today;
    statistics.pomodoroCount = records.length;
    statistics.focusMinutes = records.reduce((sum, r) => sum + r.duration, 0);

    const todos = await this.todoRepository.getCompletedByDate(today);
    statistics.completedTodos = todos.length;

    return statistics;
  }

  /**
   * 获取本周统计
   */
  async getWeekStatistics(): Promise<DailyStatistics[]> {
    const weekData: DailyStatistics[] = [];
    const today = new Date();

    for (let i = 6; i >= 0; i--) {
      const date = new Date(today);
      date.setDate(date.getDate() - i);

      const dateStr = DateTimeUtil.formatDate(date);
      const dayStats = await this.getDayStatistics(dateStr);
      weekData.push(dayStats);
    }

    return weekData;
  }

  /**
   * 获取累计统计
   */
  async getTotalStatistics(): Promise<StatisticsSummary> {
    const summary = new StatisticsSummary();

    const allRecords = await this.focusRepository.getAllRecords();
    summary.totalPomodoros = allRecords.length;
    summary.totalMinutes = allRecords.reduce((sum, r) => sum + r.duration, 0);

    const allTodos = await this.todoRepository.getAllTodos();
    summary.totalTodos = allTodos.filter(t => t.completed).length;

    return summary;
  }
}
三、统计页面实现
3.1 页面结构
【图3:统计卡片效果】
typescript
// src/main/ets/pages/StatisticsPage.ets

@Entry
@Component
struct StatisticsPage {
  @State todayStats: DailyStatistics = new DailyStatistics();
  @State weekData: DailyStatistics[] = [];
  @State totalStats: StatisticsSummary = new StatisticsSummary();
  @State isLoading: boolean = true;

  async aboutToAppear() {
    await this.loadStatistics();
  }

  async loadStatistics() {
    const viewModel = new StatisticsViewModel();

    this.todayStats = await viewModel.getTodayStatistics();
    this.weekData = await viewModel.getWeekStatistics();
    this.totalStats = await viewModel.getTotalStatistics();

    this.isLoading = false;
  }

  build() {
    Column() {
      this.TitleBar()

      if (this.isLoading) {
        this.LoadingView()
      } else {
        this.StatisticsContent()
      }
    }
    .width('100%')
    .height('100%')
    .backgroundColor('#F5F5F5')
  }
}
3.2 今日统计卡片
typescript
@Builder
TodayStatisticsCard() {
  Column() {
    Text('今日专注')
      .fontSize(16)
      .fontWeight(FontWeight.Bold)
      .margin({ bottom: 15 })

    Row() {
      // 番茄钟数
      Column() {
        Text('🍅')
          .fontSize(24)
        Text(`${this.todayStats.pomodoroCount}`)
          .fontSize(28)
          .fontWeight(FontWeight.Bold)
          .fontColor('#FF6B6B')
        Text('个番茄钟')
          .fontSize(12)
          .fontColor('#999999')
      }
      .layoutWeight(1)

      // 专注时长
      Column() {
        Text('⏱️')
          .fontSize(24)
        Text(`${this.todayStats.focusMinutes}`)
          .fontSize(28)
          .fontWeight(FontWeight.Bold)
          .fontColor('#4CAF50')
        Text('分钟')
          .fontSize(12)
          .fontColor('#999999')
      }
      .layoutWeight(1)

      // 完成待办
      Column() {
        Text('📝')
          .fontSize(24)
        Text(`${this.todayStats.completedTodos}`)
          .fontSize(28)
          .fontWeight(FontWeight.Bold)
          .fontColor('#2196F3')
        Text('个待办')
          .fontSize(12)
          .fontColor('#999999')
      }
      .layoutWeight(1)
    }
    .width('100%')
  }
  .width('100%')
  .padding(20)
  .backgroundColor('#FFFFFF')
  .borderRadius(12)
  .margin({ top: 15, left: 15, right: 15 })
}
3.3 本周统计图表
typescript
@Builder
WeekChartCard() {
  Column() {
    Text('本周统计')
      .fontSize(16)
      .fontWeight(FontWeight.Bold)
      .margin({ bottom: 15 })

    // 柱状图
    Row() {
      ForEach(this.weekData, (day: DailyStatistics, index: number) => {
        Column() {
          // 柱子
          Column()
            .width(20)
            .height(this.getBarHeight(day.pomodoroCount))
            .backgroundColor('#FF6B6B')
            .borderRadius({ topLeft: 4, topRight: 4 })

          // 日期标签
          Text(this.getWeekDayLabel(index))
            .fontSize(10)
            .fontColor('#999999')
            .margin({ top: 5 })
        }
        .layoutWeight(1)
        .justifyContent(FlexAlign.End)
      })
    }
    .width('100%')
    .height(120)
  }
  .width('100%')
  .padding(20)
  .backgroundColor('#FFFFFF')
  .borderRadius(12)
  .margin({ top: 15, left: 15, right: 15 })
}

// 计算柱子高度
private getBarHeight(count: number): number {
  const maxHeight = 80;
  const maxCount = Math.max(...this.weekData.map(d => d.pomodoroCount), 1);
  return (count / maxCount) * maxHeight;
}

// 获取星期标签
private getWeekDayLabel(index: number): string {
  const labels = ['一', '二', '三', '四', '五', '六', '日'];
  return labels[index];
}
3.4 累计统计卡片
typescript
@Builder
TotalStatisticsCard() {
  Column() {
    Text('累计统计')
      .fontSize(16)
      .fontWeight(FontWeight.Bold)
      .margin({ bottom: 15 })

    Column() {
      // 总专注时长
      Row() {
        Text('总专注时长')
          .fontSize(14)
          .fontColor('#666666')

        Blank()

        Text(`${Math.floor(this.totalStats.totalMinutes / 60)}小时${this.totalStats.totalMinutes % 60}分钟`)
          .fontSize(14)
          .fontWeight(FontWeight.Bold)
          .fontColor('#FF6B6B')
      }
      .width('100%')
      .margin({ bottom: 10 })

      // 总番茄钟
      Row() {
        Text('总番茄钟')
          .fontSize(14)
          .fontColor('#666666')

        Blank()

        Text(`${this.totalStats.totalPomodoros}个`)
          .fontSize(14)
          .fontWeight(FontWeight.Bold)
          .fontColor('#4CAF50')
      }
      .width('100%')
      .margin({ bottom: 10 })

      // 总完成待办
      Row() {
        Text('总完成待办')
          .fontSize(14)
          .fontColor('#666666')

        Blank()

        Text(`${this.totalStats.totalTodos}个`)
          .fontSize(14)
          .fontWeight(FontWeight.Bold)
          .fontColor('#2196F3')
      }
      .width('100%')
    }
  }
  .width('100%')
  .padding(20)
  .backgroundColor('#FFFFFF')
  .borderRadius(12)
  .margin({ top: 15, left: 15, right: 15, bottom: 15 })
}
四、数据查询实现
4.1 按日期查询
typescript
// src/main/ets/repository/FocusRepository.ets

export class FocusRepository {
  /**
   * 获取指定日期的专注记录
   */
  async getRecordsByDate(date: string): Promise<FocusRecord[]> {
    const allRecords = await this.getAllRecords();
    return allRecords.filter(record => {
      const recordDate = DateTimeUtil.formatDate(new Date(record.startTime));
      return recordDate === date;
    });
  }

  /**
   * 获取日期范围内的专注记录
   */
  async getRecordsByDateRange(startDate: string, endDate: string): Promise<FocusRecord[]> {
    const allRecords = await this.getAllRecords();
    return allRecords.filter(record => {
      const recordDate = DateTimeUtil.formatDate(new Date(record.startTime));
      return recordDate >= startDate && recordDate <= endDate;
    });
  }
}
4.2 待办统计查询
typescript
// src/main/ets/repository/TodoRepository.ets

export class TodoRepository {
  /**
   * 获取指定日期完成的待办
   */
  async getCompletedByDate(date: string): Promise<TodoItem[]> {
    const allTodos = await this.getAllTodos();
    return allTodos.filter(todo => {
      if (!todo.completed) return false;
      const completedDate = DateTimeUtil.formatDate(new Date(todo.completedAt || todo.createdAt));
      return completedDate === date;
    });
  }
}
五、总结
本文实现了专注数据统计和图表展示功能,核心要点:
- 数据模型:DailyStatistics、StatisticsSummary
- 统计计算:今日、本周、累计统计
- 图表展示:柱状图、数字卡片
- 数据查询:按日期范围查询