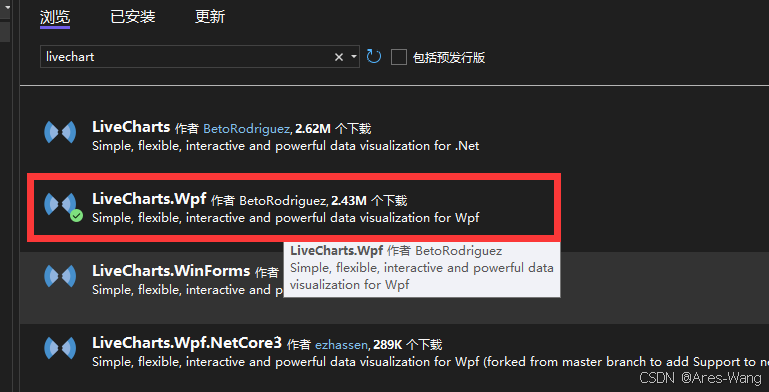
<Window x:Class="WpfApp1.MainWindow"
        xmlns="http://schemas.microsoft.com/winfx/2006/xaml/presentation"
        xmlns:x="http://schemas.microsoft.com/winfx/2006/xaml"
        xmlns:d="http://schemas.microsoft.com/expression/blend/2008"
        xmlns:mc="http://schemas.openxmlformats.org/markup-compatibility/2006"
        xmlns:local="clr-namespace:WpfApp1" xmlns:wpf="clr-namespace:LiveCharts.Wpf;assembly=LiveCharts.Wpf"
        mc:Ignorable="d"
        Title="MainWindow" Height="450" Width="800">
    <Grid>
        <wpf:CartesianChart AnimationsSpeed="0:0:0:2" LegendLocation="Bottom" >
            <wpf:CartesianChart.Series  >
                <wpf:LineSeries DataLabels="True"  Fill="Azure" Stroke="Green" Values="10,4,40,8,18"  Title="AAAAA">
                </wpf:LineSeries>
                <wpf:LineSeries Values="22,7,20,4,38" Title="BBBB" ></wpf:LineSeries>
            </wpf:CartesianChart.Series>
            <wpf:CartesianChart.AxisX  >
                <wpf:Axis Title="xxxxx" ShowLabels="True" Labels="{Binding Tit}">
                   <wpf:Axis.Separator>
                     <wpf:Separator StrokeThickness="0.5" Step="1" />
                  </wpf:Axis.Separator>
                </wpf:Axis>
            </wpf:CartesianChart.AxisX>
        </wpf:CartesianChart>

    </Grid>
</Window>
# Stroke  是描边的颜色
》》》后端事件添加数据
   <wpf:CartesianChart Name="chart"/>

    SeriesCollection series = new SeriesCollection()
    {
        new LineSeries
        {
            Values = new ChartValues<double> { 3, 5, 7, 4 },
            Fill=new SolidColorBrush(Colors.IndianRed),
        },

    };
    chart.Series = series;
>>>MVVM绑定
 <wpf:CartesianChart Name="chart"/>
   //MainWindow中进行绑定
  this.DataContext = new MainViewModel();

  //MainWindow的ViewModel类
   public class MainViewModel : INotifyPropertyChanged
    {

        public event PropertyChangedEventHandler PropertyChanged;
        protected virtual void OnPropertyChanged([CallerMemberName] string name = "")
        {
            PropertyChanged?.Invoke(this, new PropertyChangedEventArgs(name));
        }

        private SeriesCollection _series;
        public SeriesCollection Series
        {
            get
            {
                return _series;
            }
            set
            {
                _series = value;
                OnPropertyChanged();
            }
        }


        public MainViewModel()
        {
            Series = new SeriesCollection()
            {
                new LineSeries
                {
                    Values = new ChartValues<double> { 3, 5, 7, 4,100,50,2 },
                    Fill=new SolidColorBrush(Colors.LightGreen),
                },

            };
        }
    }