自定义tooltip,解决图表数据重叠,无法准确点击事件问题!
效果图
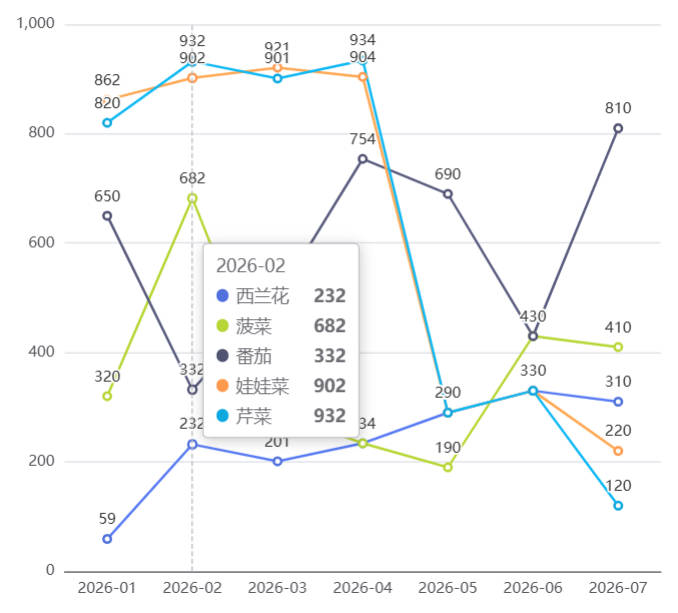
问题: 图表数据重叠,导致无法准确点击事件;
解决方式: 发现小程序里 ECharts 的 canvas tooltip 无法对单行做点击,所以改为自定义 tooltip 浮层,交互如下:
- 点击图表某一列区域(不必点中数字)→ 弹出 tooltip;
- 点击 tooltip 中的「内容」行 → 实现跳转页面等逻辑;
- 点击图表空白处 → 关闭 tooltip;
解决方式
修改文件:
-
index.js
- 关闭 ECharts 内置 tooltip
- 去掉折线数字上的
triggerEvent(不再通过数字点击跳转) - 监听图表区域点击,按坐标换算
dataIndex并显示自定义 tooltip - 行点击后触发
lineclick事件
-
index.wxml、index.wxss
- 新增可点击的 tooltip 浮层,带与图例一致的颜色标记;
- 可根据图例颜色给tooltip-marker修改颜色;这里示例就没有进一步处理了;
html
     <view class="echartsBox">
       <block wx:if="{{ chartData && chartData.length }}">
         <ec-canvas id="{{ chartId }}" canvas-id="{{ canvasId }}" ec="{{ ec }}"></ec-canvas>

         <view
           wx:if="{{ tooltipPanel.visible }}"
           class="chart-tooltip-panel"
           style="left: {{ tooltipPanel.left }}px; top: {{ tooltipPanel.top }}px;"
           catchtap="noop"
         >
           <view class="tooltip-title">{{ tooltipPanel.name }}</view>
           <view class="tooltip-row tooltip-row-action" catchtap="onTooltipRowTap" data-type="4">
             <view class="tooltip-label">
               <view class="tooltip-marker tooltip-marker-bar"></view>
               <text>{{ tooltipPanel.largeLabel }}</text>
             </view>
             <text class="tooltip-value">{{ tooltipPanel.largeValue }}</text>
           </view>
         </view>
       </block>

       <view wx:else class="empty-tip">
         暂无数据
       </view>
     </view>
javascript
/** 自定义 tooltip 预估尺寸(px),用于边界约束 */
const TOOLTIP_PANEL_WIDTH = 168;
const TOOLTIP_PANEL_HEIGHT = 128;

/**
 * 图表点击事件
 */
bindChartClick(chart) {
    if (!chart) return;
    const zr = chart.getZr();
    zr.off('click');
    zr.on('click', (event) => {
        if (!componentRef) return;
        const pointInPixel = [event.offsetX, event.offsetY];
        if (!chart.containPixel('grid', pointInPixel)) {
            componentRef.hideTooltipPanel();
            return;
        }
        const dataIndex = componentRef.resolveDataIndex(chart, pointInPixel);
        if (dataIndex != null) {
            componentRef.showTooltipPanel(dataIndex, pointInPixel);
        }
    });
},

/**
 * 显示 panel
 * 监听图表区域点击,按坐标换算
 */
showTooltipPanel(dataIndex, pointInPixel) {
	const dataList = this.data.dataList;
	const item = dataList[dataIndex];
	if (!item) return;

	const legendData = this.properties.chartLegend || [];

	this.createSelectorQuery()
		.select('.echartsBox')
		.boundingClientRect((rect) => {
			let left = pointInPixel[0] + 10;
			let top = pointInPixel[1] - TOOLTIP_PANEL_HEIGHT - 10;

			if (rect) {
				if (left + TOOLTIP_PANEL_WIDTH > rect.width) {
					left = rect.width - TOOLTIP_PANEL_WIDTH - 8;
				}
				if (left < 8) left = 8;
				if (top < 8) top = pointInPixel[1] + 12;
				if (top + TOOLTIP_PANEL_HEIGHT > rect.height) {
					top = rect.height - TOOLTIP_PANEL_HEIGHT - 8;
				}
			}

			this.setData({
				tooltipPanel: {
					visible: true,
					left,
					top,
					dataIndex,
					name: item.name,
                    // TEST ,可根据需求遍历legendData,赋值
					label: legendData[0],
					value: item.value,
				},
			});
		})
		.exec();
},

/**
 * 隐藏 panel
 */
hideTooltipPanel() {
	if (!this.data.tooltipPanel.visible) return;
	this.setData({
		'tooltipPanel.visible': false,
	});
},

/**
 * 点击 tool 行跳转事件
 */
onTooltipRowTap(e) {
    const type = Number(e.currentTarget.dataset.ype);
    const {
        dataIndex,
        visible
    } = this.data.tooltipPanel;
    if (!visible || dataIndex == null) return;

    const dataList = this.getSortedChartData();
    const item = dataList[dataIndex];
    if (!item) return;


    this.triggerEvent('lineclick', {
        item,
        dataIndex,
        type,
    });
    this.hideTooltipPanel();
},
css
.echartsBox {
  position: relative;
  width: 100%;
  flex: 1;
  min-height: 0;
  height: 100%;
  padding-top: 20rpx;
  background: #fff;
  overflow: hidden;
  box-sizing: border-box;
}

.chart-tooltip-panel {
  position: absolute;
  z-index: 10;
  min-width: 280rpx;
  max-width: 420rpx;
  padding: 16rpx 20rpx;
  background: rgba(255, 255, 255, 0.98);
  border: 1px solid #e8e8e8;
  border-radius: 8rpx;
  box-shadow: 0 4rpx 16rpx rgba(0, 0, 0, 0.08);
  box-sizing: border-box;
  pointer-events: auto;
}

.tooltip-title {
  margin-bottom: 8rpx;
  font-size: 22rpx;
  font-weight: 500;
  color: #1e1e1e;
}

.tooltip-row {
  display: flex;
  align-items: center;
  justify-content: space-between;
  gap: 20rpx;
  padding: 6rpx 0;
  font-size: 20rpx;
  color: #333;
  line-height: 1.4;
}

.tooltip-row-action {
  margin: 0 -12rpx;
  padding: 10rpx 12rpx;
  border-radius: 6rpx;
}

.tooltip-row-action:active {
  background: #f5f7fa;
}

.tooltip-label {
  display: flex;
  align-items: center;
  flex: 1;
  min-width: 0;
}

.tooltip-marker {
  flex-shrink: 0;
  width: 16rpx;
  height: 16rpx;
  margin-right: 10rpx;
}

.tooltip-marker-bar {
  border-radius: 2rpx;
  background: #96e6a1;
}

.tooltip-value {
  flex-shrink: 0;
  color: #1e1e1e;
}