本文通过一个完整的 HTML 示例,带你掌握在 Cesium 中加载和渲染 GeoJSON 数据的核心技巧,包括点、线、面的绘制,以及行政区划边界的自定义着色与标注。
一、前言
GeoJSON 是地理信息领域最通用的数据交换格式之一。无论是地图上的兴趣点(POI)、道路线,还是行政区划边界,都可以用 GeoJSON 来表达。
在 Cesium 中,Cesium.GeoJsonDataSource 提供了开箱即用的 GeoJSON 解析和渲染能力。今天我们就通过一个完整示例,把从底图加载到数据渲染的全流程跑通。
二、运行效果预览
运行这段代码后,你会看到: 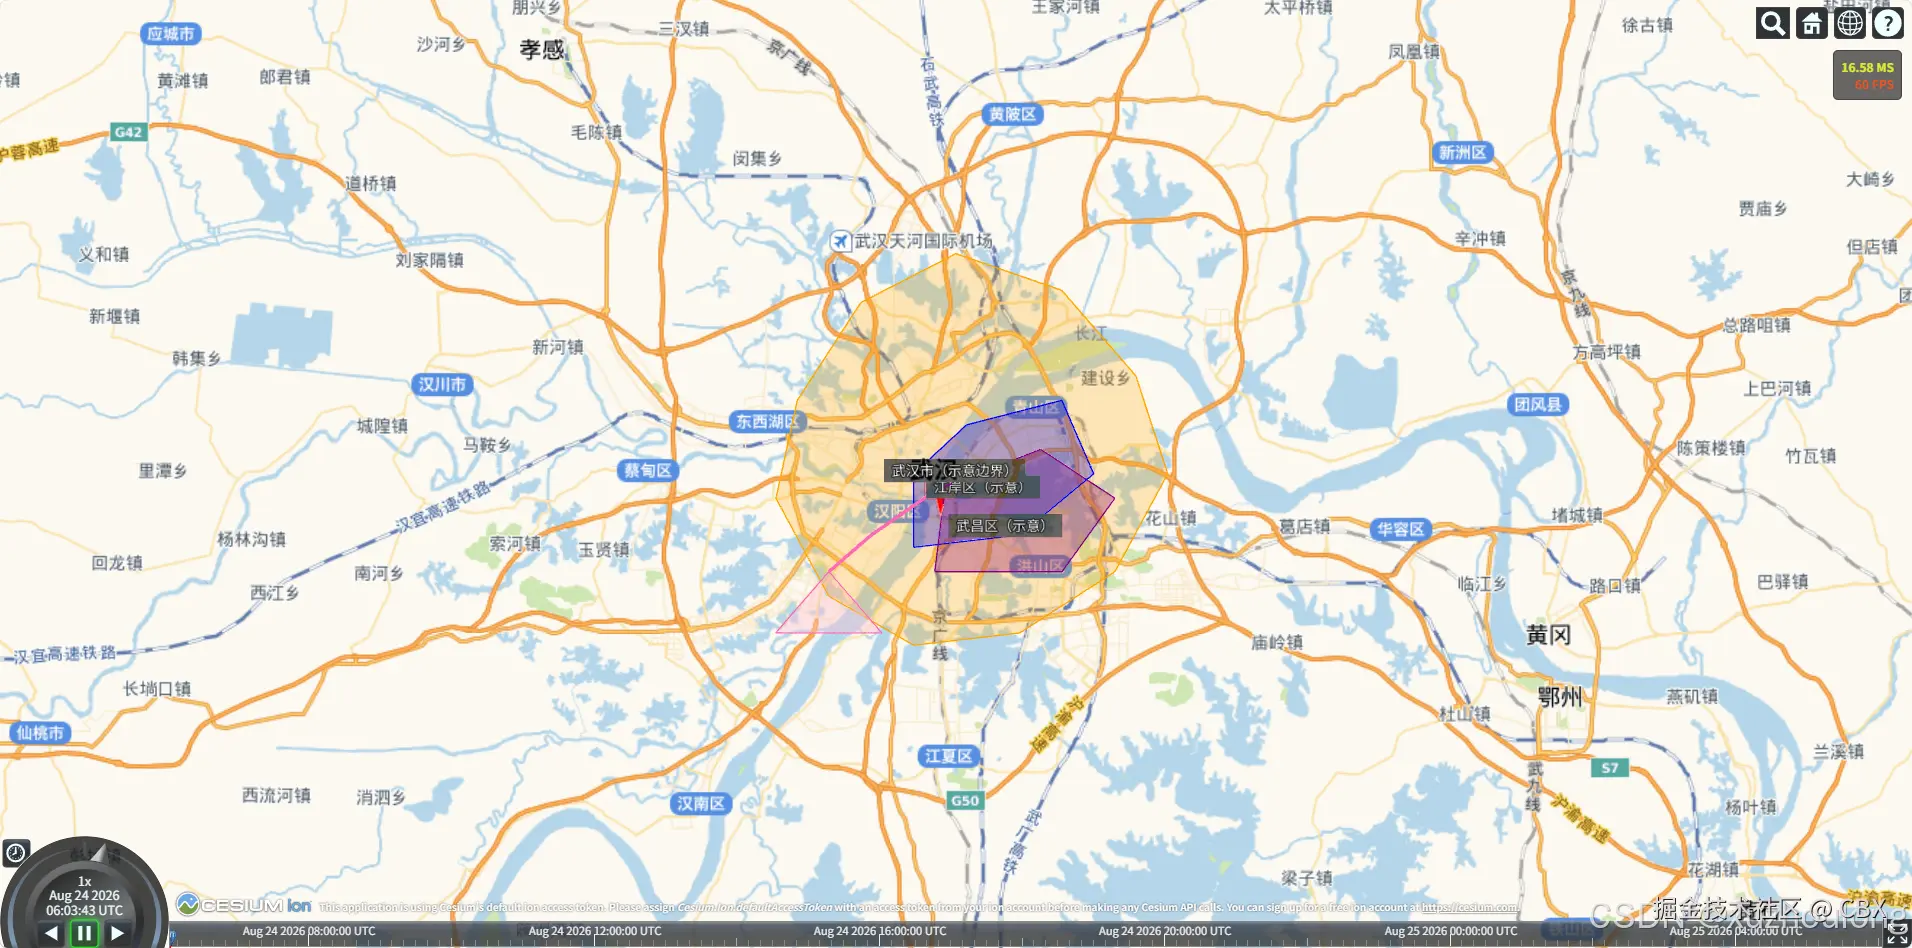
- 高德路网底图作为基础地图
- 三个基础地理要素:黄鹤楼点标记、一条折线航线、一个三角形面
- 武汉市行政区划示意:市级边界(橙色)和两个区级边界(蓝色/紫色),每个区域中心都带有名称标注
- 帧率显示 :开启
debugShowFramesPerSecond方便性能观察 - 无绿色选择框 :通过
selectionIndicator: false禁用了默认的实体选择指示器
视角会飞向武汉市区,初始视野高度约 150 公里。
三、完整代码
html
<!doctype html>
<html>
  <head>
    <meta charset="UTF-8" />
    <script src="https://cdn.jsdelivr.net/npm/cesium@1.140.0/Build/Cesium/Cesium.js"></script>
    <link
      href="https://cdn.jsdelivr.net/npm/cesium@1.140.0/Build/Cesium/Widgets/widgets.css"
      rel="stylesheet"
    />
  </head>

  <body style="margin:0; overflow:hidden; background:#fff; width:100%; height:100%; position:absolute; top:0;">
    <div id="map" style="margin:0 auto; width:100%; height:100%;"></div>
    <script type="text/javascript">
      (async function () {
        // ================= 1. 初始化 Viewer =================
        const viewer = new Cesium.Viewer("map", {
          baseLayer: false,          // 不加载默认底图,避免需要 Cesium Ion Token
          baseLayerPicker: false,
          selectionIndicator: false, // 禁用绿色选择框
          infoBox: false,            // 禁用右上角信息框
        });
        viewer.scene.debugShowFramesPerSecond = true; // 显示帧率

        // ================= 2. 加载高德底图(路网图) =================
        const xyz = new Cesium.UrlTemplateImageryProvider({
          url: "https://webrd04.is.autonavi.com/appmaptile?lang=zh_cn&size=1&scale=1&style=7&x={x}&y={y}&z={z}",
        });
        viewer.imageryLayers.addImageryProvider(xyz);

        // ================= 3. 示例1:简单 GeoJSON(点 / 线 / 面) =================
        const simpleGeoJson = {
          type: "FeatureCollection",
          features: [
            // 点要素:黄鹤楼
            {
              type: "Feature",
              properties: { name: "黄鹤楼", type: "landmark" },
              geometry: { type: "Point", coordinates: [114.3055, 30.5433] },
            },
            // 线要素:示例航线
            {
              type: "Feature",
              properties: { name: "示例航线", type: "route" },
              geometry: {
                type: "LineString",
                coordinates: [
                  [114.2, 30.5],
                  [114.24, 30.53],
                  [114.29, 30.56],
                  [114.34, 30.59],
                ],
              },
            },
            // 面要素:三角形(闭合)
            {
              type: "Feature",
              properties: { name: "示例面", type: "area" },
              geometry: {
                type: "Polygon",
                coordinates: [[
                  [114.15, 30.45],
                  [114.25, 30.45],
                  [114.2, 30.5],
                  [114.15, 30.45], // 首尾闭合
                ]],
              },
            },
          ],
        };

        const simpleDs = await Cesium.GeoJsonDataSource.load(simpleGeoJson, {
          stroke: Cesium.Color.HOTPINK,
          fill: Cesium.Color.PINK.withAlpha(0.4),
          strokeWidth: 3,
          markerColor: Cesium.Color.RED,
        });
        viewer.dataSources.add(simpleDs);

        // ================= 4. 示例2:行政区划边界(多级 Polygon) =================
        const adminGeoJson = {
          type: "FeatureCollection",
          features: [
            // 市级边界(外圈)
            {
              type: "Feature",
              properties: { name: "武汉市(示意边界)", level: "city", adcode: "420100" },
              geometry: {
                type: "Polygon",
                coordinates: [[
                  [114.2, 30.48], [114.28, 30.44], [114.38, 30.45],
                  [114.47, 30.5],  [114.52, 30.58], [114.49, 30.66],
                  [114.42, 30.73], [114.32, 30.76], [114.23, 30.72],
                  [114.17, 30.64], [114.15, 30.56], [114.2, 30.48],
                ]],
              },
            },
            // 区级边界:江岸区(示意)
            {
              type: "Feature",
              properties: { name: "江岸区(示意)", level: "district" },
              geometry: {
                type: "Polygon",
                coordinates: [[
                  [114.28, 30.52], [114.38, 30.53], [114.45, 30.58],
                  [114.42, 30.64], [114.33, 30.62], [114.28, 30.58],
                  [114.28, 30.52],
                ]],
              },
            },
            // 区级边界:武昌区(示意)
            {
              type: "Feature",
              properties: { name: "武昌区(示意)", level: "district" },
              geometry: {
                type: "Polygon",
                coordinates: [[
                  [114.3, 30.5], [114.42, 30.5], [114.47, 30.56],
                  [114.4, 30.6], [114.31, 30.57], [114.3, 30.5],
                ]],
              },
            },
          ],
        };

        const adminDs = await Cesium.GeoJsonDataSource.load(adminGeoJson, {
          stroke: Cesium.Color.ORANGE,
          fill: Cesium.Color.ORANGE.withAlpha(0.2),
          strokeWidth: 3,
        });
        viewer.dataSources.add(adminDs);

        // ================= 5. 按属性动态着色 =================
        adminDs.entities.values.forEach((entity) => {
          const name = entity.properties?.name?.getValue(Cesium.JulianDate.now()) || "";
          if (name.includes("江岸")) {
            entity.polygon.material = Cesium.Color.BLUE.withAlpha(0.35);
            entity.polygon.outlineColor = Cesium.Color.BLUE;
          } else if (name.includes("武昌")) {
            entity.polygon.material = Cesium.Color.PURPLE.withAlpha(0.35);
            entity.polygon.outlineColor = Cesium.Color.PURPLE;
          } else {
            entity.polygon.material = Cesium.Color.ORANGE.withAlpha(0.25);
            entity.polygon.outlineColor = Cesium.Color.ORANGE;
          }
        });

        // ================= 6. 为行政边界添加中心标注 =================
        function addBoundaryLabel(feature) {
          const ring = feature.geometry.coordinates[0];
          let lon = 0, lat = 0;
          ring.forEach((c) => { lon += c[0]; lat += c[1]; });
          lon /= ring.length;
          lat /= ring.length;

          viewer.entities.add({
            position: Cesium.Cartesian3.fromDegrees(lon, lat),
            label: {
              text: feature.properties.name,
              font: "14px sans-serif",
              fillColor: Cesium.Color.WHITE,
              outlineColor: Cesium.Color.BLACK,
              outlineWidth: 3,
              style: Cesium.LabelStyle.FILL_AND_OUTLINE,
              showBackground: true,
              backgroundColor: Cesium.Color.BLACK.withAlpha(0.6),
              backgroundPadding: new Cesium.Cartesian2(8, 5),
            },
          });
        }
        adminGeoJson.features.forEach(addBoundaryLabel);

        // ================= 7. 视角飞向武汉 =================
        viewer.camera.flyTo({
          destination: Cesium.Cartesian3.fromDegrees(114.32, 30.58, 150000),
        });
      })();
    </script>
  </body>
</html>
四、技术要点解析
1. 无需 Cesium Ion Token 的底图方案
示例中禁用了 Cesium 默认的底图(baseLayer: false),转而使用高德地图的 XYZ 瓦片服务。这对国内开发者非常友好,无需注册和配置 Ion Token 即可快速开始。
javascript
const xyz = new Cesium.UrlTemplateImageryProvider({
  url: "https://webrd04.is.autonavi.com/appmaptile?lang=zh_cn&size=1&scale=1&style=7&x={x}&y={y}&z={z}",
});
viewer.imageryLayers.addImageryProvider(xyz);
2. GeoJSON 数据结构
示例中的 simpleGeoJson 演示了三种最基本的几何类型:
| 类型 | 用途 | coordinates 格式 |
|---|---|---|
Point |
点 / 标记 | [经度, 纬度] |
LineString |
线 / 路径 | [[经度, 纬度], ...] |
Polygon |
面 / 区域 | [[[经度, 纬度], ...]](注意:Polygon 的坐标数组比 LineString 多一层嵌套,且首尾必须闭合) |
3. 按属性动态着色
通过遍历 dataSource.entities.values,我们可以读取每个要素的 properties,并据此修改其样式:
javascript
adminDs.entities.values.forEach((entity) => {
  const name = entity.properties?.name?.getValue(Cesium.JulianDate.now()) || "";
  if (name.includes("江岸")) {
    entity.polygon.material = Cesium.Color.BLUE.withAlpha(0.35);
  }
});
4. 边界中心点标注
由于 GeoJSON 中的 Polygon 没有直接提供中心点坐标,示例采用了一个简化方案:对边界的所有顶点经纬度取平均值,得到一个近似的几何中心。实际项目中,如果需要更精确的中心点,可以改用多边形质心算法。
五、运行方式
- 将上述完整代码保存为
.html文件。 - 在浏览器中直接打开即可运行(需要联网加载 Cesium CDN 资源和高德瓦片)。
- 建议使用 Chrome / Edge 等现代浏览器,并确保网络畅通。
六、常见扩展场景
基于这个基础示例,你可以轻松扩展到以下实际应用场景:
- 加载远程 GeoJSON 文件 :将
Cesium.GeoJsonDataSource.load()的参数改为文件 URL,如'./data/wuhan.geojson'。 - 点击弹出信息 :监听
viewer.selectedEntity变化,配合infoBox或自定义弹窗展示要素属性。 - 结合数据可视化:将 GeoJSON 的属性值映射为颜色、高度或大小,制作热力图或 3D 柱状图。
- 动态更新数据:定时刷新数据源,实现实时位置更新或轨迹回放。
七、结语
Cesium 对 GeoJSON 的支持非常完善,GeoJsonDataSource 封装了从解析到渲染的全流程,让开发者可以把更多精力放在业务逻辑和数据本身。
希望这篇示例能帮你快速上手 Cesium 的 GeoJSON 可视化。如果有任何问题或想了解更深入的话题(如自定义样式、大数据量优化等),欢迎在评论区交流讨论。😊
相关标签 :#Cesium #GeoJSON #地理可视化 #三维地图 #JavaScript