ArcGIS JS 基础教程(29):CSVLayer 表格点位图层
零、写在前面
📌 本系列教程完整目录 :ArcGIS JS 系列基础教程(100个项目常用热门功能)
💡 在线示例 :完整可运行的 HTML 示例,无需任何环境配置,可直接在浏览器中打开体验
🗂️ 专栏导航 :收藏 + 关注,专栏文章第一时间送达
❤️ 一键三连:点赞 + 评论 + 收藏
一、功能介绍
CSVLayer 用于加载包含经纬度字段的 CSV 表格文件 ,自动解析为点要素图层。它无需发布任何 GIS 服务,非常适合无服务端支持时直接把静态表格(传感器点位、气象站、POI 统计)空间化展示。
在三维 SceneView 中,CSVLayer 通过 elevationInfo 控制点位高度,并可用 3D 符号(球体/模型)与视觉变量做数据驱动可视化。
💡 经纬度字段如命名为
lat/latitude/y或lon/lng/longitude/x,API 会自动识别 ;若使用自定义字段名,才需要用latitudeField/longitudeField显式指定。
二、功能实现
2.1 创建并配置(3D)
javascript
const CSVLayer = await $arcgis.import("@arcgis/core/layers/CSVLayer.js");

const csvLayer = new CSVLayer({
    url: "https://earthquake.usgs.gov/earthquakes/feed/v1.0/summary/2.5_week.csv",
    copyright: "USGS Earthquakes",
    latitudeField: "latitude",     // 自定义字段名时指定
    longitudeField: "longitude",
    elevationInfo: { mode: "on-the-ground" },   // 三维必备:点贴地
    renderer: {
        type: "simple",
        symbol: {
            type: "point-3d",
            symbolLayers: [{
                type: "object",
                resource: { primitive: "sphere" },
                anchor: "bottom",
                material: { color: [255, 80, 0, 0.85] }
            }]
        },
        visualVariables: [{
            type: "size", field: "mag", axis: "all",
            stops: [{ value: 2.5, size: 8000 }, { value: 6, size: 40000 }]
        }]
    },
    popupTemplate: { title: "地震 M{mag}", content: "深度:{depth} km<br>地点:{place}" }
});
map.add(csvLayer);
2.2 让点位「浮」起来(高程模式)
javascript
// 相对地面抬高 5 万米,呈现悬浮点位效果
csvLayer.elevationInfo = { mode: "relative-to-ground", offset: 50000 };
2.3 自定义字段类型(numericFields 等)
对于需要参与渲染/查询的数值字段,可在 field 相关配置中声明类型,确保解析正确。
三、功能应用
| 应用场景 | 说明 |
|---|---|
| 传感器监测点位批量加载 | 直接读 CSV,无需建服务 |
| 气象站点可视化 | 按温度/风速做颜色/大小视觉变量 |
| 社会调查 POI 空间化 | 经纬度字段自动识别成点 |
| 实时 feed 接入 | 远程 CSV URL 自动刷新 |
四、核心代码
📦 完整代码 已保存至
sample/lesson29_csv_layer.html,可直接在浏览器打开。
html
<!DOCTYPE html>
<html lang="zh-CN">
<head>
    <meta charset="UTF-8">
    <meta name="viewport" content="width=device-width, initial-scale=1.0">
    <title>第29课:CSVLayer 表格点位图层</title>
    <link rel="stylesheet" href="https://js.arcgis.com/5.0/esri/themes/light/main.css">
    <script type="module" src="https://js.arcgis.com/5.0/"></script>
    <style>
        * { margin: 0; padding: 0; box-sizing: border-box; }
        body { font-family: "Microsoft YaHei", sans-serif; }
        #mapContainer { width: 100vw; height: 100vh; }
        .page-title {
            position: absolute; top: 20px; left: 50%; transform: translateX(-50%);
            background: rgba(255,255,255,0.95); padding: 10px 24px; border-radius: 6px;
            font-size: 18px; font-weight: bold; z-index: 100;
            box-shadow: 0 2px 8px rgba(0,0,0,0.15);
        }
        .control-panel {
            position: absolute; top: 80px; right: 20px;
            background: rgba(255,255,255,0.95); padding: 16px; border-radius: 8px;
            box-shadow: 0 2px 12px rgba(0,0,0,0.15);
            z-index: 100; min-width: 300px;
        }
        .control-panel h3 { margin: 0 0 8px 0; font-size: 14px; color: #333; }
        .section { margin-bottom: 12px; padding-bottom: 10px; border-bottom: 1px solid #eee; }
        .section:last-child { border-bottom: none; margin-bottom: 0; }
        .btn-row { display: flex; gap: 8px; flex-wrap: wrap; margin-top: 6px; }
        .btn-row button {
            flex: 1; min-width: 60px; padding: 6px 0;
            border: 1px solid #d9d9d9; border-radius: 4px;
            background: white; cursor: pointer; font-size: 12px;
        }
        .btn-row button:hover { border-color: #1890ff; color: #1890ff; }
        .btn-row button.on { background: #1890ff; color: white; border-color: #1890ff; }
        .info-card {
            margin-top: 10px; padding: 10px 12px;
            background: #f0f5ff; border-radius: 6px;
            border-left: 3px solid #1890ff; font-size: 12px; line-height: 1.6;
        }
        .info-card .val { font-weight: bold; color: #1890ff; }
        .status-text {
            position: absolute; bottom: 20px; left: 50%; transform: translateX(-50%);
            background: rgba(0,0,0,0.7); color: white; padding: 8px 20px;
            border-radius: 20px; font-size: 13px; z-index: 100; pointer-events: none;
            white-space: nowrap;
        }
    </style>
</head>
<body>
<h1 class="page-title">第29课:CSVLayer 表格点位图层</h1>

<div class="control-panel">
    <div class="section">
        <h3>📊 CSVLayer(3D 地震点位)</h3>
        <div class="btn-row">
            <button id="btnVisible" class="on">👁️ 显示 / 隐藏</button>
            <button id="btnFlyTo">🎯 全球视角</button>
        </div>
        <div class="btn-row">
            <button id="btnElev">📐 悬浮高程</button>
            <button id="btnColor">🌈 按震级着色</button>
        </div>
    </div>
    <div class="info-card">
        <div>图层状态:<span class="val" id="layerStatus">加载中...</span></div>
        <div>点击球体查看地震信息 ↑</div>
    </div>
</div>

<div class="status-text" id="statusText">CSVLayer | 3D 地震点位 · 按震级拉伸大小</div>

<div id="mapContainer"></div>

<script type="module">
    const Map = await $arcgis.import("@arcgis/core/Map.js");
    const SceneView = await $arcgis.import("@arcgis/core/views/SceneView.js");
    const CSVLayer = await $arcgis.import("@arcgis/core/layers/CSVLayer.js");
    const getTianditu = await $arcgis.import("https://openlayers.vip/examples/resources/tianditu.js");

    const vecLayers = getTianditu.default({ type: "vec_w" });
    const map = new Map({ basemap: { baseLayers: [vecLayers.base, vecLayers.anno] } });

    const view = new SceneView({
        container: "mapContainer", map: map,
        camera: {
            position: { longitude: 120, latitude: 30, z: 12000000 },
            heading: 0, tilt: 0
        }
    });
    window.view = view;

    function buildRenderer(colorByMag) {
        const base = {
            type: "simple",
            symbol: {
                type: "point-3d",
                symbolLayers: [{
                    type: "object",
                    resource: { primitive: "sphere" },
                    anchor: "bottom",
                    material: { color: [255, 80, 0, 0.85] }
                }]
            },
            visualVariables: [{
                type: "size", field: "mag", axis: "all",
                stops: [{ value: 2.5, size: 8000 }, { value: 6, size: 40000 }]
            }]
        };
        if (colorByMag) {
            base.visualVariables.push({
                type: "color", field: "mag",
                stops: [
                    { value: 2.5, color: "#2bdd36" },
                    { value: 4, color: "#ffd000" },
                    { value: 6, color: "#ff0000" }
                ]
            });
        }
        return base;
    }

    const csvLayer = new CSVLayer({
        url: "https://earthquake.usgs.gov/earthquakes/feed/v1.0/summary/2.5_week.csv",
        copyright: "USGS Earthquakes",
        latitudeField: "latitude",
        longitudeField: "longitude",
        elevationInfo: { mode: "on-the-ground" },
        renderer: buildRenderer(false),
        popupTemplate: { title: "地震 M{mag}", content: "深度:{depth} km<br>地点:{place}" }
    });
    map.add(csvLayer);

    view.when(() => {
        csvLayer.when(() => {
            document.getElementById("layerStatus").textContent = "已加载";
            view.goTo(csvLayer.fullExtent);
        }).catch(err => {
            document.getElementById("layerStatus").textContent = "加载失败";
            console.error(err);
        });
    });

    function setStatus(msg) { document.getElementById("statusText").textContent = msg; }

    document.getElementById("btnVisible").addEventListener("click", function () {
        csvLayer.visible = !csvLayer.visible;
        this.classList.toggle("on", csvLayer.visible);
        setStatus("图层:" + (csvLayer.visible ? "显示" : "隐藏"));
    });

    document.getElementById("btnFlyTo").addEventListener("click", () => {
        view.goTo({ position: { longitude: 120, latitude: 30, z: 12000000 }, tilt: 0 });
        setStatus("已回到全球视角");
    });

    // 悬浮高程:相对地面抬高 5 万米
    let floating = false;
    document.getElementById("btnElev").addEventListener("click", function () {
        floating = !floating;
        csvLayer.elevationInfo = floating
            ? { mode: "relative-to-ground", offset: 50000 }
            : { mode: "on-the-ground" };
        this.classList.toggle("on", floating);
        setStatus(floating ? "点位悬浮于地面 5 万米上空" : "点位贴地显示");
    });

    // 按震级着色
    let colored = false;
    document.getElementById("btnColor").addEventListener("click", function () {
        colored = !colored;
        csvLayer.renderer = buildRenderer(colored);
        this.classList.toggle("on", colored);
        setStatus(colored ? "已按震级着色" : "已恢复单色");
    });
</script>
</body>
</html>
五、在线示例
🔗 在线体验 :https://southjor.github.io/arcgis-examples/lessons/lesson29.html
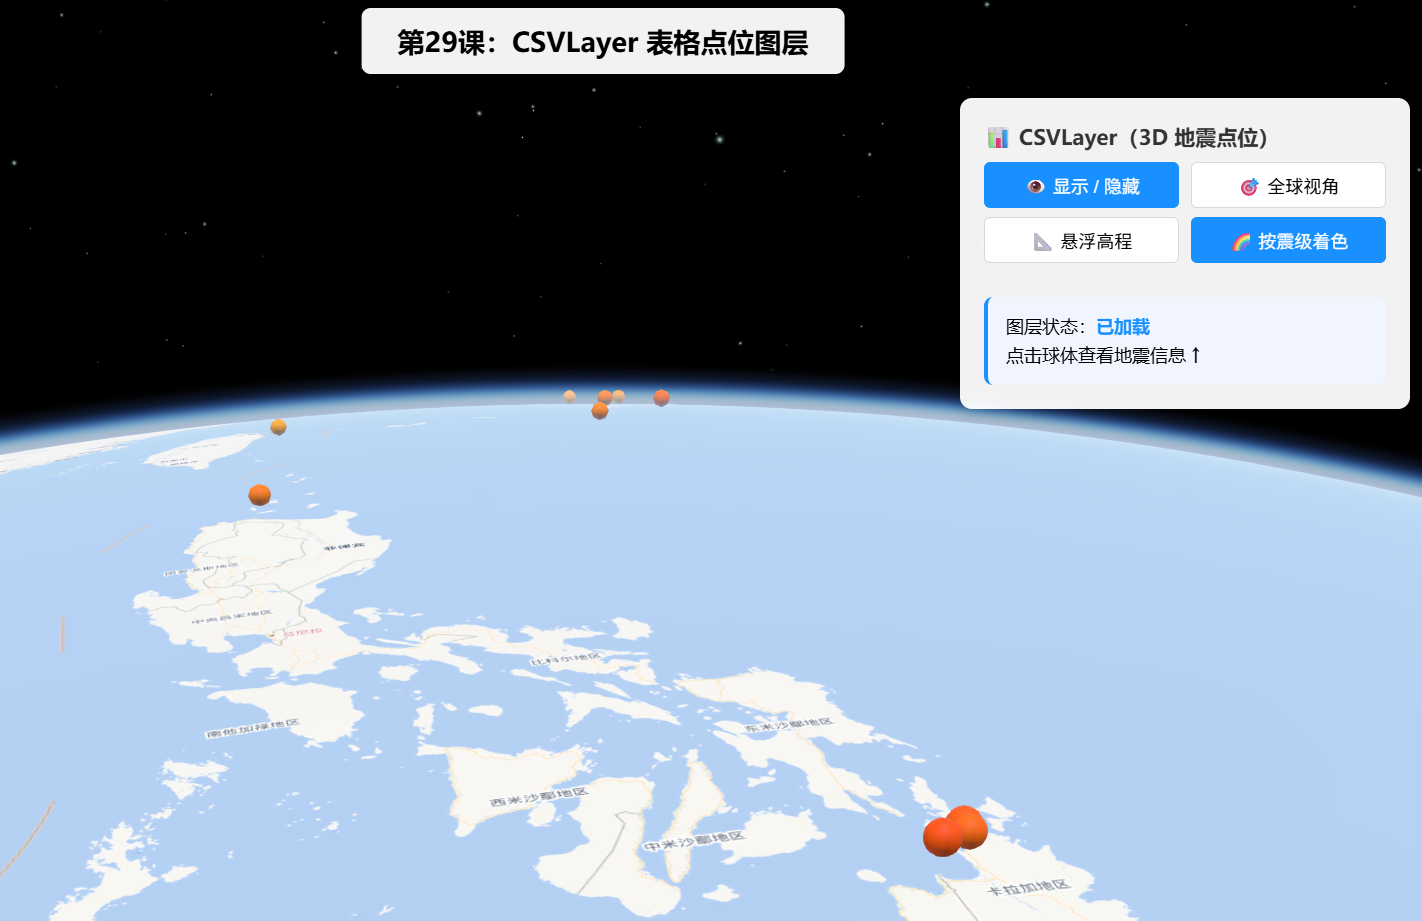
操作说明:
- 场景加载 USGS 全球地震 CSV,自动以 3D 球体符号渲染,并按震级(
mag)拉伸大小。- 点击「悬浮高程」切换
elevationInfo为relative-to-ground + 50000,观察点位升到空中。- 点击「按震级着色」追加
color视觉变量,绿→黄→红表示震级递增。- 点击球体弹出震级、深度、地点信息。
六、关键 API 说明
| API | 说明 |
|---|---|
new CSVLayer({ url, latitudeField, longitudeField }) |
加载 CSV 点位(字段可自动识别) |
elevationInfo: { mode } |
三维高程:on-the-ground / relative-to-ground(+offset) / absolute-height |
renderer + visualVariables |
3D 符号 + 大小/颜色数据驱动 |
popupTemplate |
点击弹窗,{字段名} 引用属性 |
queryFeatures() |
客户端/服务端查询 |
参考链接: CSVLayer API
七、系列导航
⬅️ 上一篇 :ArcGIS JS 基础教程(28):图层渲染顺序管理
💡 小贴士 :CSVLayer 是「零服务端」接入点位数据最快的方式。记住三维里必须配
elevationInfo才能正确放置;想做悬浮效果就用relative-to-ground + offset,比改几何简单得多。