最近基于GeoToolkit实现单井或多井的柱状图的显示和交互,特别是多井的连通对比分析,很多功能GeoToolkit原来是没有的。因此需要拓展了GeoToolKit的许多功能。本文主要基于GeoToolKit/INT组件,针对多井的测井曲线、岩性剖面、含油气性和射孔井段等进行对比分析展示。因此本次主要基于WellLogWidget实现多井的测井曲线、解释结论和岩性剖面的显示,以及连通性对比,同时支持用户拖动鼠标实现整口井井道的移动,连通性删减等交互操作。具体如下。其中的前后端内容详见之前文章。
1.多井连通性对比效果演示
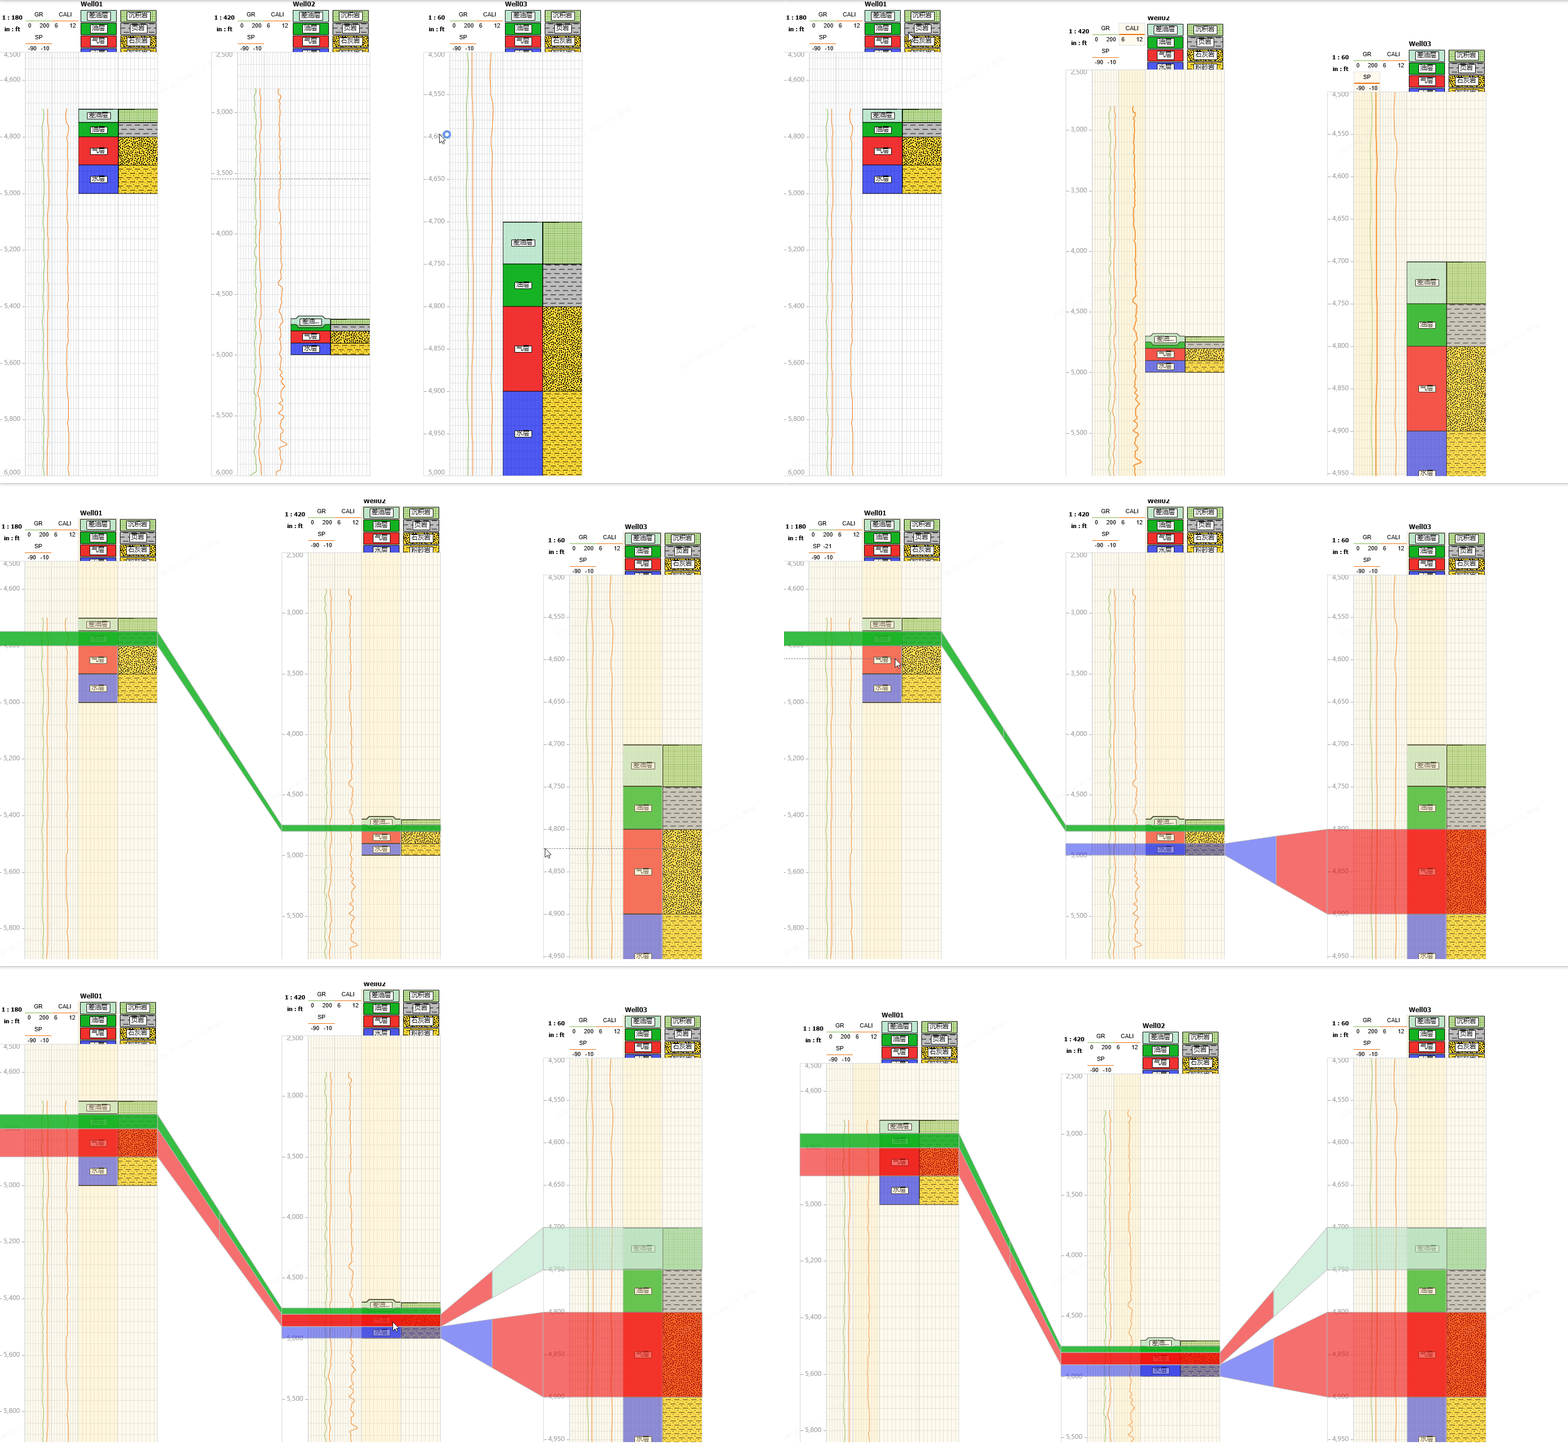
2.核心代码
主要采用VUE+JS+GeotoolKit.JS,充分利用VUE的组件化设计思想,实现多井多通道剖面显示和连通性交互操作等。
MultiWellDrag.vue
<template>
  <div>
  <canvas ref="plot" style="display:block;margin:0 auto;height:900px;position:relative;"
    />
  </div>
</template>
<script>
import {createScene, setupDragInteraction, setupZoneConnectionInteraction, createConnectionContext} from './MultiWellDrag.js';

let plot = null;
let disposeDrag = null;
let disposeZoneConn = null;
export default {
  name:'wellMultiDrag',
  destroyed () {
    if (disposeDrag) {
      disposeDrag();
      disposeDrag = null;
    }
    if (disposeZoneConn) {
      disposeZoneConn();
      disposeZoneConn = null;
    }
    plot.dispose();
  },
  mounted () {
    const canvas = this.$refs.plot;
    // 用容器实际宽度设置 canvas 像素宽,保证三口井铺满屏幕;高度固定 900    // 1.绘制单井曲线道和油气属性道
    const containerWidth = canvas.parentElement.clientWidth || window.innerWidth;
    console.log('containerWidth', containerWidth);
    canvas.width = containerWidth;
    canvas.height = 900;
    const scene = createScene(canvas);
    plot = scene.plot;
    // 创建连接上下文,在拖拽交互与连接交互之间共享连接关系
    const connectionContext = createConnectionContext();
    // 2.启用井道拖拽交互:按住鼠标左键拖动单井 header,整体移动 WellLogWidget;
    //   拖动时连接 zone 跟随移动,连接关系不变
    disposeDrag = setupDragInteraction(plot, canvas, scene.widgets, connectionContext);
    // 3.启用 zone 连接交互:点击一口井的 zone 再点击另一口井的 zone 自动连通
    disposeZoneConn = setupZoneConnectionInteraction(
      plot, canvas, scene.wellConfigs, scene.widgets,
      scene.wellWidth, scene.gap, scene.headerHeight, canvas.height, scene.zoneWellColors,
      connectionContext
    );
  }
};
</script>
MultiWellDrag.js
function createScene (canvas) {
    // 创建根 Group 容纳多个 WellLogWidget    const root = new Group();
    root.setAutoModelLimitsMode(true);

    const { widgets, wellWidth, gap, wellConfigs, headerHeight, zoneWellColors } = createWidgets(canvas.width, canvas.height);
    widgets.forEach(w => root.addChild(w));

    // // 在井间空白区域绘制连通性多边形
    // addCorrelationZones(root, wellConfigs, widgets, wellWidth, gap, headerHeight, canvas.height, zoneWellColors);

    const plot = new Plot({
        'canvasElement': canvas,
        'root': root
    });

    // 将每个 WellLogWidget 的内置工具(含 track splitter)注册到 Plot 的工具容器,
    // 使各井道的分隔线可拖拽调整宽度
    try {
        const plotTool = plot.getTool();
        widgets.forEach(w => {
            plotTool.add(w.getTool());
        });
    } catch (e) {
        console.warn('注册 widget 工具失败:', e);
    }

    return { plot, widgets, wellWidth, gap, wellConfigs, headerHeight, zoneWellColors };
}
/**
 * 创建连接上下文:在拖拽交互与连接交互之间共享连接关系数据。
 * setupZoneConnectionInteraction 负责注册连接和更新函数,
 * setupDragInteraction 在拖动井道时调用更新函数让连接 zone 跟随移动。
 */
function createConnectionContext () {
    return {
        connections: [],
        updateConnectionsForWidget: null,
        updateAllConnections: null,
        isDragging: false, // 拖拽进行中标记,bounds 监控时跳过避免重复更新
        addConnection (conn) {
            this.connections.push(conn);
        },
        getConnectionsForWidget (widgetIndex) {
            return this.connections.filter(function (c) {
                return c.s1.widgetIndex === widgetIndex || c.s2.widgetIndex === widgetIndex;
            });
        }
    };
}
......后续代码需要请联系。