卡片容器页面 ------ 技术实现说明
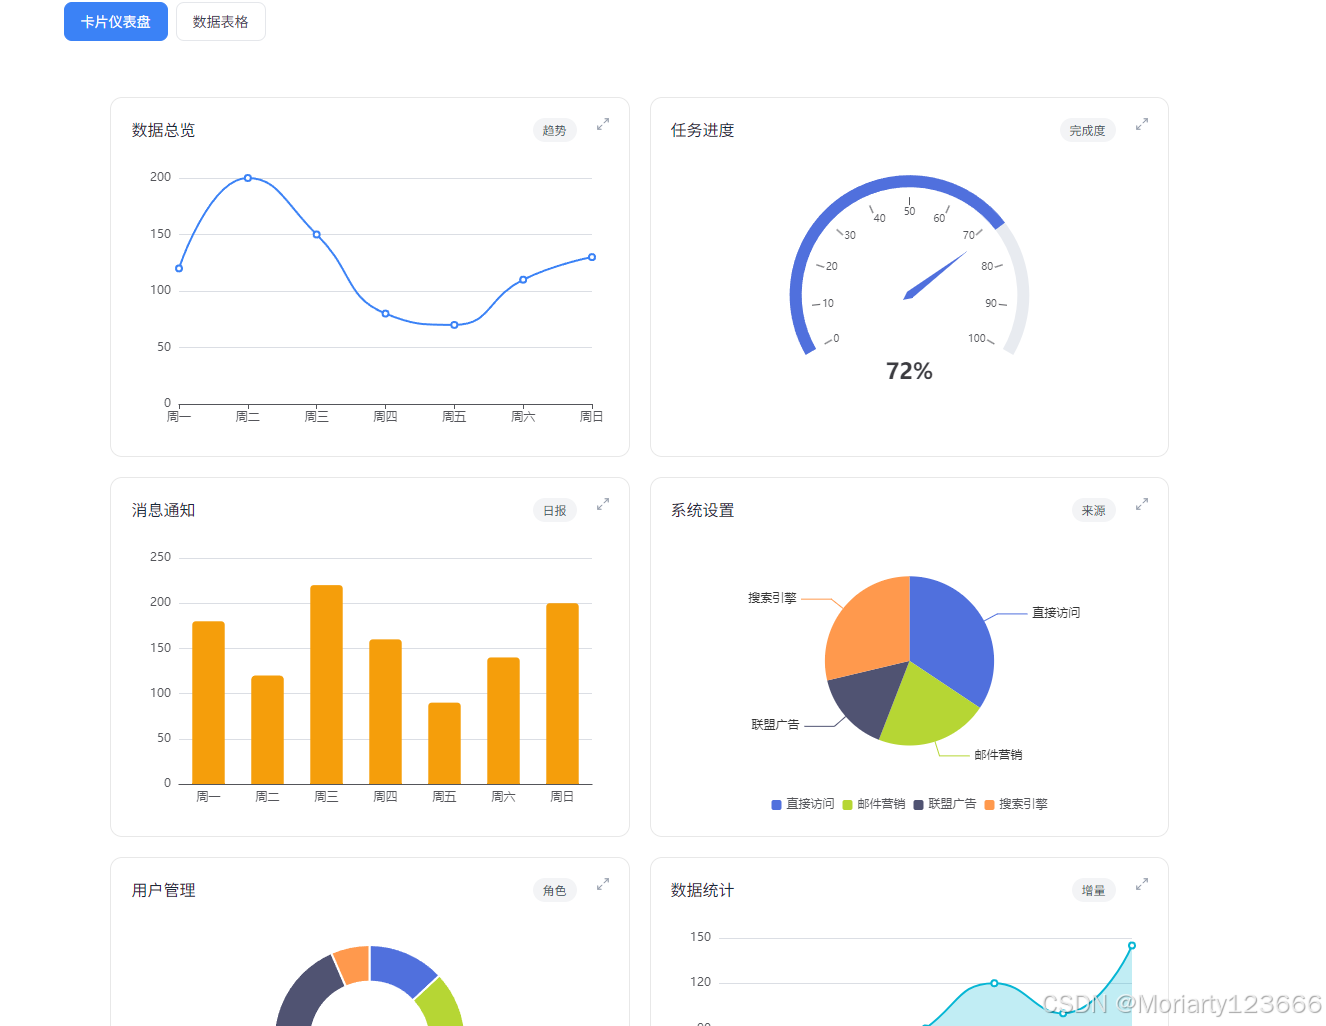
一个 Vue 3 + Vite 的图表卡片页:8 张卡片两列排布,每张内嵌一个 ECharts 图表,点右上角按钮可让卡片在容器内铺满 / 还原。样式使用 Tailwind CSS v4 工具类,无组件内 <style scoped>。
完整源码见第九节。
实现效果
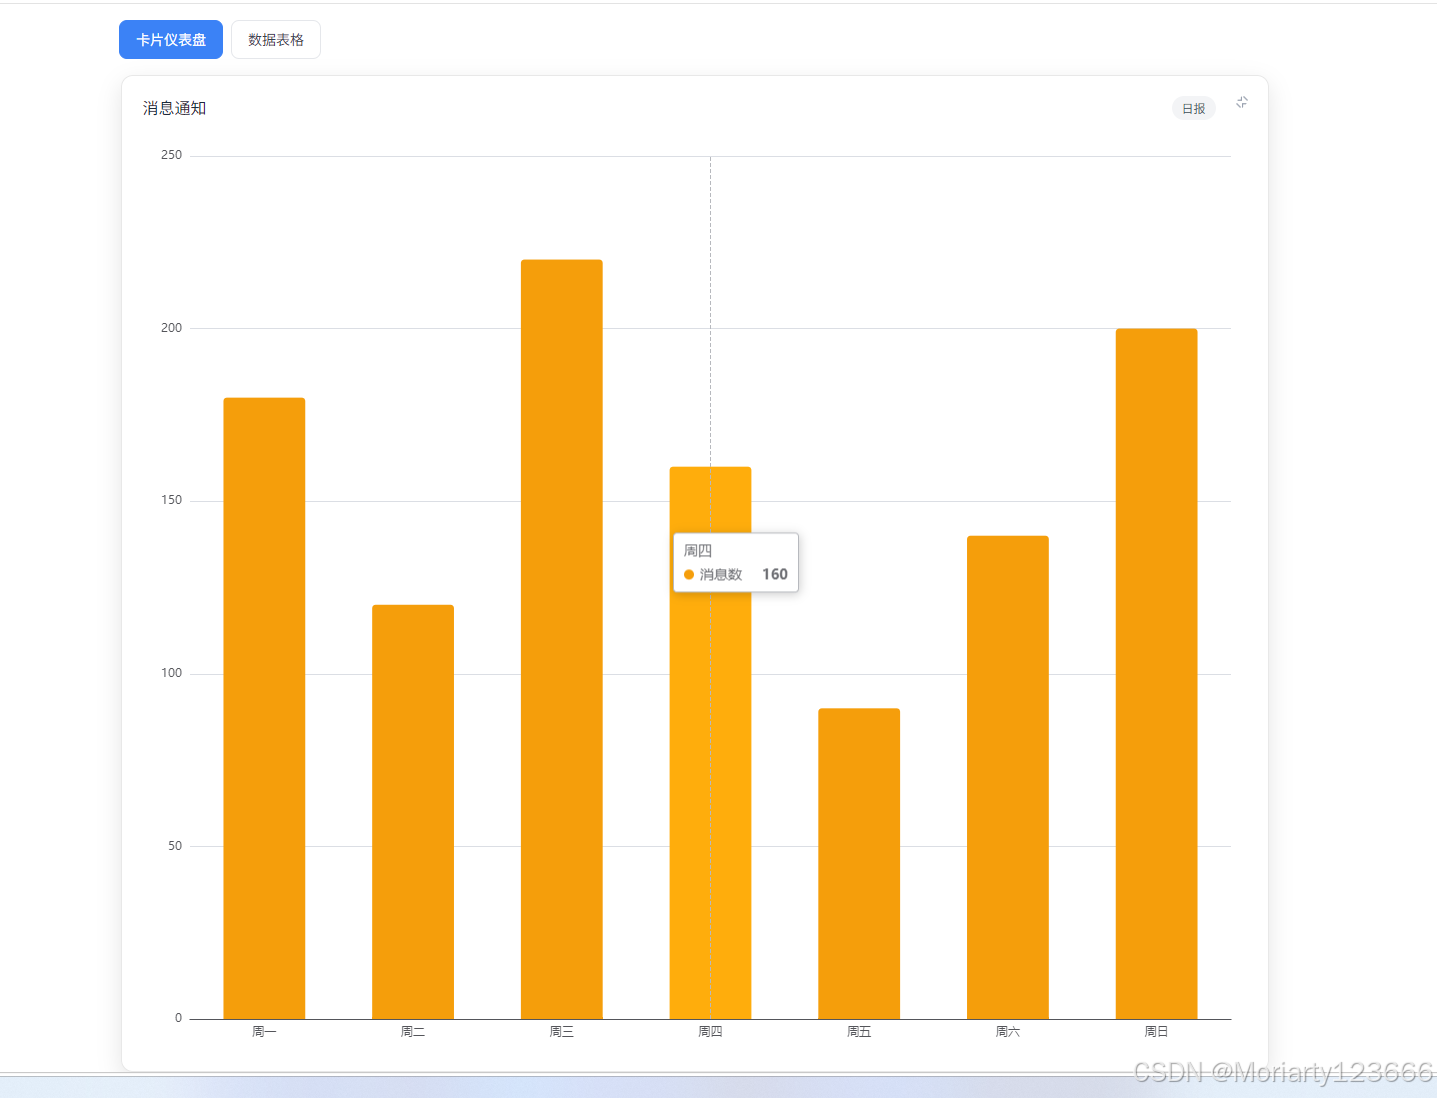
展开效果:
一、文件结构
| 文件 | 职责 |
|---|---|
src/App.vue |
页面外壳:顶部导航在「卡片仪表盘」与「数据表格」间切换,仅保留导航与全局 body { margin:0 } 样式 |
src/components/CardDashboard.vue |
卡片仪表盘:卡片数据、行容器 + 卡片结构、Tailwind 工具类、展开状态消费 |
src/components/EChart.vue |
ECharts 通用封装:按需注册、初始化、尺寸自适应、销毁 |
src/chart-options.js |
8 套 ECharts option,按 key 取用 |
src/composables/useExpandable.js |
展开 / 折叠的状态逻辑(可复用) |
src/style.css |
@import "tailwindcss";,在 main.js 引入,由 vite.config.js 的 @tailwindcss/vite 插件编译 |
src/main.js |
应用入口,引入 style.css 后再挂载 App |
数据流:
cards[].chart  →  chartOptions[key]  →  <EChart :option="..." />
                                              ↓
                                   useExpandable() 控制铺满 / 还原
二、布局:卡片宽 50%、自动换行
布局用「单个 flex 换行容器」承载所有卡片,每张卡片固定 50% 宽度、自动排成两列,数量增减时自然换行,不再按固定行数切分。对应 Tailwind 工具类:
html
<!-- 单个换行容器:flex-wrap 自动换行,行/列间距均 20px -->
<div class="relative flex flex-wrap gap-5">      <!-- gap-5 = 20px -->

  <!-- 卡片:宽 50%(减去半格 gap)自动两列;min-height 360px -->
<article class="min-h-[360px] w-[calc(50%-0.625rem)] flex flex-col p-5 ...">- 数据直接
v-for="card in cards"渲染,不再用cardRows预切成「每行两张」的二维数组;卡片增删时由flex-wrap自动重排。 - 每张卡片
w-[calc(50%-0.625rem)]:容器gap-5为 20px,半格 10px =0.625rem,两卡宽度 + 一个 gap =(50% - 10px) × 2 + 20px = 100%,恰好两列铺满,超出即换行。 min-height: 360px(不是height),内容多时可继续被顶高,不会截断。- 8 张卡片 = 4 行 ≈ 1500px,加页面上下各 40px 内边距 ≈ 1580px,超出视口后页面自然出现纵向滚动条。
- 窄屏回退单列:给容器加
max-[640px]:flex-col,或把卡片宽度改为max-[640px]:w-full即可,按需启用。
卡片头部
卡片头部只有标题(text-base text-gray-800)和标签(px-2.5 py-1 rounded-full bg-gray-100 text-xs text-gray-600 whitespace-nowrap),没有描述区,8 张卡片头部高度一致。
三、展开 / 折叠:容器内铺满(非浏览器全屏)
没有使用 requestFullscreen() 等浏览器全屏 API,纯 CSS 实现(Tailwind 的 absolute inset-0 z-[2])。
关键点:
- 卡片容器必须
relative(Tailwindrelative),否则绝对定位会向上找到body,变成铺满整页。 - 展开卡片是容器内的一张
<article>,其包含块是最近的定位祖先------即带relative的 flex 换行容器,所以inset-0正好等于铺满整个容器。同时卡片position: absolute脱离 flex 行流,不再占行内格子(配合下面的「其余卡片hidden」一起生效)。 - 50% 宽度只对非展开态生效 :
w-[calc(50%-0.625rem)]仅在!isExpanded分支里;展开态不设这个宽度,inset-0(left:0 + right:0)便会撑满容器 100% 宽,不会被 50% 宽度覆盖。 - 状态用「当前展开的卡片 id」而不是布尔值,天然保证同时只展开一张(见
useExpandable)。
展开态的卡片类(Tailwind):
html
<article
  :class="{
    'relative w-[calc(50%-0.625rem)] hover:-translate-y-1 hover:shadow-[0_8px_20px_rgba(0,0,0,0.08)]': !isExpanded(card.id),
    'absolute inset-0 z-[2] shadow-[0_8px_24px_rgba(0,0,0,0.1)] hover:transform-none': isExpanded(card.id),
    'hidden': isAnyExpanded && !isExpanded(card.id),
  }">
展开后占满整个容器 :默认页面是 max-w-[1200px] 居中、带 p-10(40px 24px)内边距;一旦有卡片展开,页面加上 max-w-none p-0,解除宽度限制与内边距,绝对定位的展开卡片 inset-0 便直接铺满整个内容区(到边)。
四、展开态不出现滚动条
四处配合,缺一不可(现为 Tailwind 工具类 + App.vue 全局 body { margin:0 }):
html
<!-- 1. 页面:至少一屏高的纵向 flex -->
<div class="flex-1 min-h-0 flex flex-col max-w-[1200px] w-[60%] mx-auto"
     :class="{ 'p-10': !isAnyExpanded, 'max-w-none p-0': isAnyExpanded }">

<!-- 2. 展开时容器吃掉整屏剩余高度 -->
<div class="relative flex flex-wrap gap-5" :class="{ 'flex-1 min-h-0': isAnyExpanded }">

<!-- 3. 其余卡片不参与高度计算 -->
<!-- 'hidden': isAnyExpanded && !isExpanded(card.id)  加在非展开卡片上 -->

<!-- 4. 全局:清掉 body 默认 8px 外边距(App.vue 内不带 scoped 的 <style> 块) -->
<!-- body { margin: 0; } -->- 第 3 条是核心:其余卡片即便被遮住,只要在文档流里,容器高度仍是 ~1500px,展开卡片会被拉成一整屏列表那么高。
- 第 2 条用
flex-1而不是height: calc(100vh - 80px),避免把内边距数值写死两处。 - 第 4 条不能省:body 默认上下各 8px,总高会变成
100vh + 16px,刚好又冒出滚动条。因为要作用于全局,App.vue里用了第二个不带scoped的<style>块。
结果:文档总高正好 100vh,展开态无滚动条;收起后内容 ~1580px,滚动条回来。
五、ECharts 集成
按需注册
js
import * as echarts from 'echarts/core'
import { LineChart, BarChart, PieChart, RadarChart, ScatterChart, GaugeChart } from 'echarts/charts'
import { GridComponent, TooltipComponent, LegendComponent, RadarComponent } from 'echarts/components'
import { CanvasRenderer } from 'echarts/renderers'

echarts.use([/* ... */])
全量 import * as echarts from 'echarts' 会让产物从 63KB 涨到 1184KB(gzip 397KB);按需注册后为 645KB(gzip 221KB)。新增图表类型时记得同步 echarts.use() 的注册列表。
生命周期
js
onMounted(() => {
  chart = echarts.init(el.value)
  chart.setOption(props.option)

  // 观察父容器(.card-chart)的尺寸变化:窗口缩放、卡片展开/收起都会改变它,尺寸一变就 resize
  observer = new ResizeObserver(() => {
    chart && chart.resize()
  })
  observer.observe(el.value.parentElement)
})

// 展开/收起切换:DOM 更新后强制 resize,确保图表重新读取容器尺寸并铺满
watch(
  () => props.expanded,
  async () => {
    await nextTick()
    chart && chart.resize()
  }
)

onBeforeUnmount(() => {
  observer.disconnect()   // 先停监听,避免销毁后仍回调 resize
  chart.dispose()
})
图表随容器尺寸自适应:
- 父容器尺寸变化(窗口缩放、卡片展开 / 收起)时,通过
ResizeObserver触发chart.resize()。 - 卡片展开态切换后,
watch(expanded)在 DOM 更新后强制chart.resize()。 .echart用width/height: 100%始终等于父容器大小。option整体替换时也会setOption(option, true)重绘(换数据源用)。
使用约定
<EChart> 的根节点是 position: absolute; inset: 0,因此父容器必须 position: relative 且高度由 CSS 确定(固定值或 flex 分配均可)。
六、图表区结构
<EChart> 根节点为 position: absolute; inset: 0,因此卡片图表区必须 position: relative 且高度由 CSS 确定(固定值或 flex 分配)。在 Tailwind 下写作:
html
<div class="relative flex-1 min-h-0 overflow-hidden">
  <EChart :option="chartOptions[card.chart]" :expanded="isExpanded(card.id)" />
</div>
这种「父 relative + 子 absolute」结构让图表尺寸单向跟随卡片:卡片高度决定图表区的高度,图表再跟随它,图表不会反向把卡片撑高。flex-1 min-h-0 overflow-hidden 在 flex 布局中吃掉卡片剩余高度、可收缩并裁掉溢出(收起瞬间画布还没缩回时先裁掉,避免溢出压到下面的卡片)。
七、状态逻辑复用
src/composables/useExpandable.js:
js
export function useExpandable() {
  const expandedId = ref(null)
  const isAnyExpanded = computed(() => expandedId.value !== null)
  const isExpanded = (id) => expandedId.value === id
  function toggle(id) {
    expandedId.value = expandedId.value === id ? null : id
  }
  return { expandedId, isAnyExpanded, isExpanded, toggle }
}
在新页面复用的三步:
const { isAnyExpanded, isExpanded, toggle } = useExpandable()- 页面根节点
:class="{ 'max-w-none p-0': isAnyExpanded }",行容器:class="{ 'flex-1 min-h-0': isAnyExpanded }",卡片:class里绑定relative/absolute inset-0 z-[2]与hidden。 - 这些
:class绑定就是「样式契约」------不再依赖 scoped CSS 里的.is-expanded/.card-expanded选择器。
隐含依赖:行容器展开时 flex-1 要求外层是 min-height: 100vh 的纵向 flex(即 .app)。若新页面结构不同,改用 height: calc(100vh - 页面上下内边距) 效果相同。
八、已知限制与扩展方向
- 展开 / 收起是瞬时的 :
position在relative↔absolute之间切换无法用transition过渡。要做动画有两条路:- View Transitions API(最省事):
document.startViewTransition(async () => { toggle(id); await nextTick() }),配合每张卡片唯一的view-transition-name,十几行搞定,老浏览器自动降级为瞬时切换。 - FLIP:切换前后各测一次
getBoundingClientRect(),用 Web Animations API 补间transform+width/height。要注意此时卡片不能是display: none,否则测量全是 0。
- View Transitions API(最省事):
hidden(原display: none)的影响 :元素不生成布局盒,getBoundingClientRect()全 0,不进无障碍树;但 Vue 组件不销毁、DOM 节点和状态都保留,图片也仍会下载。卡片里若放需要容器尺寸的库(如 ECharts),当前的ResizeObserver方案已能自动恢复。- 行内始终等高 :同一行是 flex,默认
align-items: stretch,两张卡等高取较高者;较矮那张的图表区(flex-1)自动撑大吸收差值,图表经ResizeObserver重绘不变形,min-height: 360px兜底下限。构建无报错、图表不拉伸、行内始终对齐。唯一限制是「行内等高、行与行可不等高」------若要求 8 张全部严格齐平,需把行高锁死(固定行高 +overflow处理超长内容)。 - 产物体积 :Vite 会提示 chunk > 500KB,是因为同时用到了 6 种图表类型。继续瘦身可删掉
echarts.use()中没用到的类型。 defineProps是编译宏 :只在<script setup>中由编译器注入,普通<script>块里不可用,也不能从'vue'导入。普通<script>里要声明 props,请改用export default { props: {...}, setup(props) {...} }。
九、完整源码
src/App.vue
vue
<script setup>
import { ref } from 'vue'
import CardDashboard from './components/CardDashboard.vue'
import DataTable from './components/DataTable.vue'

// 当前视图:'cards' 卡片仪表盘 / 'table' 数据表格
const view = ref('cards')
</script>

<template>
  <div class="app">
    <nav class="top-nav">
      <button type="button" :class="{ active: view === 'cards' }" @click="view = 'cards'">卡片仪表盘</button>
      <button type="button" :class="{ active: view === 'table' }" @click="view = 'table'">数据表格</button>
    </nav>

    <CardDashboard v-if="view === 'cards'" />
    <DataTable v-else />
  </div>
</template>

<style scoped>
.app {
  display: flex;
  flex-direction: column;
  min-height: 100vh;
}

/* 顶部导航:在卡片仪表盘与数据表格之间切换 */
.top-nav {
  display: flex;
  gap: 8px;
  max-width: 1200px;
  width: 100%;
  margin: 0 auto;
  padding: 16px 24px;
  box-sizing: border-box;
}

.top-nav button {
  padding: 8px 16px;
  border: 1px solid #e5e7eb;
  border-radius: 8px;
  background: #fff;
  color: #374151;
  font-size: 14px;
  cursor: pointer;
  transition: all 0.15s ease;
}

.top-nav button:hover {
  border-color: #3b82f6;
  color: #3b82f6;
}

.top-nav button.active {
  background: #3b82f6;
  border-color: #3b82f6;
  color: #fff;
}
</style>

<!-- 全局:去掉 body 默认外边距,否则展开态会多出 16px 撑出滚动条 -->
<style>
body {
  margin: 0;
}
</style>
src/components/CardDashboard.vue
vue
<script setup>
import EChart from './EChart.vue'
import { chartOptions } from '../chart-options.js'
import { useExpandable } from '../composables/useExpandable.js'

// 卡片数据:chart 字段指定用哪套 ECharts 配置,见 chart-options.js
const cards = [
  { id: 1, title: '数据总览', tag: '趋势', chart: 'line' },
  { id: 2, title: '任务进度', tag: '完成度', chart: 'gauge' },
  { id: 3, title: '消息通知', tag: '日报', chart: 'bar' },
  { id: 4, title: '系统设置', tag: '来源', chart: 'pie' },
  { id: 5, title: '用户管理', tag: '角色', chart: 'ring' },
  { id: 6, title: '数据统计', tag: '增量', chart: 'area' },
  { id: 7, title: '日志审计', tag: '评分', chart: 'radar' },
  { id: 8, title: '帮助中心', tag: '分布', chart: 'scatter' },
]

// 展开/折叠状态
const { isAnyExpanded, isExpanded, toggle } = useExpandable()
</script>

<template>
  <div class="flex-1 min-h-0 flex flex-col max-w-[1200px] w-[60%] mx-auto"
    :class="{ 'p-10': !isAnyExpanded, 'max-w-none p-0': isAnyExpanded }">
    <div class="relative flex flex-wrap gap-5" :class="{ 'flex-1 min-h-0': isAnyExpanded }">
      <article v-for="card in cards" :key="card.id"
        class="min-h-[360px] flex flex-col p-5 bg-white border border-[#e8e8e8] rounded-xl transition duration-150"
        :class="{
          'relative w-[calc(50%-0.625rem)] hover:-translate-y-1 hover:shadow-[0_8px_20px_rgba(0,0,0,0.08)]': !isExpanded(card.id),
          'absolute inset-0 z-[2] shadow-[0_8px_24px_rgba(0,0,0,0.1)] hover:transform-none': isExpanded(card.id),
          'hidden': isAnyExpanded && !isExpanded(card.id),
        }">
          <button class="absolute top-3 right-3 flex items-center justify-center w-7 h-7 p-0 border-0 rounded-md bg-transparent text-gray-400 cursor-pointer transition-colors hover:bg-gray-100 hover:text-gray-700"
            type="button" :aria-label="isExpanded(card.id) ? '收起' : '展开'"
            :title="isExpanded(card.id) ? '收起' : '展开'" @click="toggle(card.id)">
            <svg viewBox="0 0 24 24" width="14" height="14" aria-hidden="true">
              <path v-if="isExpanded(card.id)" d="M5 9h6V3M19 15h-6v6M15 3l6 6M9 21l-6-6" fill="none"
                stroke="currentColor" stroke-width="2" stroke-linecap="round" />
              <path v-else d="M15 3h6v6M9 21H3v-6M21 3l-7 7M3 21l7-7" fill="none" stroke="currentColor" stroke-width="2"
                stroke-linecap="round" />
            </svg>
          </button>
          <header class="flex items-center justify-between gap-2 mb-3 pr-8">
            <h3 class="m-0 text-base text-gray-800">{{ card.title }}</h3>
            <span class="px-2.5 py-1 rounded-full bg-gray-100 text-xs text-gray-600 whitespace-nowrap">{{ card.tag }}</span>
          </header>
          <div class="relative flex-1 min-h-0 overflow-hidden">
            <EChart :option="chartOptions[card.chart]" :expanded="isExpanded(card.id)" />
          </div>
        </article>
    </div>
  </div>
</template>
src/style.css
css
@import "tailwindcss";src/main.js
js
import { createApp } from 'vue'
import './style.css'
import App from './App.vue'

createApp(App).mount('#app')
src/vite.config.js
js
import { defineConfig } from 'vite'
import vue from '@vitejs/plugin-vue'
import tailwindcss from '@tailwindcss/vite'

// https://vite.dev/config/
export default defineConfig({
  plugins: [vue(), tailwindcss()],
})
src/components/EChart.vue
vue
<script setup>
import { ref, watch, nextTick, onMounted, onBeforeUnmount } from 'vue'
import * as echarts from 'echarts/core'
import {
  LineChart,
  BarChart,
  PieChart,
  RadarChart,
  ScatterChart,
  GaugeChart,
} from 'echarts/charts'
import {
  GridComponent,
  TooltipComponent,
  LegendComponent,
  RadarComponent,
} from 'echarts/components'
import { CanvasRenderer } from 'echarts/renderers'

// 按需注册:只打包用到的图表和组件(全量引入会让产物增加约 900KB)
echarts.use([
  LineChart,
  BarChart,
  PieChart,
  RadarChart,
  ScatterChart,
  GaugeChart,
  GridComponent,
  TooltipComponent,
  LegendComponent,
  RadarComponent,
  CanvasRenderer,
])

const props = defineProps({
  // 标准 ECharts option
  option: { type: Object, required: true },
  // 卡片是否处于展开态:用于展开/收起后强制重绘,保证图表铺满
  expanded: { type: Boolean, default: false },
})

const el = ref(null)
let chart = null
let observer = null

onMounted(() => {
  chart = echarts.init(el.value)
  chart.setOption(props.option)

  // 观察父容器(.card-chart)的尺寸变化:窗口缩放、卡片展开/收起都会改变它,尺寸一变就 resize
  observer = new ResizeObserver(() => {
    chart && chart.resize()
  })
  observer.observe(el.value.parentElement)
})

// 展开/收起切换:DOM 更新后强制 resize,确保图表重新读取容器尺寸并铺满
watch(
  () => props.expanded,
  async () => {
    await nextTick()
    chart && chart.resize()
  }
)

// option 整体替换时重绘(换数据源用)
watch(
  () => props.option,
  (option) => chart && chart.setOption(option, true)
)

onBeforeUnmount(() => {
  // 先停监听再销毁实例,避免销毁后仍回调 resize
  if (observer) {
    observer.disconnect()
    observer = null
  }
  if (chart) {
    chart.dispose()
    chart = null
  }
})
</script>

<template>
  <div ref="el" class="echart"></div>
</template>

<style scoped>
/*
 * 绝对定位使图表尺寸单向跟随父容器:父容器高度确定后,图表填充其中,
 * 不会反向把卡片撑高。因此要求父容器 position: relative 且高度由 CSS
 * (固定值或 flex)确定。
 */
.echart {
  position: absolute;
  inset: 0;
  /* 始终等于父容器 100%,跟随卡片伸缩 */
  width: 100% !important;
  height: 100% !important;
}
</style>
src/chart-options.js
js
const days = ['周一', '周二', '周三', '周四', '周五', '周六', '周日']

// 用函数返回,避免多个图表共用同一个配置对象
const grid = () => ({ left: 48, right: 16, top: 24, bottom: 32 })

// 卡片 chart 字段 → 对应的 ECharts option
export const chartOptions = {
  line: {
    tooltip: { trigger: 'axis' },
    grid: grid(),
    xAxis: { type: 'category', data: days, boundaryGap: false },
    yAxis: { type: 'value' },
    series: [
      {
        name: '访问量',
        type: 'line',
        smooth: true,
        data: [120, 200, 150, 80, 70, 110, 130],
        itemStyle: { color: '#3b82f6' },
      },
    ],
  },

  gauge: {
    series: [
      {
        type: 'gauge',
        startAngle: 210,
        endAngle: -30,
        min: 0,
        max: 100,
        radius: '85%',
        progress: { show: true, width: 12 },
        axisLine: { lineStyle: { width: 12 } },
        axisTick: { show: false },
        splitLine: { length: 8, lineStyle: { width: 1 } },
        axisLabel: { distance: 14, fontSize: 10 },
        pointer: { width: 4 },
        detail: {
          valueAnimation: true,
          formatter: '{value}%',
          fontSize: 22,
          offsetCenter: [0, '65%'],
        },
        data: [{ value: 72 }],
      },
    ],
  },

  bar: {
    tooltip: { trigger: 'axis' },
    grid: grid(),
    xAxis: { type: 'category', data: days },
    yAxis: { type: 'value' },
    series: [
      {
        name: '消息数',
        type: 'bar',
        barWidth: '55%',
        data: [180, 120, 220, 160, 90, 140, 200],
        itemStyle: { color: '#f59e0b', borderRadius: [4, 4, 0, 0] },
      },
    ],
  },

  pie: {
    tooltip: { trigger: 'item' },
    legend: { bottom: 0, itemWidth: 10, itemHeight: 10 },
    series: [
      {
        type: 'pie',
        radius: ['0%', '60%'],
        center: ['50%', '45%'],
        data: [
          { name: '直接访问', value: 335 },
          { name: '邮件营销', value: 210 },
          { name: '联盟广告', value: 150 },
          { name: '搜索引擎', value: 280 },
        ],
      },
    ],
  },

  ring: {
    tooltip: { trigger: 'item' },
    legend: { bottom: 0, itemWidth: 10, itemHeight: 10 },
    series: [
      {
        type: 'pie',
        radius: ['42%', '68%'],
        center: ['50%', '45%'],
        label: { show: false },
        itemStyle: { borderColor: '#fff', borderWidth: 2 },
        data: [
          { name: '管理员', value: 12 },
          { name: '编辑', value: 28 },
          { name: '访客', value: 46 },
          { name: '禁用', value: 6 },
        ],
      },
    ],
  },

  area: {
    tooltip: { trigger: 'axis' },
    grid: grid(),
    xAxis: { type: 'category', data: days, boundaryGap: false },
    yAxis: { type: 'value' },
    series: [
      {
        name: '新增',
        type: 'line',
        smooth: true,
        data: [40, 65, 55, 90, 120, 100, 145],
        areaStyle: { opacity: 0.25 },
        lineStyle: { width: 2 },
        itemStyle: { color: '#06b6d4' },
      },
    ],
  },

  radar: {
    tooltip: {},
    radar: {
      radius: '62%',
      indicator: [
        { name: '性能', max: 100 },
        { name: '稳定', max: 100 },
        { name: '安全', max: 100 },
        { name: '易用', max: 100 },
        { name: '扩展', max: 100 },
      ],
    },
    series: [
      {
        type: 'radar',
        data: [
          { name: '当前版本', value: [85, 90, 78, 92, 70] },
          { name: '上个版本', value: [70, 75, 88, 80, 85] },
        ],
      },
    ],
  },

  scatter: {
    tooltip: { trigger: 'item' },
    grid: grid(),
    xAxis: { type: 'value' },
    yAxis: { type: 'value' },
    series: [
      {
        type: 'scatter',
        symbolSize: 12,
        itemStyle: { color: '#ec4899' },
        data: [
          [10, 20],
          [15, 34],
          [22, 28],
          [30, 46],
          [38, 40],
          [45, 60],
          [52, 55],
          [60, 72],
        ],
      },
    ],
  },
}
src/composables/useExpandable.js
js
import { ref, computed } from 'vue'

/**
 * 卡片「展开占满容器」的状态逻辑
 * 注意:这是纯状态,配套样式由各页面自己维护(Tailwind 的 :class 绑定)
 * @returns {{ expandedId: import('vue').Ref<number|string|null>, isAnyExpanded: import('vue').ComputedRef<boolean>, isExpanded: (id: number|string) => boolean, toggle: (id: number|string) => void }}
 */
export function useExpandable() {
  // 存 id 而不是布尔值:天然保证同时只展开一张,切换时上一张自动收起
  const expandedId = ref(null)

  // 是否有卡片处于展开态,用于给容器加类(撑高容器)
  const isAnyExpanded = computed(() => expandedId.value !== null)
  const isExpanded = (id) => expandedId.value === id

  // 再次点击同一张则收起
  function toggle(id) {
    expandedId.value = expandedId.value === id ? null : id
  }

  return { expandedId, isAnyExpanded, isExpanded, toggle }
}
index.html
html
<!doctype html>
<html lang="en">
  <head>
    <meta charset="UTF-8" />
    <link rel="icon" type="image/svg+xml" href="/favicon.svg" />
    <meta name="viewport" content="width=device-width, initial-scale=1.0" />
    <title>vue3-demo</title>
  </head>
  <body>
    <div id="app"></div>
    <script type="module" src="/src/main.js"></script>
  </body>
</html>
package.json
json
{
  "name": "vue3-demo",
  "private": true,
  "version": "0.0.0",
  "type": "module",
  "scripts": {
    "dev": "vite",
    "build": "vite build",
    "preview": "vite preview"
  },
  "dependencies": {
    "echarts": "^6.1.0",
    "vue": "^3.5.40"
  },
  "devDependencies": {
    "@tailwindcss/vite": "^4.3.3",
    "@vitejs/plugin-vue": "^6.0.8",
    "tailwindcss": "^4.3.3",
    "vite": "^8.2.0"
  }
}
附:常用命令
bash
npm install     # 安装依赖
npm run dev     # 开发预览
npm run build   # 生产构建
npm run preview # 预览构建产物