1990-2020年发现行星展示图表
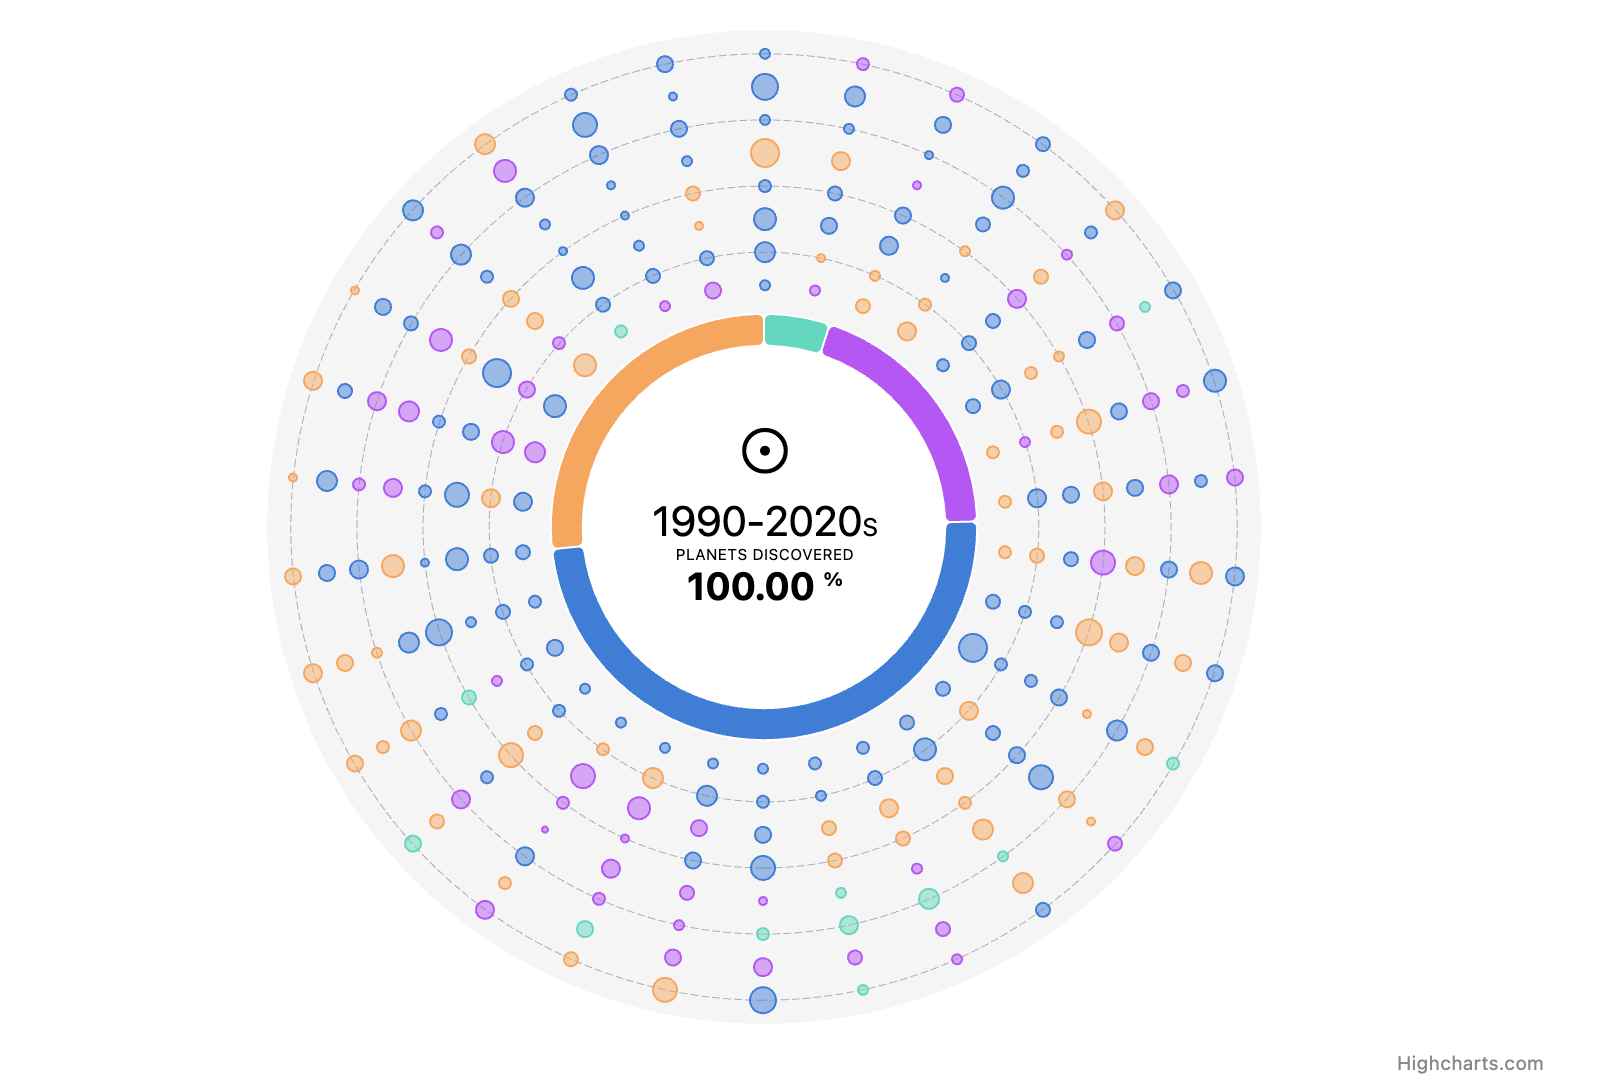
太阳系外离地球最近的240颗行星的恒星图。在这张恒星图中,气泡的大小与行星的质量成正比。气泡到图中心的距离大致与到地球的距离有关。气泡颜色代表每个行星的恒星大小,即从地球上看它在天空中的大小。在中心,你会发现四组行星,按它们被发现的年代分组。
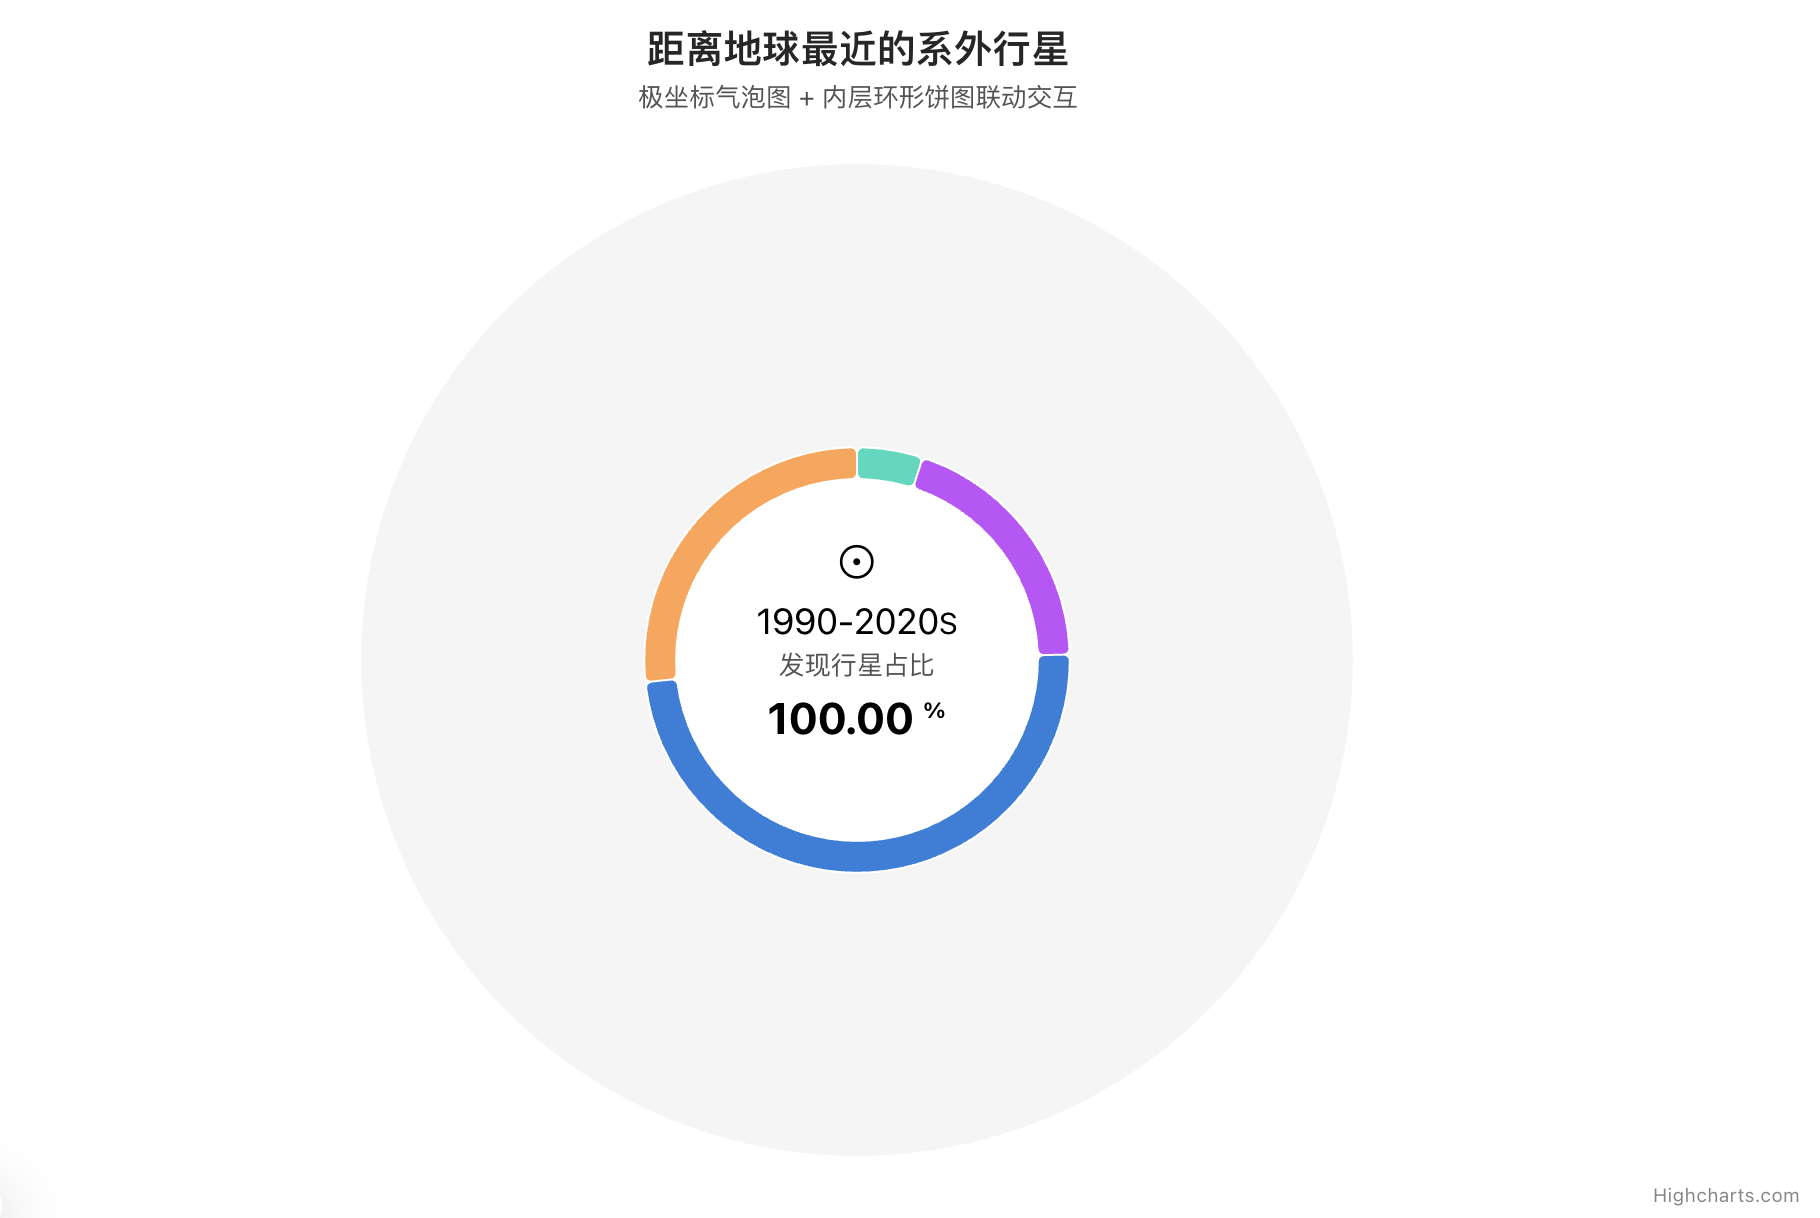
图表功能说明:
外层极坐标气泡:系系系外行星,气泡大小 = 行星质量,径向距离 = 离地球光年,颜色 = 发现年代;
内层环形饼图:按年代统计行星数量,鼠标悬浮饼扇区,外层气泡自动变暗过滤,只保留对应年代行星高亮;中间动态文字,展示选中年代占比。
js
const colors = ['#6CDDCA', '#C771F3', '#4D90DB', '#FAB776'];

Highcharts.chart('container', {
    chart: {
        type: 'bubble',
        polar: true,
        height: 600,
        events: {
            render() {
                const chart = this,
                    pieSeries = chart.series[1];
                pieSeries.customLabel = fillCenter(
                    100,
                    '1990-2020',
                    chart,
                    pieSeries.customLabel
                );
            }
        }
    },
    data: {
        csv: document.getElementById('csv').innerHTML,
        seriesMapping: [{
            name: 0,
            x: 1,
            y: 2,
            z: 3,
            'custom.lightYears': 4,
            'custom.planetMass': 5,
            'custom.stellarMagnitude': 6,
            'custom.discoveryDate': 7
        }]
    },
    title: {
        text: 'The 240 Closest Planets to the Earth other than our solar system'
    },
    subtitle: {
        text: 'Using bubble series in polar coordinate system along with pie ' +
            'series'
    },
    colorAxis: {
        dataClasses: [{
            from: 1990,
            to: 2000,
            color: colors[0]
        }, {
            from: 2000,
            to: 2010,
            color: colors[1]
        }, {
            from: 2010,
            to: 2020,
            color: colors[2]
        }, {
            from: 2020,
            color: colors[3]
        }]
    },
    legend: {
        enabled: false
    },
    pane: {
        innerSize: '42%',
        size: '95%',
        background: [{
            backgroundColor: 'var(--highcharts-neutral-color-3, #f7f7f7)',
            borderWidth: 0
        }, {
            backgroundColor: 'var(--highcharts-background-color, #fff)',
            borderWidth: 0,
            outerRadius: '42%'
        }]
    },
    xAxis: {
        tickInterval: 1,
        min: 0,
        max: 30,
        gridLineWidth: 0,
        labels: {
            enabled: false
        },
        lineWidth: 0
    },
    yAxis: {
        tickInterval: 1,
        labels: {
            enabled: false
        },
        gridLineWidth: 0.5,
        gridLineColor: '#BBBAC5',
        gridLineDashStyle: 'longdash',
        endOnTick: false
    },
    tooltip: {
        borderWidth: 1,
        shadow: false,
        outside: true,
        hideDelay: 20,
        useHTML: true,
        formatter: function (tooltip) {
            // Hide tooltip for pie series
            if (this.series.options.type === 'pie') {
                return false;
            }
            // If not null, use the default formatter
            return tooltip.defaultFormatter.call(this, tooltip);
        }
    },
    plotOptions: {
        series: {
            states: {
                inactive: {
                    enabled: false
                }
            }
        },
        pie: {
            states: {
                hover: {
                    halo: 0
                }
            }
        }
    },
    series: [{
        colorKey: 'custom.discoveryDate',
        maxSize: 14,
        minSize: 3,
        tooltip: {
            pointFormat: `<table>
                <tr>
                    <td style='padding:0'>
                        <span class="smallerLabel">Name:</span>
                        {point.name}
                    </td>
                </tr>
                <tr>
                    <td style='padding:0'>
                        <span class="smallerLabel">Mass:</span>
                        {point.custom.planetMass}
                    </td>
                </tr>
                <tr>
                    <td style='padding:0'>
                        <span class="smallerLabel">Distance:</span>
                        {point.custom.lightYears} Light Years
                    </td>
                </tr>
                <tr>
                    <td style='padding:0'>
                        <span class="smallerLabel">Stellar Magnitude:</span>
                        {point.custom.stellarMagnitude}
                    </td>
                </tr>
            </table>`
        }
    }, {
        type: 'pie',
        dataLabels: {
            enabled: false
        },
        size: '40%',
        innerSize: '85%',
        zIndex: -1,
        point: {
            events: {
                mouseOver() {
                    const {
                            minDate,
                            maxDate
                        } = this.options.custom,
                        point = this,
                        series = this.series,
                        chart = series.chart,
                        bubbleSeries = chart.series[0];

                    bubbleSeries.points.forEach(point => {
                        if (
                            point.options.custom.discoveryDate < minDate ||
                            point.options.custom.discoveryDate >= maxDate
                        ) {
                            point.graphic.attr({
                                opacity: 0.2
                            });
                        }
                    });

                    series.customLabel = fillCenter(
                        point.percentage,
                        point.options.custom.minDate,
                        chart,
                        series.customLabel
                    );
                },
                mouseOut() {
                    const chart = this.series.chart,
                        series = this.series,
                        bubbleSeries = chart.series[0];

                    bubbleSeries.points.forEach(point => {
                        point.graphic.attr({
                            opacity: 1
                        });
                    });
                    series.customLabel = fillCenter(
                        100,
                        '1990-2020',
                        chart,
                        series.customLabel
                    );
                }
            }
        },

        data: [{
            y: 12,
            color: '#6CDDCA',
            custom: {
                minDate: 1990,
                maxDate: 2000
            }
        }, {
            y: 47,
            color: '#C771F3',
            custom: {
                minDate: 2000,
                maxDate: 2010
            }
        }, {
            y: 117,
            color: '#4D90DB',
            custom: {
                minDate: 2010,
                maxDate: 2020
            }
        }, {
            y: 64,
            color: '#FAB776',
            custom: {
                minDate: 2020,
                maxDate: 2030
            }
        }]
    }],
    responsive: {
        rules: [{
            condition: {
                maxWidth: 500
            },
            chartOptions: {
                pane: {
                    innerSize: '47%'
                },
                series: [{
                    maxSize: 8
                }, {
                    size: '45%'
                }]
            }
        }]
    }
});

function fillCenter(percentage, decade, chart, customLabel) {
    const labelText = `<div class="center-label">
        <p class="symbol">☉</p>
        <p class="uppercase">${decade}<small>s</p>
        <p class="label">Planets discovered</p>
        <p class="percentage">
            ${percentage.toFixed(2)}
            <sup style='font-size: 0.5em;'>%</sup>
        </p>
    </div>`;

    if (!customLabel) {
        customLabel = chart.renderer.label(
            labelText, 0, 0, void 0, void 0,
            void 0, true
        ).css({
            color: 'var(--highcharts-neutral-color-100, #000)',
            pointerEvents: 'none'
        }).add();
    } else {
        customLabel.attr({
            text: labelText
        });
    }
    customLabel.attr({
        x: (chart.pane[0].center[0] + chart.plotLeft) -
            customLabel.attr('width') / 2,
        y: (chart.pane[0].center[1] + chart.plotTop) -
            customLabel.attr('height') / 2 - 10
    });
    return customLabel;
}
<js>
一、图表简介
本案例是复合联动可视化 :极坐标气泡图(外层) + 环形饼图(内层),属于Highcharts高阶交互Demo。
- 业务场景:多维数据展示,支持分类筛选联动,适合科研数据、市场多维分析、产品多维度分布可视化。
- 原始业务:系外行星多维数据,包含:行星名称、距离地球光年、行星质量、发现年份、恒星星等。
视觉映射规则
- 极坐标径向长度(y轴):行星距离地球的光年,越靠外圈距离越远;
- 气泡大小
z:行星质量,气泡越大,行星质量越大; - 气泡颜色:按发现年份区间 着色(颜色分段
colorAxis.dataClasses); - 内层环形饼:统计各年代发现行星数量占比;
- 交互核心:鼠标悬浮内层饼扇区 → 外层气泡自动过滤,仅保留该年代行星高亮,其余气泡降低透明度淡化,中间文字动态更新占比;鼠标移出恢复全部。
二、核心配置解析
polar:true开启极坐标,图表从直角坐标系转为圆形画布- bubble气泡系列:
z字段控制气泡半径,colorKey绑定自定义字段custom.discoveryDate实现颜色分段 seriesMapping:CSV字段映射,把csv列映射到point属性,支持自定义custom.*扩展字段- 饼图zIndex=-1:放在底层,作为内环背景筛选控件
chart.render事件:首次渲染中间文字标签fillCenter自定义渲染函数:用chart.renderer.label绘制SVG文本,放置在极坐标圆心,动态更新HTML文本
三、交互逻辑拆解
- 鼠标hover内环饼扇区 → 获取当前年代min/max
- 遍历外层气泡所有点,判断发现年份不在区间,设置opacity=0.2淡化
- 更新圆心文字,展示当前年代行星占比
- mouseOut事件:重置所有气泡透明度,圆心文字恢复默认
可选:替换业务数据改造方案
如果你想把这个图改成国内业务(如企业、项目、客户多维数据),只需要修改CSV部分:
- name:项目名称
- x/y:极坐标角度/径向距离
- z:项目规模
- custom字段:行业、营收、成立年份等多维属性