选中栅格即高亮,行列数值实时呈现,三维查询直观又高效!
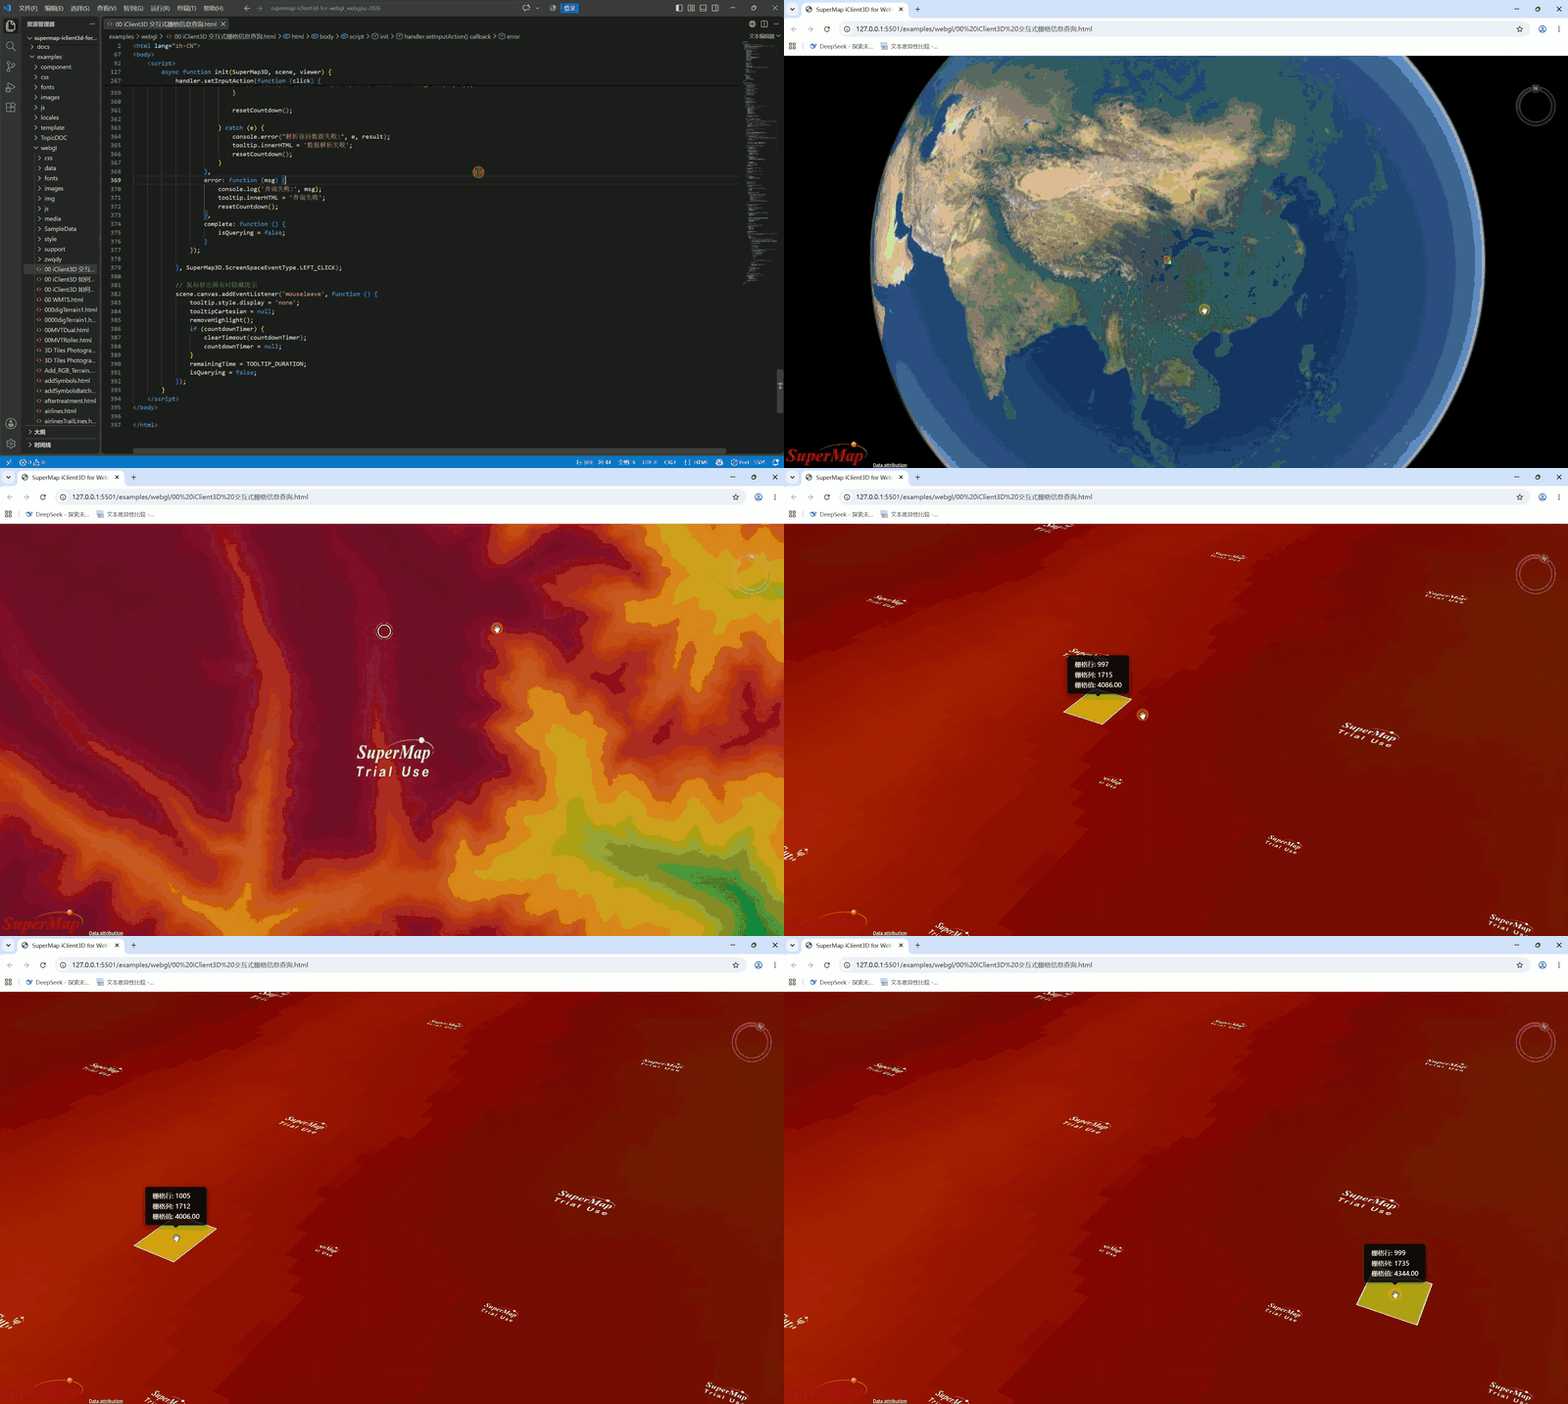
一、实现思路

二、步骤详解
1、数据准备
新建数据源,导入TIF栅格数据,保存地图和工作空间。
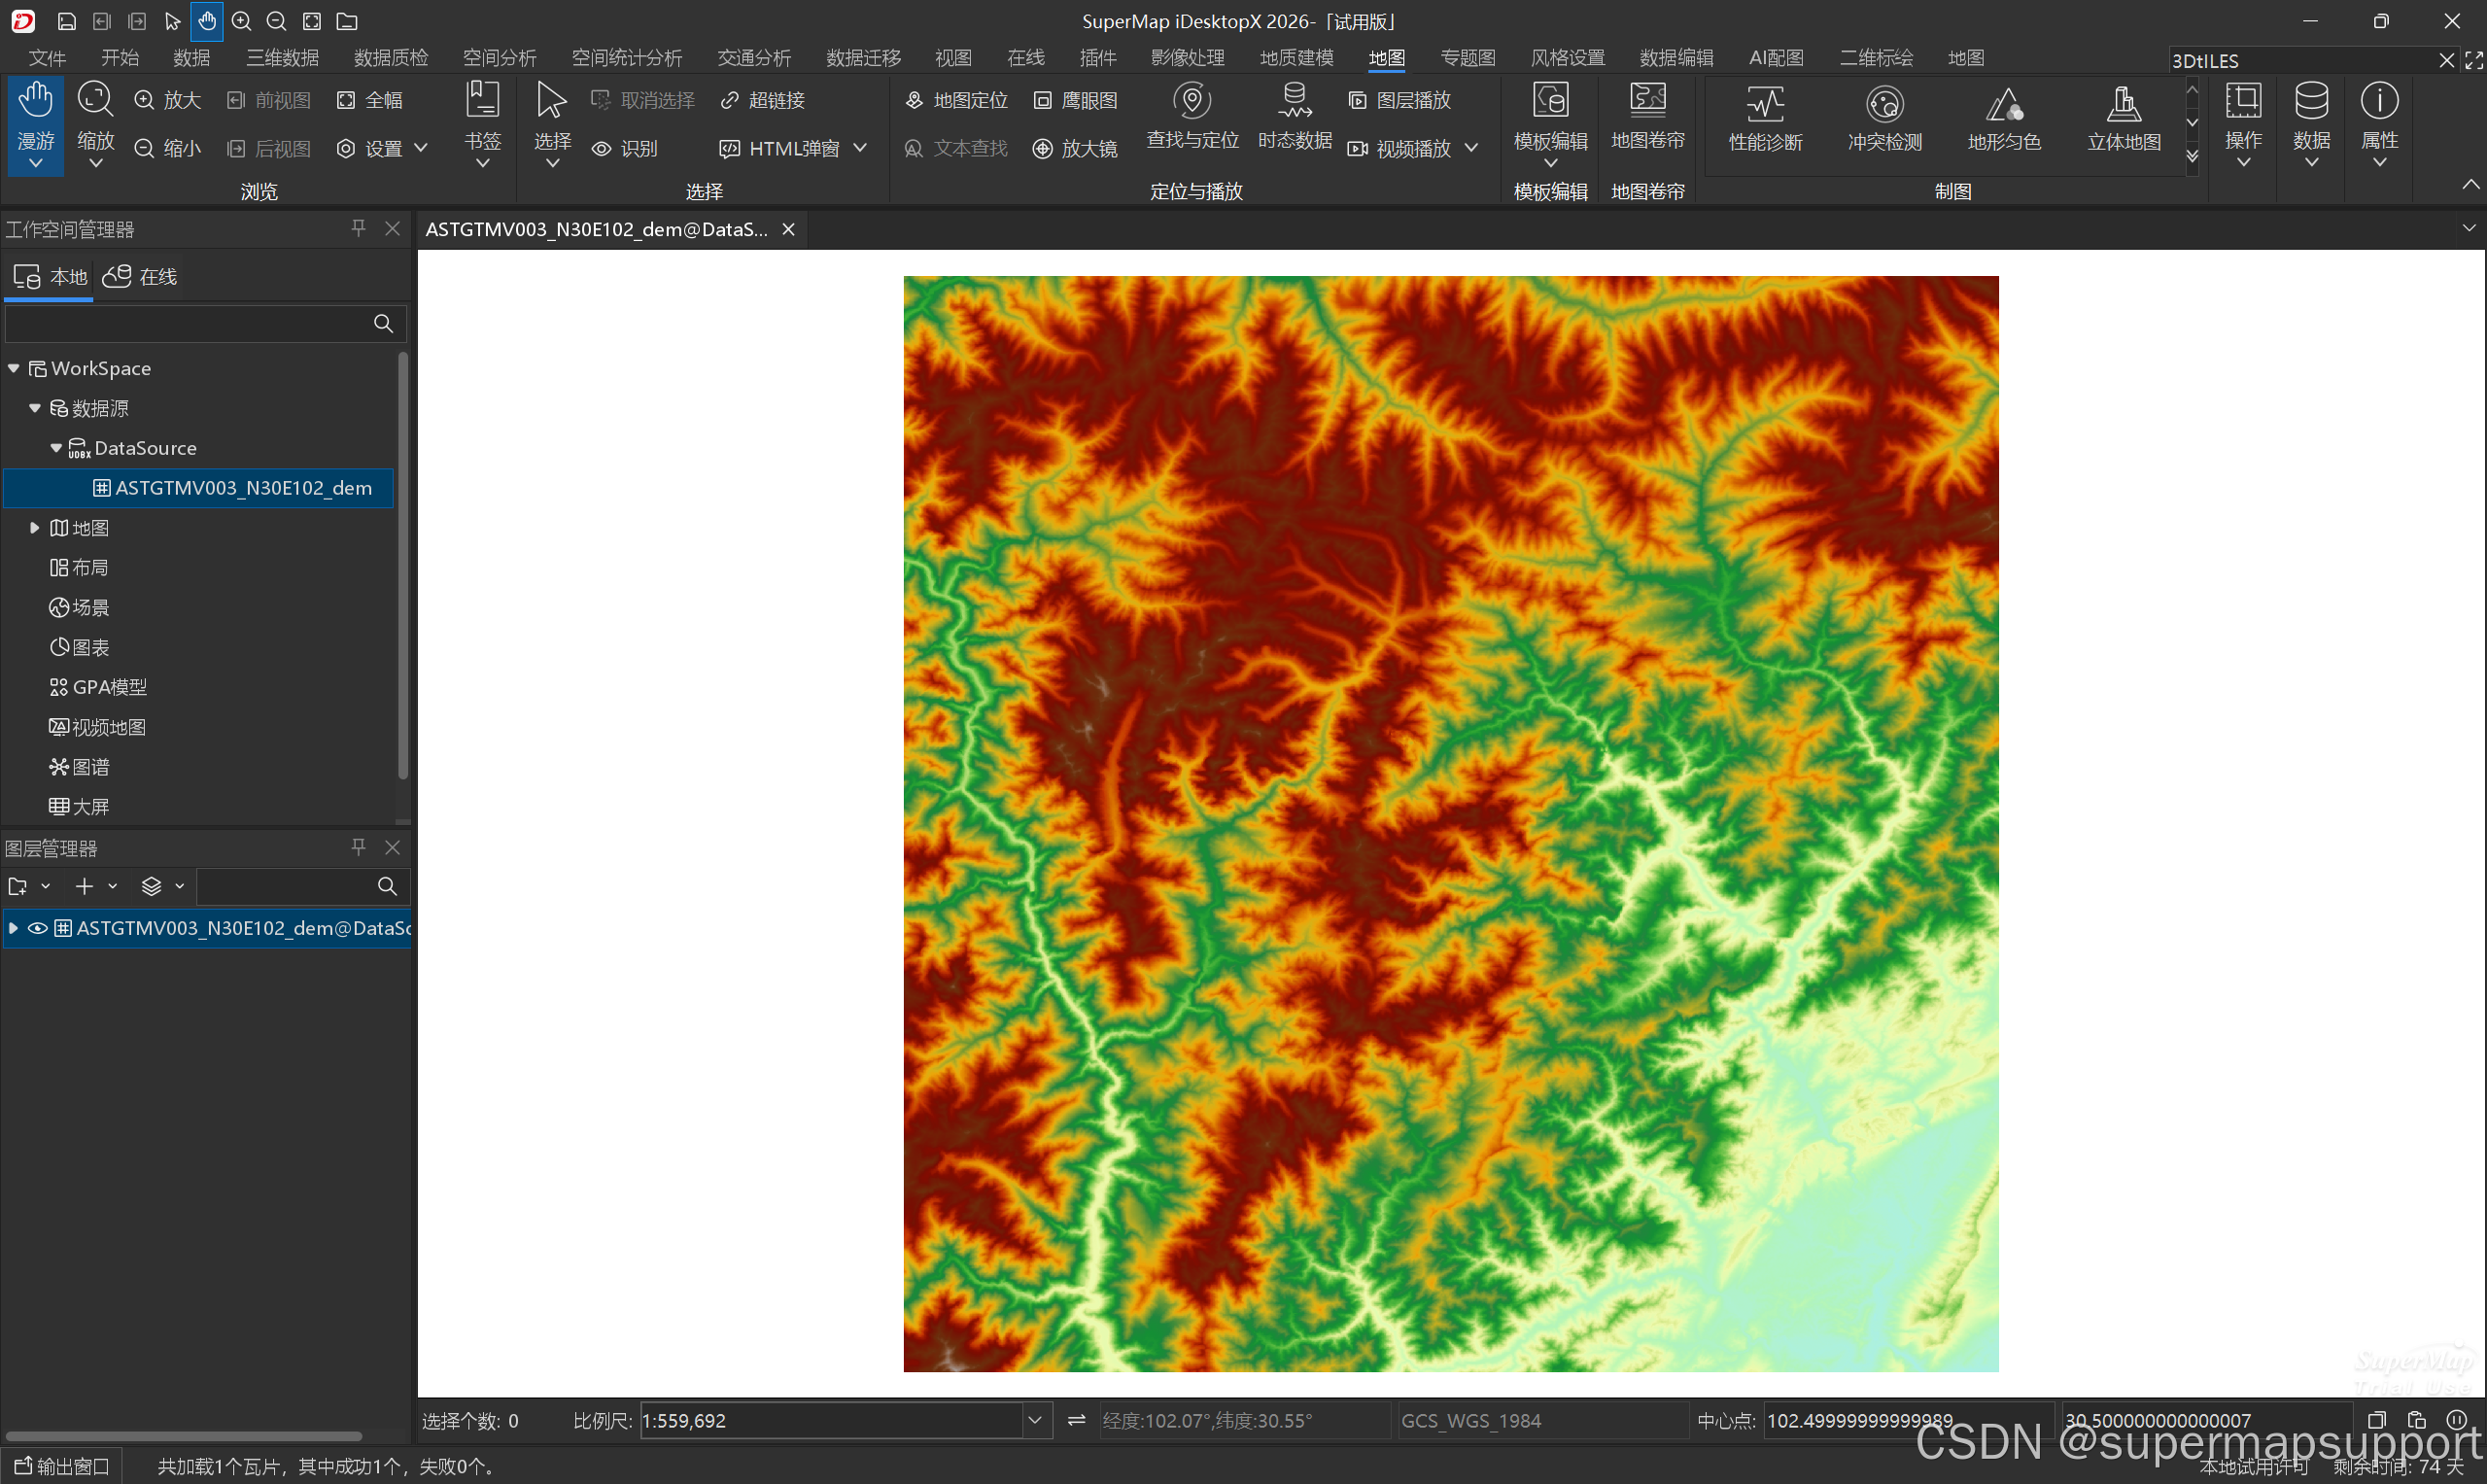
2、服务发布
启动 iServer,把保存好的文件型工作空间发布成地图服务和数据服务。
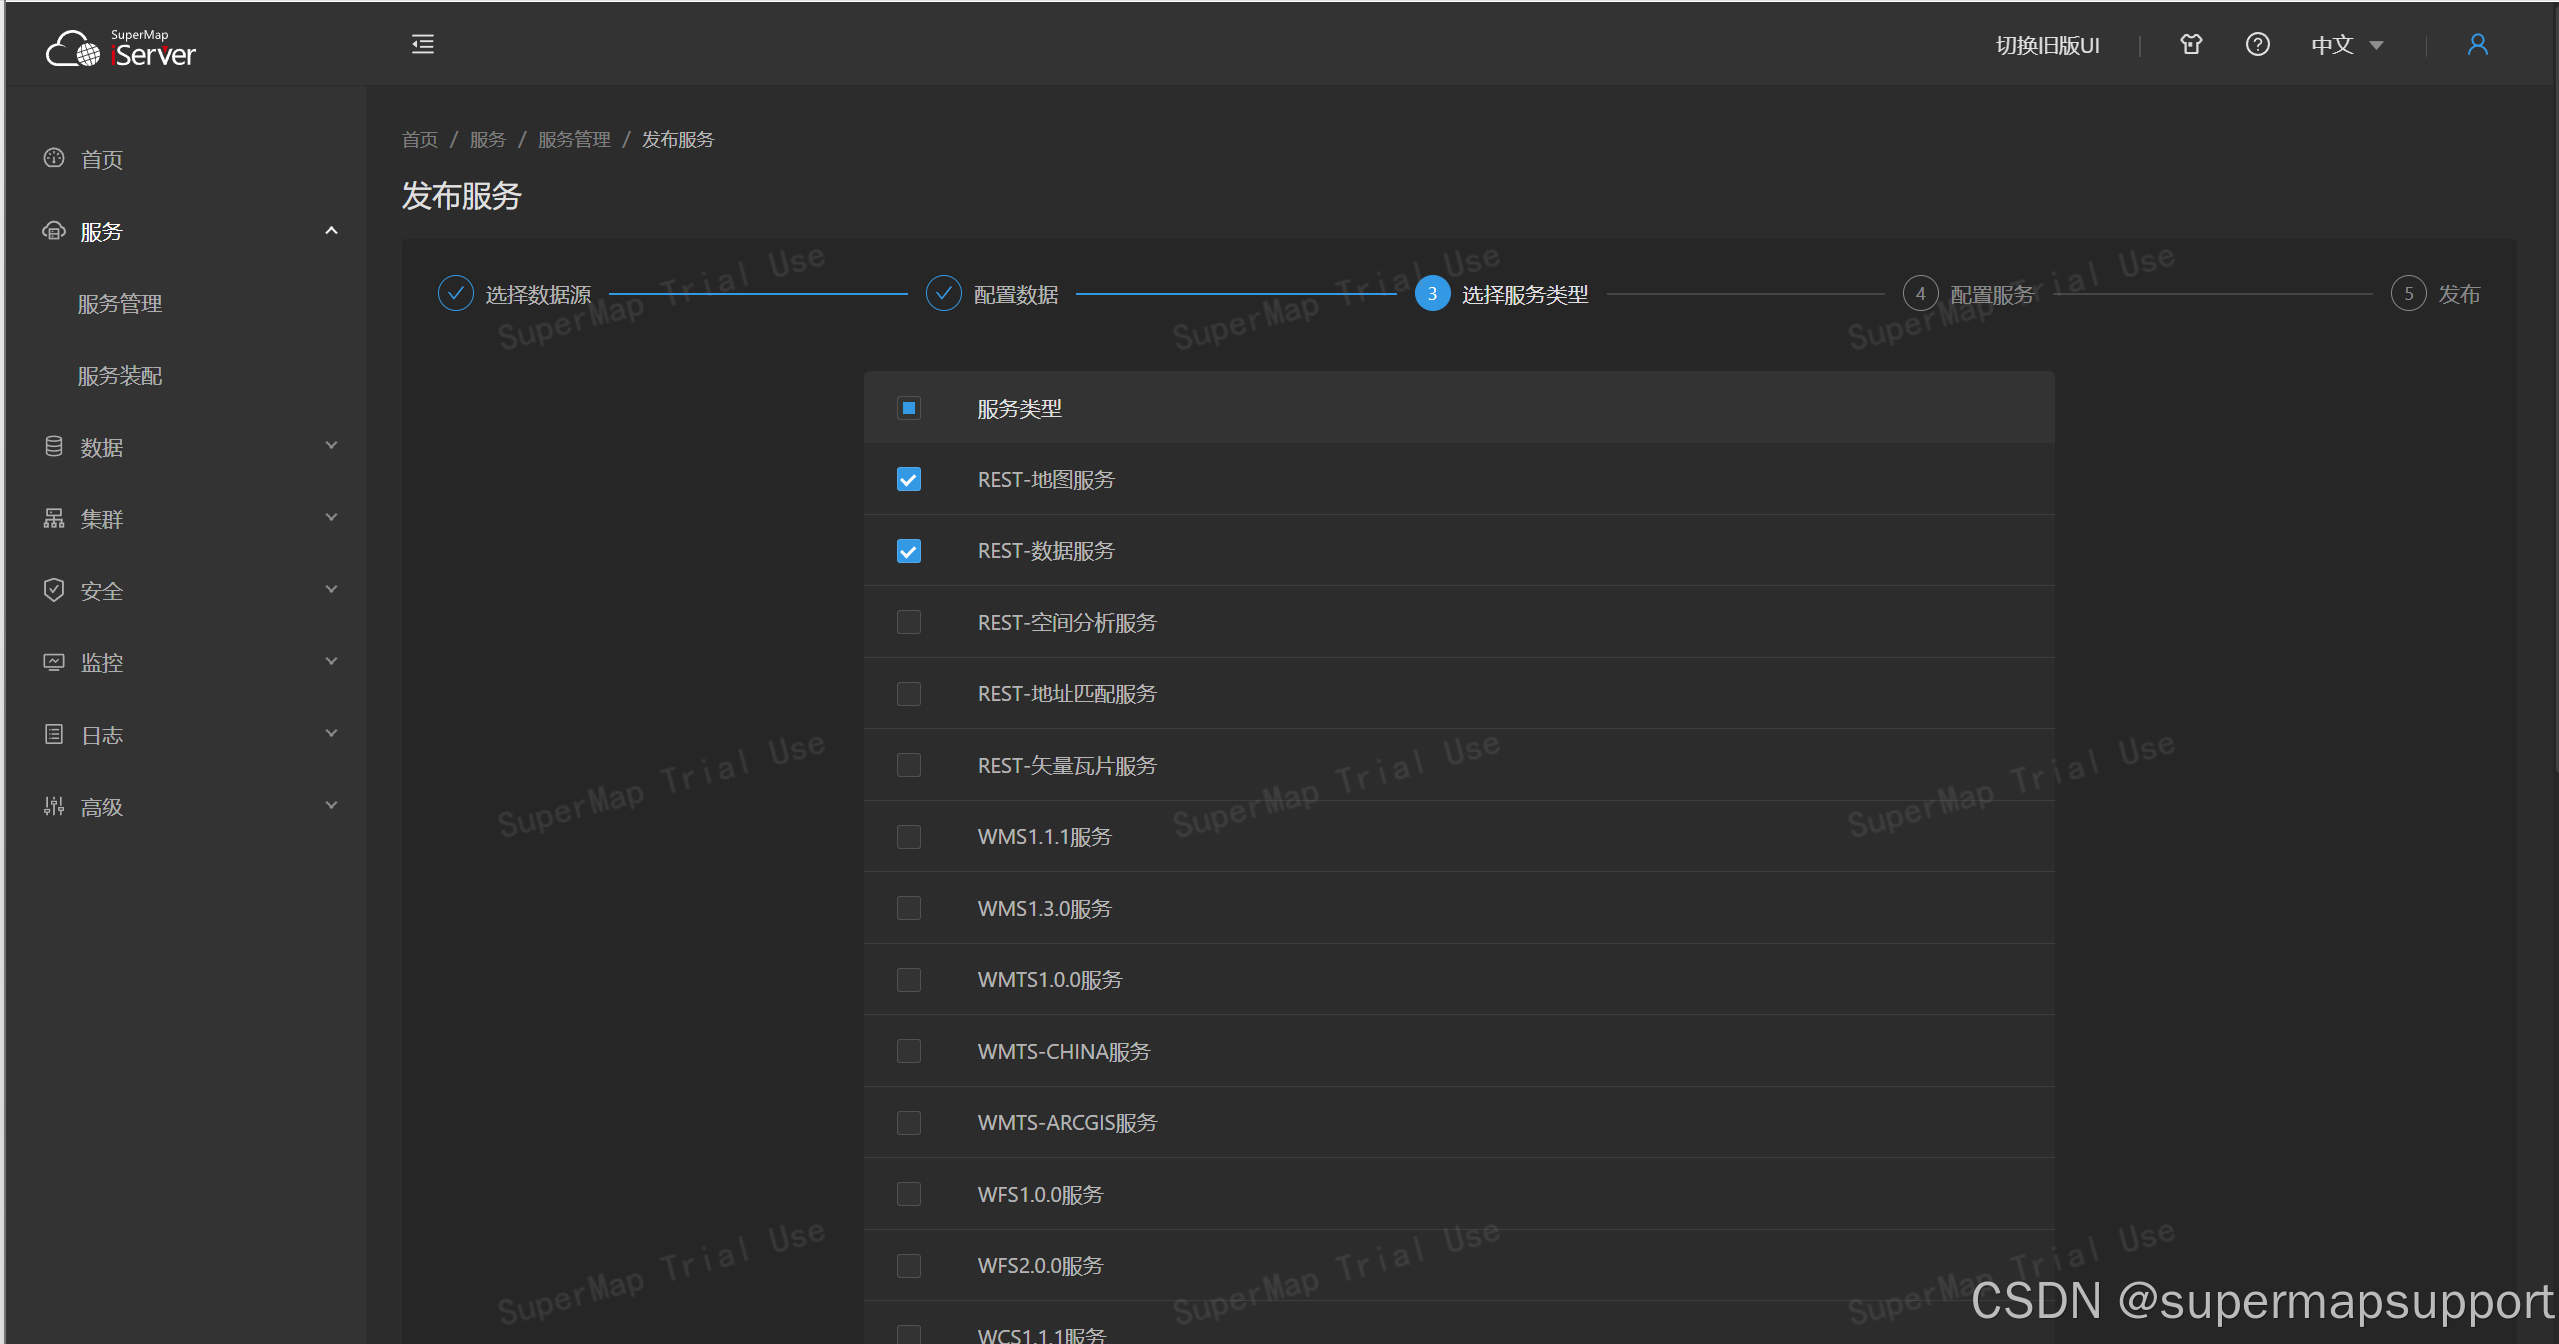
3、场景初始化
javascript
 viewer.resolutionScale = window.devicePixelRatio;

            // ==================== 1. 加载影像图层 ====================
            var mapUrl = "http://localhost:8090/iserver/services/map-WorkSpace/rest/maps/ASTGTMV003_N30E102_dem%40DataSource";

            try {
                var imageryProvider = new SuperMap3D.SuperMapImageryProvider({
                    url: mapUrl
                });
                var imageryLayer = viewer.imageryLayers.addImageryProvider(imageryProvider);
                imageryLayer.alpha = 1.0;
            } catch (e) {
                console.error("地图服务加载失败:", e);
            }

            // ==================== 2. 定位到影像图层 ====================
            viewer.flyTo(imageryLayer);

            $('#loadingbar').remove();
4、交互机制
javascript
   // ==================== 3. 点击查询栅格值 ====================
            const tooltip = document.getElementById('grid-tooltip');
            const handler = new SuperMap3D.ScreenSpaceEventHandler(scene.canvas);

            scene.globe.depthTestAgainstTerrain = true;

            // ==================== 气泡位置实时更新 ====================
            function updateTooltipPosition() {
                if (!tooltipCartesian || tooltip.style.display === 'none') return;

                const screenPos = SuperMap3D.SceneTransforms.wgs84ToWindowCoordinates(scene, tooltipCartesian);

                if (!screenPos) {
                    tooltip.style.display = 'none';
                    return;
                }

                const canvasRect = scene.canvas.getBoundingClientRect();
                tooltip.style.left = (screenPos.x + canvasRect.left) + 'px';
                tooltip.style.top = (screenPos.y + canvasRect.top - 10) + 'px';
            }

            scene.postRender.addEventListener(updateTooltipPosition);

            // ==================== 倒计时控制 ====================
            function startCountdown() {
                if (countdownTimer) {
                    clearTimeout(countdownTimer);
                    countdownTimer = null;
                }
                countdownStartTime = Date.now();
                countdownTimer = setTimeout(function () {
                    tooltip.style.display = 'none';
                    tooltipCartesian = null;
                    // 倒计时结束后同时清除高亮
                    removeHighlight();
                    remainingTime = TOOLTIP_DURATION;
                }, remainingTime);
            }

            function pauseCountdown() {
                if (countdownTimer) {
                    clearTimeout(countdownTimer);
                    countdownTimer = null;
                    const elapsed = Date.now() - countdownStartTime;
                    remainingTime = Math.max(0, remainingTime - elapsed);
                }
            }

            function resetCountdown() {
                if (countdownTimer) {
                    clearTimeout(countdownTimer);
                    countdownTimer = null;
                }
                remainingTime = TOOLTIP_DURATION;
                isHovering = false;
                startCountdown();
            }

            tooltip.addEventListener('mouseenter', function () {
                isHovering = true;
                pauseCountdown();
            });

            tooltip.addEventListener('mouseleave', function () {
                isHovering = false;
                startCountdown();
            });
5、查询逻辑
javascript
    // ==================== 高亮栅格相关 ====================
            /**
             * 移除当前高亮实体
             */
            function removeHighlight() {
                if (highlightEntity) {
                    viewer.entities.remove(highlightEntity);
                    highlightEntity = null;
                }
            }

            /**
             * 在指定栅格范围绘制高亮多边形
             * @param {number} west  西经
             * @param {number} south 南纬
             * @param {number} east  东经
             * @param {number} north 北纬
             */
            function drawHighlight(west, south, east, north) {
                // 先清除旧高亮
                removeHighlight();

                // 构造多边形四角
                const positions = SuperMap3D.Cartesian3.fromDegreesArray([
                    west, south,
                    east, south,
                    east, north,
                    west, north
                ]);

                highlightEntity = viewer.entities.add({
                    name: '栅格高亮',
                    polygon: {
                        hierarchy: new SuperMap3D.PolygonHierarchy(positions),
                        // 半透明黄色填充
                        material: SuperMap3D.Color.YELLOW.withAlpha(0.4),
                        // 白色边框
                        outline: true,
                        outlineColor: SuperMap3D.Color.WHITE,
                        outlineWidth: 2,
                        // 贴合地形
                        perPositionHeight: false,
                        // 关闭深度检测,保证高亮不被地形遮挡(可选)
                        // 如果希望被山体遮挡,改为 true
                        classificationType: SuperMap3D.ClassificationType.TERRAIN
                    }
                });
            }

            // ==================== 点击事件 ====================
            handler.setInputAction(function (click) {
                if (isQuerying) return;

                const position = click.position;

                const cartesian = scene.pickPosition(position);
                if (!cartesian) {
                    tooltip.style.display = 'none';
                    tooltipCartesian = null;
                    removeHighlight();
                    return;
                }

                const cartographic = SuperMap3D.Cartographic.fromCartesian(cartesian);
                if (!cartographic) {
                    tooltip.style.display = 'none';
                    tooltipCartesian = null;
                    removeHighlight();
                    return;
                }

                const longitude = SuperMap3D.Math.toDegrees(cartographic.longitude);
                const latitude = SuperMap3D.Math.toDegrees(cartographic.latitude);

                if (isNaN(longitude) || isNaN(latitude)) {
                    tooltip.style.display = 'none';
                    tooltipCartesian = null;
                    removeHighlight();
                    return;
                }

                tooltipCartesian = cartesian;

                // 先画一个以点击位置为中心、像元大小为边长的正方形
                // 这个范围会随后被服务返回的 centerPoint 修正
                const half = DEM_CELL_SIZE / 2;
                drawHighlight(
                    longitude - half,
                    latitude - half,
                    longitude + half,
                    latitude + half
                );

                tooltip.innerHTML = '查询中...';
                tooltip.style.display = 'block';
                isQuerying = true;

                const baseUrl = "http://localhost:8090/iserver/services/data-WorkSpace-2/rest/data/datasources/DataSource/datasets/ASTGTMV003_N30E102_dem/gridValue.rjson";
                const url = `${baseUrl}?x=${longitude}&y=${latitude}`;

                $.ajax({
                    type: "get",
                    url: url,
                    timeout: 5000,
                    success: function (result) {
                        try {
                            var resultObj = typeof result === 'string' ? JSON.parse(result) : result;

                            var row = (resultObj && typeof resultObj.row !== 'undefined') ? resultObj.row : '-';
                            var column = (resultObj && typeof resultObj.column !== 'undefined') ? resultObj.column : '-';
                            var value = (resultObj && typeof resultObj.value !== 'undefined') ? resultObj.value : '无效数据';

                            if (typeof value === 'number') {
                                value = value.toFixed(2);
                            }

                            tooltip.innerHTML =
                                `栅格行: ${row}<br>` +
                                `栅格列: ${column}<br>` +
                                `栅格值: ${value}`;

                            tooltip.style.display = 'block';

                            // ==================== 用服务返回的 centerPoint 修正高亮位置 ====================
                            if (resultObj && resultObj.centerPoint &&
                                typeof resultObj.centerPoint.x === 'number' &&
                                typeof resultObj.centerPoint.y === 'number') {

                                const cx = resultObj.centerPoint.x;
                                const cy = resultObj.centerPoint.y;
                                const h = DEM_CELL_SIZE / 2;

                                // 用真实的栅格中心点重新绘制高亮
                                drawHighlight(
                                    cx - h,
                                    cy - h,
                                    cx + h,
                                    cy + h
                                );

                                // 顺便把气泡也固定到栅格中心点(可选)
                                // tooltipCartesian = SuperMap3D.Cartesian3.fromDegrees(cx, cy);
                            }

                            resetCountdown();

                        } catch (e) {
                            console.error("解析返回数据失败:", e, result);
                            tooltip.innerHTML = '数据解析失败';
                            resetCountdown();
                        }
                    },
                    error: function (msg) {
                        console.log('查询失败:', msg);
                        tooltip.innerHTML = '查询失败';
                        resetCountdown();
                    },
                    complete: function () {
                        isQuerying = false;
                    }
                });

            }, SuperMap3D.ScreenSpaceEventType.LEFT_CLICK);

            // 鼠标移出画布时隐藏提示
            scene.canvas.addEventListener('mouseleave', function () {
                tooltip.style.display = 'none';
                tooltipCartesian = null;
                removeHighlight();
                if (countdownTimer) {
                    clearTimeout(countdownTimer);
                    countdownTimer = null;
                }
                remainingTime = TOOLTIP_DURATION;
                isQuerying = false;
            });
三、示例完整代码
javascript
<!DOCTYPE html>
<html lang="zh-CN">
<head>
<meta charset="utf-8">
<meta http-equiv="X-UA-Compatible" content="IE=Edge,chrome=1">
<meta name="viewport"
content="width=device-width, initial-scale=1, maximum-scale=1, minimum-scale=1, user-scalable=no">
<title>SuperMap iClient3D for WebGL 交互式栅格信息查询</title>
<link href="./css/pretty.css" rel="stylesheet">
<script src="./js/jquery.min.js"></script>
<script src="./js/loadSDK/loadSDK.js"></script>
<style>
#grid-tooltip {
position: absolute;
background: rgba(0, 0, 0, 0.8);
color: #fff;
padding: 8px 16px;
border-radius: 6px;
font-size: 14px;
font-family: "Microsoft YaHei", sans-serif;
pointer-events: auto;
z-index: 9999;
display: none;
white-space: nowrap;
box-shadow: 0 4px 12px rgba(0, 0, 0, 0.4);
border: 1px solid rgba(255, 255, 255, 0.2);
transform: translate(-50%, -100%);
margin-top: -15px;
line-height: 1.6;
text-align: left;
cursor: default;
}
#grid-tooltip::after {
content: '';
position: absolute;
bottom: -6px;
left: 50%;
margin-left: -6px;
border-width: 6px 6px 0;
border-style: solid;
border-color: rgba(0, 0, 0, 0.8) transparent transparent transparent;
}
#loadingbar {
position: absolute;
top: 50%;
left: 50%;
transform: translate(-50%, -50%);
z-index: 1000;
}
html,
body,
#Container {
width: 100%;
height: 100%;
margin: 0;
padding: 0;
overflow: hidden;
background-color: #000;
}
</style>
</head>
<body>
<div id="Container"></div>
<div id="grid-tooltip"></div>
<div id='loadingbar' class="spinner">
<div class="spinner-container container1">
<div class="circle1"></div>
<div class="circle2"></div>
<div class="circle3"></div>
<div class="circle4"></div>
</div>
<div class="spinner-container container2">
<div class="circle1"></div>
<div class="circle2"></div>
<div class="circle3"></div>
<div class="circle4"></div>
</div>
<div class="spinner-container container3">
<div class="circle1"></div>
<div class="circle2"></div>
<div class="circle3"></div>
<div class="circle4"></div>
</div>
</div>
<script>
let isQuerying = false;
let tooltipCartesian = null;
const TOOLTIP_DURATION = 4000;
let countdownTimer = null;
let countdownStartTime = 0;
let remainingTime = TOOLTIP_DURATION;
let isHovering = false;
// 高亮实体句柄
let highlightEntity = null;
const DEM_CELL_SIZE = 0.0008333; // 像元大小(度),约 90 米 @ 30°N
function onload(SuperMap3D) {
var viewer = new SuperMap3D.Viewer('Container', {
animation: false,
timeline: false,
fullscreenButton: false,
baseLayerPicker: false,
geocoder: false,
homeButton: false,
sceneModePicker: false,
navigationHelpButton: false,
infoBox: false,
selectionIndicator: false
});
viewer.scenePromise.then(function (scene) {
init(SuperMap3D, scene, viewer);
});
}
async function init(SuperMap3D, scene, viewer) {
viewer.resolutionScale = window.devicePixelRatio;
// ==================== 1. 加载影像图层 ====================
var mapUrl = "http://localhost:8090/iserver/services/map-WorkSpace/rest/maps/ASTGTMV003_N30E102_dem%40DataSource";
try {
var imageryProvider = new SuperMap3D.SuperMapImageryProvider({
url: mapUrl
});
var imageryLayer = viewer.imageryLayers.addImageryProvider(imageryProvider);
imageryLayer.alpha = 1.0;
} catch (e) {
console.error("地图服务加载失败:", e);
}
// ==================== 2. 定位到影像图层 ====================
viewer.flyTo(imageryLayer);
$('#loadingbar').remove();
// ==================== 3. 点击查询栅格值 ====================
const tooltip = document.getElementById('grid-tooltip');
const handler = new SuperMap3D.ScreenSpaceEventHandler(scene.canvas);
scene.globe.depthTestAgainstTerrain = true;
// ==================== 气泡位置实时更新 ====================
function updateTooltipPosition() {
if (!tooltipCartesian || tooltip.style.display === 'none') return;
const screenPos = SuperMap3D.SceneTransforms.wgs84ToWindowCoordinates(scene, tooltipCartesian);
if (!screenPos) {
tooltip.style.display = 'none';
return;
}
const canvasRect = scene.canvas.getBoundingClientRect();
tooltip.style.left = (screenPos.x + canvasRect.left) + 'px';
tooltip.style.top = (screenPos.y + canvasRect.top - 10) + 'px';
}
scene.postRender.addEventListener(updateTooltipPosition);
// ==================== 倒计时控制 ====================
function startCountdown() {
if (countdownTimer) {
clearTimeout(countdownTimer);
countdownTimer = null;
}
countdownStartTime = Date.now();
countdownTimer = setTimeout(function () {
tooltip.style.display = 'none';
tooltipCartesian = null;
// 倒计时结束后同时清除高亮
removeHighlight();
remainingTime = TOOLTIP_DURATION;
}, remainingTime);
}
function pauseCountdown() {
if (countdownTimer) {
clearTimeout(countdownTimer);
countdownTimer = null;
const elapsed = Date.now() - countdownStartTime;
remainingTime = Math.max(0, remainingTime - elapsed);
}
}
function resetCountdown() {
if (countdownTimer) {
clearTimeout(countdownTimer);
countdownTimer = null;
}
remainingTime = TOOLTIP_DURATION;
isHovering = false;
startCountdown();
}
tooltip.addEventListener('mouseenter', function () {
isHovering = true;
pauseCountdown();
});
tooltip.addEventListener('mouseleave', function () {
isHovering = false;
startCountdown();
});
// ==================== 高亮栅格相关 ====================
/**
* 移除当前高亮实体
*/
function removeHighlight() {
if (highlightEntity) {
viewer.entities.remove(highlightEntity);
highlightEntity = null;
}
}
/**
* 在指定栅格范围绘制高亮多边形
* @param {number} west 西经
* @param {number} south 南纬
* @param {number} east 东经
* @param {number} north 北纬
*/
function drawHighlight(west, south, east, north) {
// 先清除旧高亮
removeHighlight();
// 构造多边形四角
const positions = SuperMap3D.Cartesian3.fromDegreesArray([
west, south,
east, south,
east, north,
west, north
]);
highlightEntity = viewer.entities.add({
name: '栅格高亮',
polygon: {
hierarchy: new SuperMap3D.PolygonHierarchy(positions),
// 半透明黄色填充
material: SuperMap3D.Color.YELLOW.withAlpha(0.4),
// 白色边框
outline: true,
outlineColor: SuperMap3D.Color.WHITE,
outlineWidth: 2,
// 贴合地形
perPositionHeight: false,
// 关闭深度检测,保证高亮不被地形遮挡(可选)
// 如果希望被山体遮挡,改为 true
classificationType: SuperMap3D.ClassificationType.TERRAIN
}
});
}
// ==================== 点击事件 ====================
handler.setInputAction(function (click) {
if (isQuerying) return;
const position = click.position;
const cartesian = scene.pickPosition(position);
if (!cartesian) {
tooltip.style.display = 'none';
tooltipCartesian = null;
removeHighlight();
return;
}
const cartographic = SuperMap3D.Cartographic.fromCartesian(cartesian);
if (!cartographic) {
tooltip.style.display = 'none';
tooltipCartesian = null;
removeHighlight();
return;
}
const longitude = SuperMap3D.Math.toDegrees(cartographic.longitude);
const latitude = SuperMap3D.Math.toDegrees(cartographic.latitude);
if (isNaN(longitude) || isNaN(latitude)) {
tooltip.style.display = 'none';
tooltipCartesian = null;
removeHighlight();
return;
}
tooltipCartesian = cartesian;
// 先画一个以点击位置为中心、像元大小为边长的正方形
// 这个范围会随后被服务返回的 centerPoint 修正
const half = DEM_CELL_SIZE / 2;
drawHighlight(
longitude - half,
latitude - half,
longitude + half,
latitude + half
);
tooltip.innerHTML = '查询中...';
tooltip.style.display = 'block';
isQuerying = true;
const baseUrl = "http://localhost:8090/iserver/services/data-WorkSpace-2/rest/data/datasources/DataSource/datasets/ASTGTMV003_N30E102_dem/gridValue.rjson";
const url = `${baseUrl}?x=${longitude}&y=${latitude}`;
$.ajax({
type: "get",
url: url,
timeout: 5000,
success: function (result) {
try {
var resultObj = typeof result === 'string' ? JSON.parse(result) : result;
var row = (resultObj && typeof resultObj.row !== 'undefined') ? resultObj.row : '-';
var column = (resultObj && typeof resultObj.column !== 'undefined') ? resultObj.column : '-';
var value = (resultObj && typeof resultObj.value !== 'undefined') ? resultObj.value : '无效数据';
if (typeof value === 'number') {
value = value.toFixed(2);
}
tooltip.innerHTML =
`栅格行: ${row}<br>` +
`栅格列: ${column}<br>` +
`栅格值: ${value}`;
tooltip.style.display = 'block';
// ==================== 用服务返回的 centerPoint 修正高亮位置 ====================
if (resultObj && resultObj.centerPoint &&
typeof resultObj.centerPoint.x === 'number' &&
typeof resultObj.centerPoint.y === 'number') {
const cx = resultObj.centerPoint.x;
const cy = resultObj.centerPoint.y;
const h = DEM_CELL_SIZE / 2;
// 用真实的栅格中心点重新绘制高亮
drawHighlight(
cx - h,
cy - h,
cx + h,
cy + h
);
// 顺便把气泡也固定到栅格中心点(可选)
// tooltipCartesian = SuperMap3D.Cartesian3.fromDegrees(cx, cy);
}
resetCountdown();
} catch (e) {
console.error("解析返回数据失败:", e, result);
tooltip.innerHTML = '数据解析失败';
resetCountdown();
}
},
error: function (msg) {
console.log('查询失败:', msg);
tooltip.innerHTML = '查询失败';
resetCountdown();
},
complete: function () {
isQuerying = false;
}
});
}, SuperMap3D.ScreenSpaceEventType.LEFT_CLICK);
// 鼠标移出画布时隐藏提示
scene.canvas.addEventListener('mouseleave', function () {
tooltip.style.display = 'none';
tooltipCartesian = null;
removeHighlight();
if (countdownTimer) {
clearTimeout(countdownTimer);
countdownTimer = null;
}
remainingTime = TOOLTIP_DURATION;
isQuerying = false;
});
}
</script>
</body>
</html>