流水线运行是否正随时间变得更加集中?
数据与完整代码来源:
ruby
https://mbd.pub/o/bread/YZaVmJhpZQ数据集简介
围绕"流水线运行是否正随时间变得更加集中"这一问题,这里使用了一份流水线运行记录数据。数据以逐条运行的形式组织,每条记录对应一次流水线执行,涵盖运行发生的时间以及运行所属的主体(如项目或执行者)等维度信息,可用于刻画流水线活动在不同主体之间的分布状况。
从分析角度看,这类数据的价值在于把"集中度"变成可度量的对象:按时间切片统计各主体的运行份额,再借助基尼系数、赫芬达尔指数或头部占比等指标,就能观察流水线运行是否正在向少数主体聚集,以及这种趋势随时间如何演变。数据覆盖的时间跨度越长,越有助于区分短期波动与长期结构性变化。
适用场景方面,它既适合做集中度与不平等程度的时序分析,也适合通过可视化展示头部主体份额的变化轨迹,还可以进一步探讨集中度升降背后的驱动因素,例如生态扩张、平台策略调整或自动化程度的提升。
后文将基于这份数据,从指标构建到图表呈现,完整演示如何回答标题中的问题。
数据集
Data Engineering & Modern AI Pipelines 2026
研究问题
流水线运行是否正随时间日益集中于越来越少的编排组件集合?
核心要点
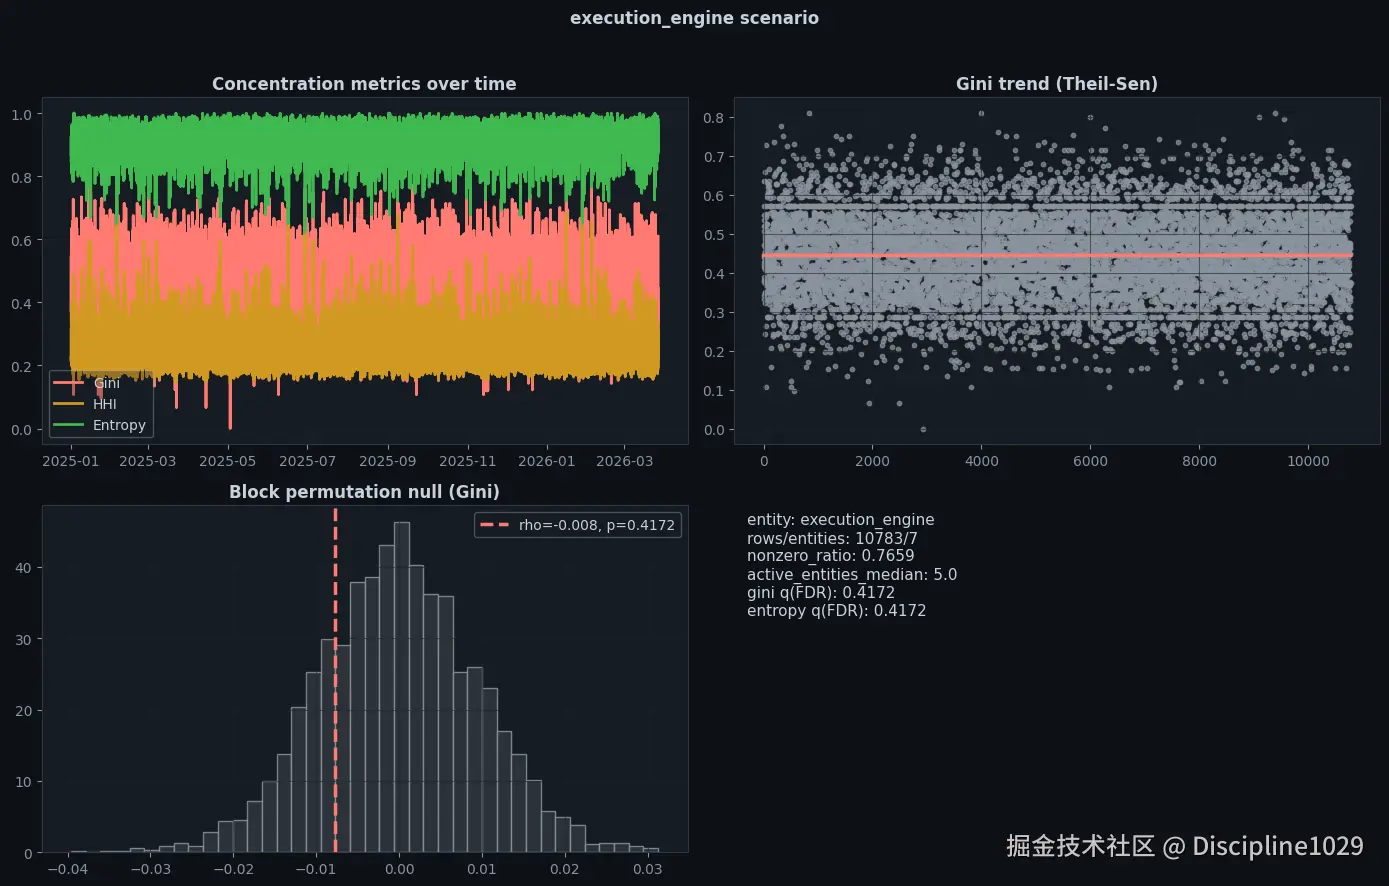
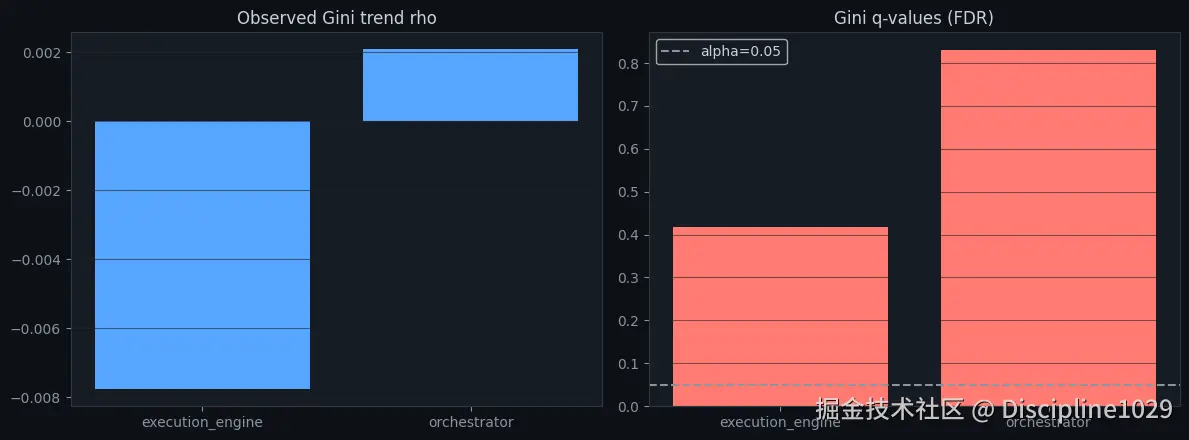
在本分析中,我们发现以下方面不存在统计上显著的集中度漂移:
- 编排平台,以及
- 执行引擎。
也就是说,分布总体上保持稳定,而非发生结构性漂移。
方法概述
- 使用
pipeline_execution_telemetry作为主要运营表。 - 构建按小时分桶、实体级运行计数的面板数据。
- 按小时计算集中度指标:
- Gini(值越高 = 越集中)
- HHI(值越高 = 越集中)
- Normalized Entropy(值越低 = 越集中)
- 使用以下方法检验时间趋势:
- 针对 Spearman 趋势的块置换检验
- Mann-Kendall 趋势检验
- Theil-Sen 稳健斜率
- 跨指标的 FDR 校正
- 评估在注入噪声下的稳健性。
python
from dataclasses import dataclass, asdict, field
from pathlib import Path
from datetime import datetime
from typing import Dict, Any, List, Optional
import hashlib
import json

import numpy as np
import pandas as pd
import matplotlib.pyplot as plt
from scipy import stats

plt.rcParams.update({
    "font.family": "sans-serif",
    "figure.facecolor": "#0d1117",
    "axes.facecolor": "#161b22",
    "axes.edgecolor": "#30363d",
    "axes.labelcolor": "#c9d1d9",
    "text.color": "#c9d1d9",
    "xtick.color": "#8b949e",
    "ytick.color": "#8b949e",
    "grid.color": "#21262d",
    "grid.alpha": 0.6,
})
python
@dataclass
class Config:
    random_seed: int = 42

    # Data discovery
    dataset_dir: Optional[str] = None
    expected_file: str = "pipeline_execution_telemetry.parquet"

    # Core schema
    time_col: str = "execution_timestamp"
    freq: str = "1h"

    # Filtering
    min_total_per_bucket: int = 5

    # Scenario entities
    entity_candidates: List[str] = field(default_factory=lambda: ["orchestrator", "execution_engine"])

    # Statistical controls
    n_permutations: int = 3000
    alpha: float = 0.05
    noise_sigmas: List[float] = field(default_factory=lambda: [0.0, 0.02, 0.05, 0.1, 0.2])
    robustness_repeats: int = 100

    # Output
    output_dir: str = "kaggle_outputs_pipeline_concentration_stability"

cfg = Config()
rng = np.random.default_rng(cfg.random_seed)
Path(cfg.output_dir).mkdir(parents=True, exist_ok=True)
cfg
text
Config(random_seed=42, dataset_dir=None, expected_file='pipeline_execution_telemetry.parquet', time_col='execution_timestamp', freq='1h', min_total_per_bucket=5, entity_candidates=['orchestrator', 'execution_engine'], n_permutations=3000, alpha=0.05, noise_sigmas=[0.0, 0.02, 0.05, 0.1, 0.2], robustness_repeats=100, output_dir='kaggle_outputs_pipeline_concentration_stability')
python
def discover_file(cfg: Config) -> Path:
    roots = []
    if cfg.dataset_dir:
        roots.append(Path(cfg.dataset_dir))
    roots.extend([Path('.'), Path('/kaggle/input')])

    for root in roots:
        if not root.exists():
            continue

        p = root / cfg.expected_file
        if p.exists():
            return p

        hits = list(root.rglob(cfg.expected_file))
        if hits:
            return hits[0]

        csv_name = cfg.expected_file.replace('.parquet', '.csv')
        p_csv = root / csv_name
        if p_csv.exists():
            return p_csv
        hits_csv = list(root.rglob(csv_name))
        if hits_csv:
            return hits_csv[0]

    raise FileNotFoundError("Could not locate pipeline_execution_telemetry.parquet/.csv")

def load_data(cfg: Config) -> pd.DataFrame:
    file_path = discover_file(cfg)
    print("Using file:", file_path)

    if file_path.suffix.lower() == ".parquet":
        df = pd.read_parquet(file_path)
    else:
        df = pd.read_csv(file_path, low_memory=False)

    required = [cfg.time_col, "orchestrator", "execution_engine"]
    miss = [c for c in required if c not in df.columns]
    if miss:
        raise ValueError(f"Missing required columns: {miss}")

    df[cfg.time_col] = pd.to_datetime(df[cfg.time_col], errors="coerce", utc=True)
    df = df.dropna(subset=[cfg.time_col]).copy()
    return df

def audit_data(df: pd.DataFrame, cfg: Config) -> Dict[str, Any]:
    return {
        "shape": [int(df.shape[0]), int(df.shape[1])],
        "data_hash": hashlib.sha256(pd.util.hash_pandas_object(df, index=True).values).hexdigest()[:16],
        "min_timestamp": str(df[cfg.time_col].min()),
        "max_timestamp": str(df[cfg.time_col].max()),
        "orchestrator_nunique": int(df["orchestrator"].nunique(dropna=True)),
        "execution_engine_nunique": int(df["execution_engine"].nunique(dropna=True)),
    }

raw_df = load_data(cfg)
audit = audit_data(raw_df, cfg)
audit
text
Using file: /kaggle/input/datasets/dianatofficial/data-engineering-ai-pipelines/pipeline_execution_telemetry.parquet
text
{'shape': [150000, 24],
 'data_hash': '11fc4fa4d9ca3c1b',
 'min_timestamp': '2025-01-01 00:00:58+00:00',
 'max_timestamp': '2026-03-26 23:59:11+00:00',
 'orchestrator_nunique': 7,
 'execution_engine_nunique': 7}
python
def gini(x: np.ndarray) -> float:
    x = np.asarray(x, dtype=float)
    x = x[x >= 0]
    if x.size == 0 or x.sum() == 0:
        return 0.0
    x = np.sort(x)
    n = x.size
    idx = np.arange(1, n + 1)
    return float(((2 * idx - n - 1) * x).sum() / (n * x.sum()))

def entropy_norm(p: np.ndarray) -> float:
    p = np.asarray(p, dtype=float)
    p = p[p > 0]
    n = max(2, len(p))
    return float(-(p * np.log(p)).sum() / np.log(n))

def compute_metrics(shares: pd.DataFrame) -> pd.DataFrame:
    rows = []
    for t, row in shares.iterrows():
        v = row.values.astype(float)
        rows.append({
            "time_bucket": t,
            "gini": gini(v),
            "hhi": float(np.square(v).sum()),
            "normalized_entropy": entropy_norm(v),
        })
    return pd.DataFrame(rows).set_index("time_bucket")

def mann_kendall(y: np.ndarray) -> Dict[str, float]:
    y = np.asarray(y, dtype=float)
    n = len(y)
    s = 0
    for i in range(n - 1):
        s += np.sign(y[i + 1:] - y[i]).sum()

    _, counts = np.unique(y, return_counts=True)
    tie_term = np.sum(counts * (counts - 1) * (2 * counts + 5))
    var_s = (n * (n - 1) * (2 * n + 5) - tie_term) / 18.0

    if s > 0:
        z = (s - 1) / np.sqrt(var_s)
    elif s < 0:
        z = (s + 1) / np.sqrt(var_s)
    else:
        z = 0.0

    p = 2 * (1 - stats.norm.cdf(abs(z)))
    return {"S": float(s), "z": float(z), "p_value": float(p)}

def block_permutation(series: np.ndarray, n_perms: int, block_size: int, seed: int):
    rng_local = np.random.default_rng(seed)
    x = np.asarray(series, dtype=float)
    t = np.arange(len(x), dtype=float)
    rho_obs, _ = stats.spearmanr(t, x)
    rho_obs = float(rho_obs)

    blocks = [x[i:i + block_size] for i in range(0, len(x), block_size)]
    null = np.empty(n_perms, dtype=float)

    for i in range(n_perms):
        perm = rng_local.permutation(len(blocks))
        xp = np.concatenate([blocks[j] for j in perm])[:len(x)]
        rho, _ = stats.spearmanr(t, xp)
        null[i] = float(rho)

    k = int(np.sum(np.abs(null) >= abs(rho_obs)))
    p = (k + 1) / (n_perms + 1)
    return rho_obs, float(p), null

def fdr_bh(pvals: Dict[str, float]) -> Dict[str, float]:
    ordered = sorted(pvals.items(), key=lambda kv: kv[1])
    m = len(ordered)
    out = {}
    prev = 1.0
    for rank, (name, p) in enumerate(reversed(ordered), start=1):
        i = m - rank + 1
        q = min(prev, p * m / i)
        out[name] = q
        prev = q
    return {k: float(out[k]) for k, _ in ordered}

def robustness_mc(shares: pd.DataFrame, cfg: Config) -> pd.DataFrame:
    base = compute_metrics(shares)
    b = {
        "gini": base["gini"].values,
        "hhi": base["hhi"].values,
        "entropy": base["normalized_entropy"].values,
    }

    rows = []
    rng_local = np.random.default_rng(cfg.random_seed)

    for sigma in cfg.noise_sigmas:
        corr = {"gini": [], "hhi": [], "entropy": []}
        for _ in range(cfg.robustness_repeats):
            noisy = shares.values * (1 + rng_local.normal(0, sigma, size=shares.shape))
            noisy = np.clip(noisy, 0, None)
            s = noisy.sum(axis=1, keepdims=True)
            s[s == 0] = 1.0
            noisy = noisy / s

            nm = compute_metrics(pd.DataFrame(noisy, index=shares.index, columns=shares.columns))
            corr["gini"].append(float(stats.spearmanr(b["gini"], nm["gini"].values).statistic))
            corr["hhi"].append(float(stats.spearmanr(b["hhi"], nm["hhi"].values).statistic))
            corr["entropy"].append(float(stats.spearmanr(b["entropy"], nm["normalized_entropy"].values).statistic))

        for m in ["gini", "hhi", "entropy"]:
            v = np.array(corr[m], dtype=float)
            rows.append({
                "sigma": float(sigma),
                "metric": m,
                "mean_rank_corr": float(v.mean()),
                "ci_low": float(np.quantile(v, 0.025)),
                "ci_high": float(np.quantile(v, 0.975)),
            })

    return pd.DataFrame(rows)
python
def run_scenario(df: pd.DataFrame, cfg: Config, entity_col: str) -> Dict[str, Any]:
    x = df[[cfg.time_col, entity_col]].dropna().copy()
    x["time_bucket"] = x[cfg.time_col].dt.floor(cfg.freq)

    counts = x.groupby(["time_bucket", entity_col], as_index=False).size().rename(columns={"size": "value"})
    panel = counts.pivot(index="time_bucket", columns=entity_col, values="value").fillna(0.0).sort_index()

    full_idx = pd.date_range(panel.index.min(), panel.index.max(), freq=cfg.freq)
    panel = panel.reindex(full_idx, fill_value=0.0)

    totals = panel.sum(axis=1)
    panel = panel.loc[totals >= cfg.min_total_per_bucket].copy()
    totals = panel.sum(axis=1)

    shares = panel.div(totals.replace(0, np.nan), axis=0).fillna(0.0)
    metrics = compute_metrics(shares)

    trend = {}
    raw_p = {}
    null_gini = None
    t = np.arange(len(metrics), dtype=float)

    for m in ["gini", "hhi", "normalized_entropy"]:
        y = metrics[m].values.astype(float)
        rho, p, null = block_permutation(y, cfg.n_permutations, block_size=24, seed=cfg.random_seed)
        mk = mann_kendall(y)
        slope, intercept, lo, hi = stats.theilslopes(y, t, 0.95)

        trend[m] = {
            "block_permutation": {"rho": float(rho), "p": float(p)},
            "mann_kendall": mk,
            "theil_sen": {
                "slope": float(slope),
                "slope_ci_low": float(lo),
                "slope_ci_high": float(hi),
                "intercept": float(intercept),
            },
        }
        raw_p[m] = float(p)
        if m == "gini":
            null_gini = null

    q = fdr_bh(raw_p)
    for m in trend:
        trend[m]["block_permutation"]["q_fdr"] = float(q[m])
        trend[m]["block_permutation"]["significant"] = bool(q[m] < cfg.alpha)

    robust = robustness_mc(shares, cfg)

    diag = {
        "rows": int(panel.shape[0]),
        "entities": int(panel.shape[1]),
        "nonzero_ratio": float((panel.values > 0).mean()),
        "active_entities_median": float((panel > 0).sum(axis=1).median()),
        "active_entities_p90": float((panel > 0).sum(axis=1).quantile(0.9)),
    }

    summary = {
        "entity_col": entity_col,
        "rows": diag["rows"],
        "entities": diag["entities"],
        "nonzero_ratio": diag["nonzero_ratio"],
        "gini_current": float(metrics["gini"].iloc[-1]),
        "hhi_current": float(metrics["hhi"].iloc[-1]),
        "entropy_current": float(metrics["normalized_entropy"].iloc[-1]),
        "gini_rho": float(trend["gini"]["block_permutation"]["rho"]),
        "gini_q": float(trend["gini"]["block_permutation"]["q_fdr"]),
        "entropy_q": float(trend["normalized_entropy"]["block_permutation"]["q_fdr"]),
    }

    return {
        "diag": diag,
        "metrics": metrics,
        "trend": trend,
        "robustness": robust,
        "summary": summary,
        "null_gini": null_gini,
    }

results = {}
for entity in cfg.entity_candidates:
    results[entity] = run_scenario(raw_df, cfg, entity)

summary_df = pd.DataFrame([results[e]["summary"] for e in results]).sort_values("entity_col")
summary_df
text
entity_col   rows  entities  nonzero_ratio  gini_current  \
1  execution_engine  10783         7       0.765928      0.609524
0      orchestrator  10783         7       0.778752      0.400000

   hhi_current  entropy_current  gini_rho    gini_q  entropy_q
1     0.333333         0.873233 -0.007772  0.417194   0.417194
0     0.217778         0.915138  0.002089  0.830057   0.830057
python
def plot_result(entity: str, result: Dict[str, Any]):
    metrics = result["metrics"]
    trend = result["trend"]
    null_gini = result["null_gini"]
    diag = result["diag"]

    red, amber, green = "#ff7b72", "#d29922", "#3fb950"
    fig, axes = plt.subplots(2, 2, figsize=(14, 9))
    t = np.arange(len(metrics), dtype=float)

    ax = axes[0, 0]
    ax.plot(metrics.index, metrics["gini"], color=red, label="Gini", linewidth=2)
    ax.plot(metrics.index, metrics["hhi"], color=amber, label="HHI", linewidth=2)
    ax.plot(metrics.index, metrics["normalized_entropy"], color=green, label="Entropy", linewidth=2)
    ax.set_title("Concentration metrics over time", fontweight="bold")
    ax.legend(framealpha=0.3)
    ax.grid(True)

    ax = axes[0, 1]
    y = metrics["gini"].values
    ts = trend["gini"]["theil_sen"]
    yhat = ts["intercept"] + ts["slope"] * t
    ax.scatter(t, y, s=10, alpha=0.7, color="#8b949e")
    ax.plot(t, yhat, color=red, linewidth=2.5)
    ax.set_title("Gini trend (Theil-Sen)", fontweight="bold")
    ax.grid(True)

    ax = axes[1, 0]
    rho = trend["gini"]["block_permutation"]["rho"]
    p = trend["gini"]["block_permutation"]["p"]
    ax.hist(null_gini, bins=40, density=True, color="#30363d", edgecolor="#8b949e", alpha=0.85)
    ax.axvline(rho, color=red, linestyle="--", linewidth=2.5, label=f"rho={rho:.3f}, p={p:.4g}")
    ax.set_title("Block permutation null (Gini)", fontweight="bold")
    ax.legend(framealpha=0.3)
    ax.grid(True)

    ax = axes[1, 1]
    ax.axis("off")
    txt = [
        f"entity: {entity}",
        f"rows/entities: {diag['rows']}/{diag['entities']}",
        f"nonzero_ratio: {diag['nonzero_ratio']:.4f}",
        f"active_entities_median: {diag['active_entities_median']:.1f}",
        f"gini q(FDR): {trend['gini']['block_permutation']['q_fdr']:.4g}",
        f"entropy q(FDR): {trend['normalized_entropy']['block_permutation']['q_fdr']:.4g}",
    ]
    ax.text(0.02, 0.98, "\n".join(txt), va="top", fontsize=11)

    fig.suptitle(f"{entity} scenario", fontweight="bold")
    fig.tight_layout(rect=[0, 0, 1, 0.96])
    plt.show()

for entity in results:
    plot_result(entity, results[entity])

fig, axes = plt.subplots(1, 2, figsize=(12, 4.5))
axes[0].bar(summary_df["entity_col"], summary_df["gini_rho"], color="#58a6ff")
axes[0].set_title("Observed Gini trend rho")
axes[0].grid(True, axis="y")

axes[1].bar(summary_df["entity_col"], summary_df["gini_q"], color="#ff7b72")
axes[1].axhline(cfg.alpha, color="#8b949e", linestyle="--", label=f"alpha={cfg.alpha}")
axes[1].set_title("Gini q-values (FDR)")
axes[1].legend()
axes[1].grid(True, axis="y")

plt.tight_layout()
plt.show()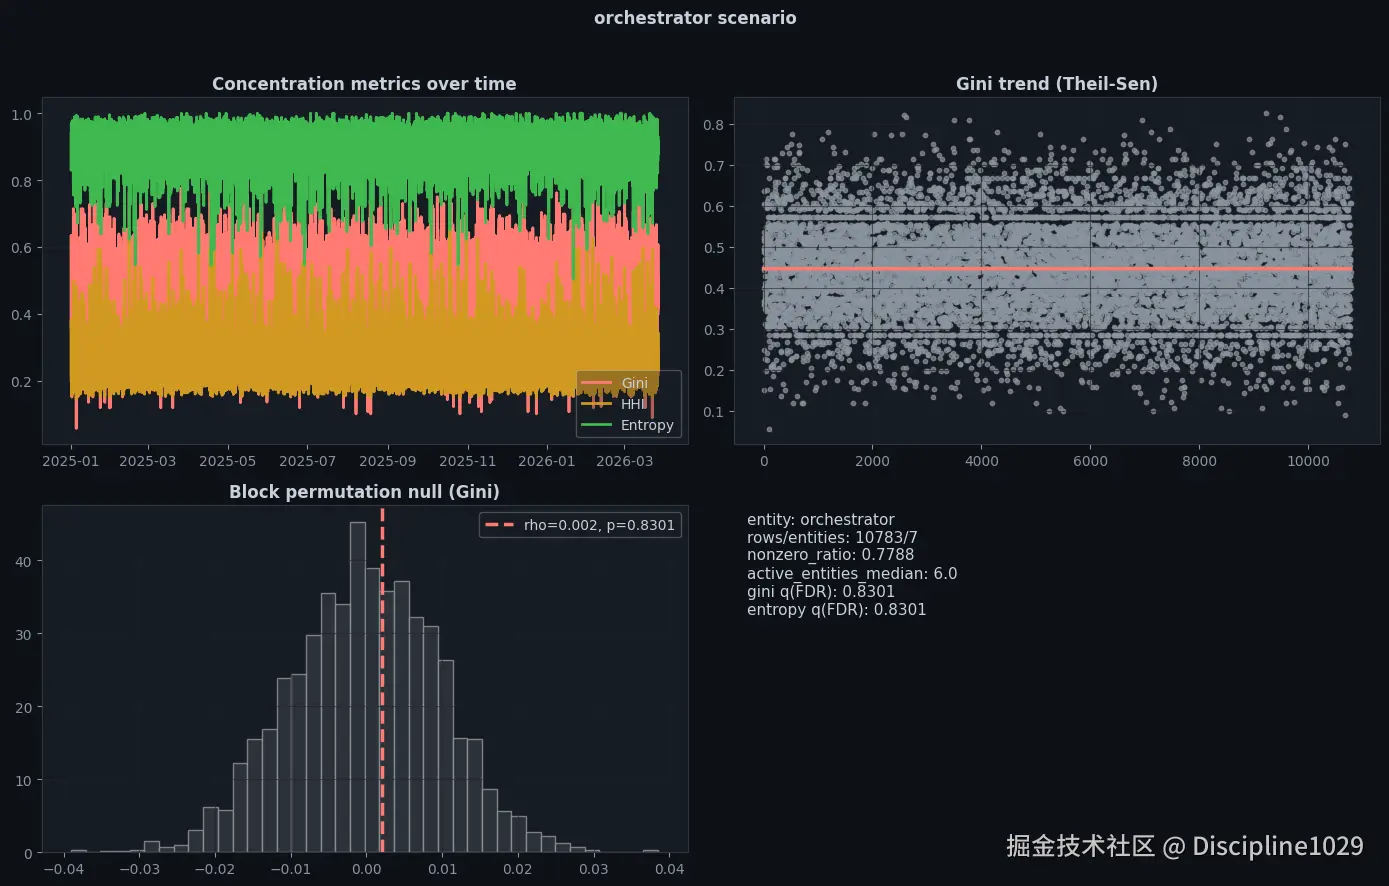
结果解读
如果集中度正在上升,我们预期:
- Gini/HHI 趋势 > 0 且显著,
- 熵趋势 < 0 且显著。
在本次数据集运行中,两种情形都应通过 FDR 校正后的 q 值和效应量(rho/斜率)来解读,而不仅仅是原始 p 值。
python
report = {
    "metadata": {
        "created_at": datetime.now().isoformat(),
        "dataset_name": "Data Engineering & Modern AI Pipelines 2026",
        "config": asdict(cfg),
    },
    "audit": audit,
    "scenario_summary": summary_df.to_dict(orient="records"),
    "scenarios": {},
}

for entity, res in results.items():
    report["scenarios"][entity] = {
        "diag": res["diag"],
        "trend": res["trend"],
        "robustness": res["robustness"].to_dict(orient="records"),
        "current_metrics": {
            "gini": float(res["metrics"]["gini"].iloc[-1]),
            "hhi": float(res["metrics"]["hhi"].iloc[-1]),
            "entropy": float(res["metrics"]["normalized_entropy"].iloc[-1]),
        },
    }

out_path = Path(cfg.output_dir) / "kaggle_pipeline_concentration_stability_report.json"
with open(out_path, "w", encoding="utf-8") as f:
    json.dump(report, f, indent=2, default=float)

print("Saved report:", out_path)
summary_df
text
Saved report: kaggle_outputs_pipeline_concentration_stability/kaggle_pipeline_concentration_stability_report.json
text
entity_col   rows  entities  nonzero_ratio  gini_current  \
1  execution_engine  10783         7       0.765928      0.609524
0      orchestrator  10783         7       0.778752      0.400000

   hhi_current  entropy_current  gini_rho    gini_q  entropy_q
1     0.333333         0.873233 -0.007772  0.417194   0.417194
0     0.217778         0.915138  0.002089  0.830057   0.830057
数据与完整代码来源:
ruby
https://mbd.pub/o/bread/YZaVmJhpZQ