绘图带Plot bands 和 绘图线Plot lines 介绍
绘图线和绘图带在使用上非常相似。
它们都可以设置颜色、事件、编号、标签和z轴索引。这些线和带总是与其所定义的轴垂直。
在使用极坐标图或仪表盘时,这将产生一些有趣的示例,后面会进行描述。当在x轴和y轴上同时使用绘图带或线时,y轴上的绘图带或线会显示在前面,如下面的示例所示。
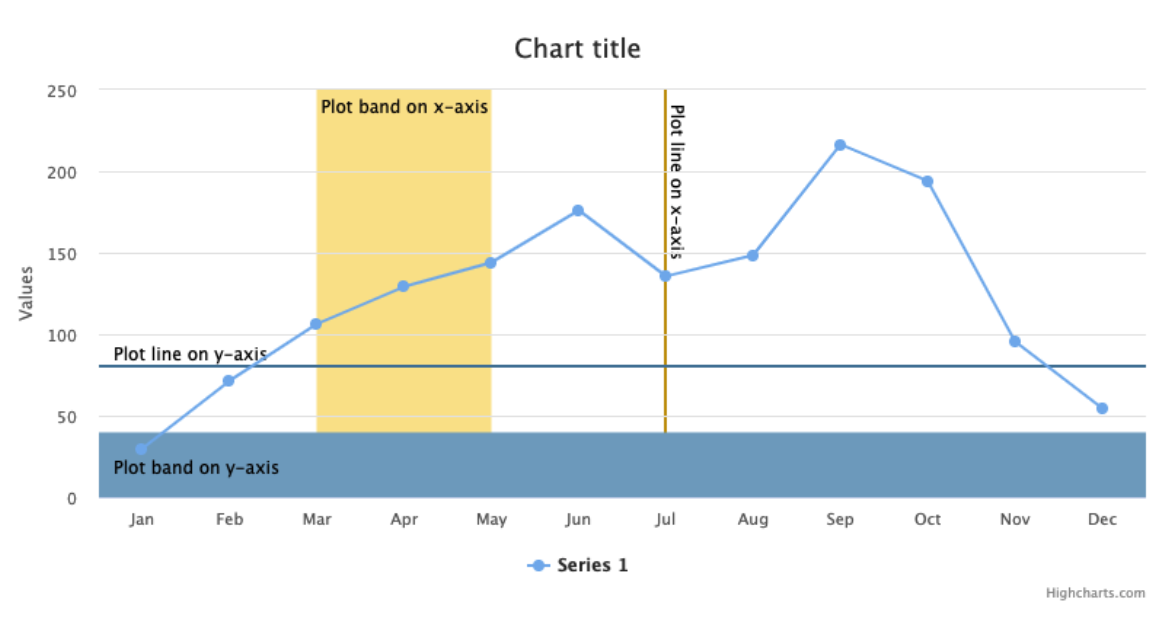
颜色带可以在 x 轴或 y 轴上创建,也可以同时在两个轴上创建:
js
xAxis: {
  ...,
  plotBands: [{
    color: 'orange', // Color value
    from: 3, // Start of the plot band
    to: 4 // End of the plot band
  }],
  plotLines: [{
    color: 'red', // Color value
    dashStyle: 'longdashdot', // Style of the plot line. Default to solid
    value: 3, // Value of where the line will appear
    width: 2 // Width of the line
  }]
},
yAxis: {
  ...,
  plotBands: [{
    ... // Same as in the xAxis
  }],
  plotLines: [{
    ... // Same as in the xAxis
  }]
}
标签 Labels
颜色带和线条都可以包含标签选项。这个标签是在颜色带或线条上方显示的文本。
要为颜色带或线条创建标签,可以添加"label"对象:
js
plotBands: {
  ...,
  label: {
    text: 'I am a label', // Content of the label.
    align: 'left', // Positioning of the label. Default to center.
    x: +10 // Amount of pixels the label will be repositioned according to the alignment.
  }
}
事件 Events
"events" "事件"是可以在绘图带或绘图线对象内部创建的一个对象。这个对象定义了与带或线相关的鼠标事件。支持的事件包括点击、鼠标悬停、鼠标移出和鼠标移动。
js
plotBands: {
  ...,
  events: {
    click: function () {
      // Action performed when event occurs
    },
    mouseover: function () {
      // Action performed when event occurs
    },
    mouseout: function () {
      // Action performed when event occurs
    },
    mousemove: function () {
      // Action performed when event occurs
    }
  }
}
Example 如何使用事件的示例
动态更新
渲染完成后,可以使用 ' addPlotBand() ' 或 addPlotLine() 函数更新图表,添加新的区域或线条;也可以使用 removePlotBand() 或 removePlotLine() 函数移除它们。通过这些函数,图表可以与用户进行交互。
删除颜色带或线条时,必须确保被删除的对象已被赋予一个编号(id)。没有编号,系统无法识别该对象,也无法执行删除操作。
一些关于如何在图表中添加added 颜色带以及如何删除颜色带的简单示例removed。
在极坐标图和仪表盘中绘制带状区域和线条
在极坐标图或仪表盘中使用带状区域时,带状区域会形成一个同心圆环绕在图表周围。当在极坐标图的 x 轴内使用时,带状区域会包裹在图表的外角处。使用在 y 轴内时,它会形成一个圆圈并填充指定区域。在仪表盘中,带状区域会包裹在图表的外角处。当在 x 轴内使用时,绘图线会呈直线;在 y 轴内使用时,则会形成一个同心圆。
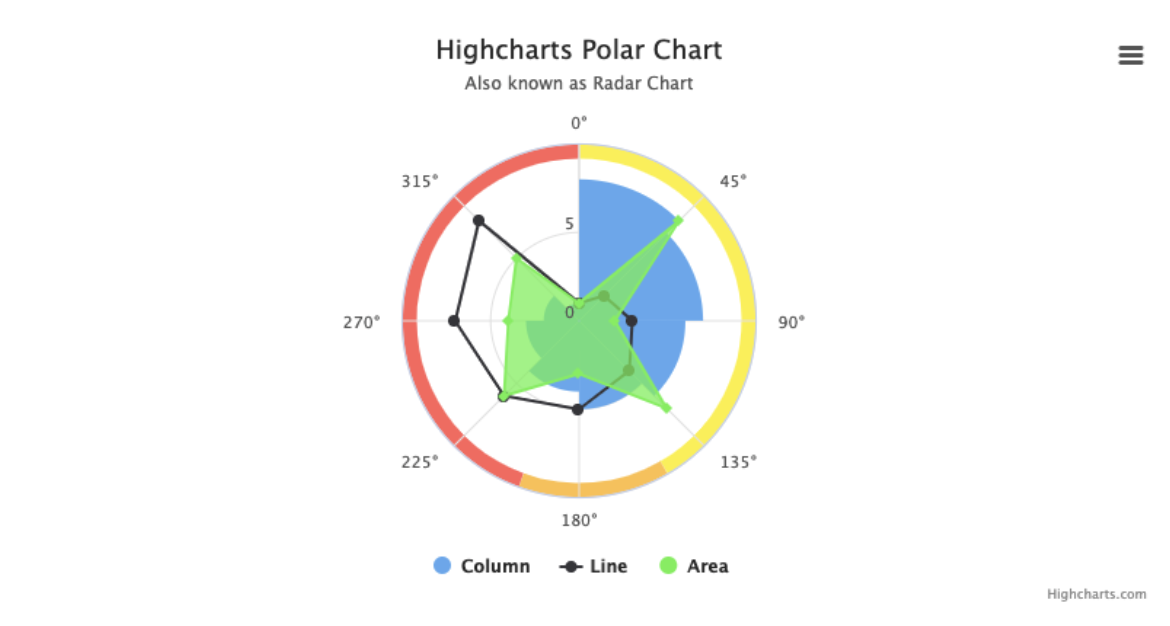
带状区域和绘制线条的示例
更多信息和示例请查阅Highcharts API 中的 plotBands, plotLines, addPlotBand 和 addPlotLine。