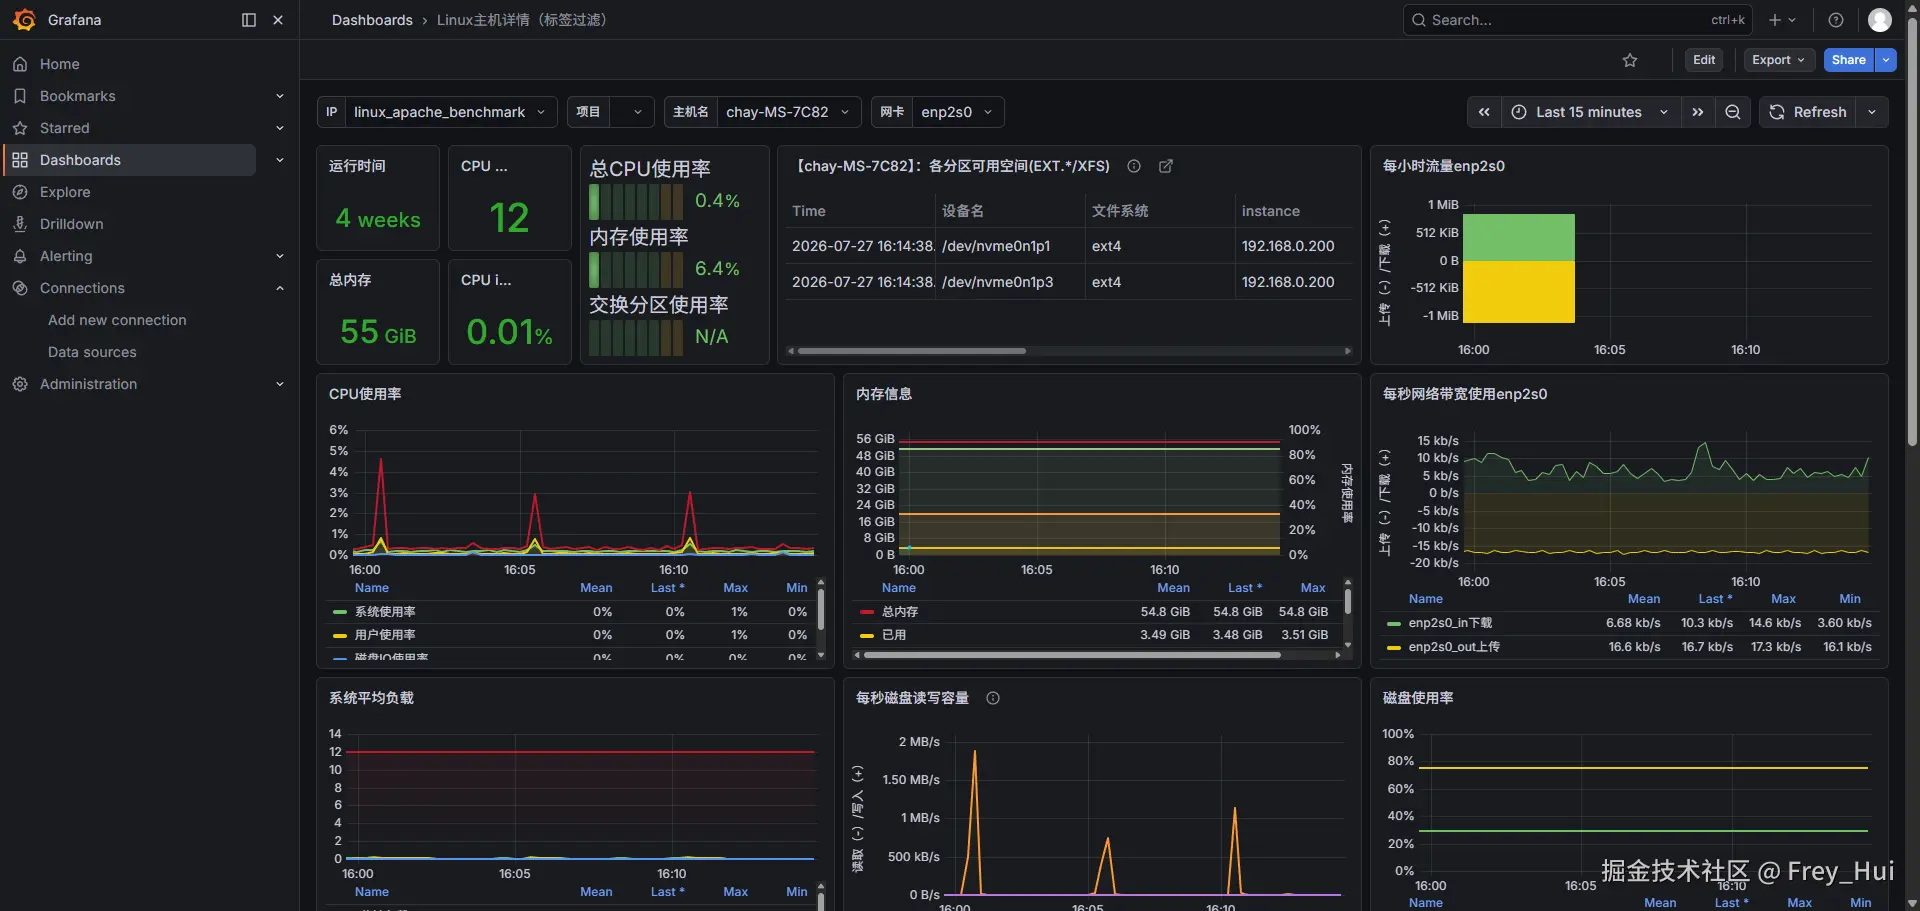
服务器资源监控之Grafana+Prometheus配置
一、前言
作为一位测试工程师,性能测试是必不可少的,在执行性能测试过程中,不管是压力测试、负载测试都会需要关注服务器资源指标,用于确定服务是否存在内存泄漏、资源抢占的情况,为了在进行性能测试时更加方便的监控服务器资源,需要搭建一套可通用的资源监控平台,本文将通过Grafana+Prometheus来搭建平台。
二、安装部署
本文使用docker容器部署Grafana+Prometheus,请提前安装好docker服务。
Prometheus
执行命令启动Prometheus服务:
bash
docker run -itd --name=prometheus -p 9090:9090 -v /etc/localtime:/etc/localtime:ro -v /etc/timezone:/etc/timezone:ro prom/prometheus启动完成后浏览器输入地址和端口,出现下图则表示服务运行正常。 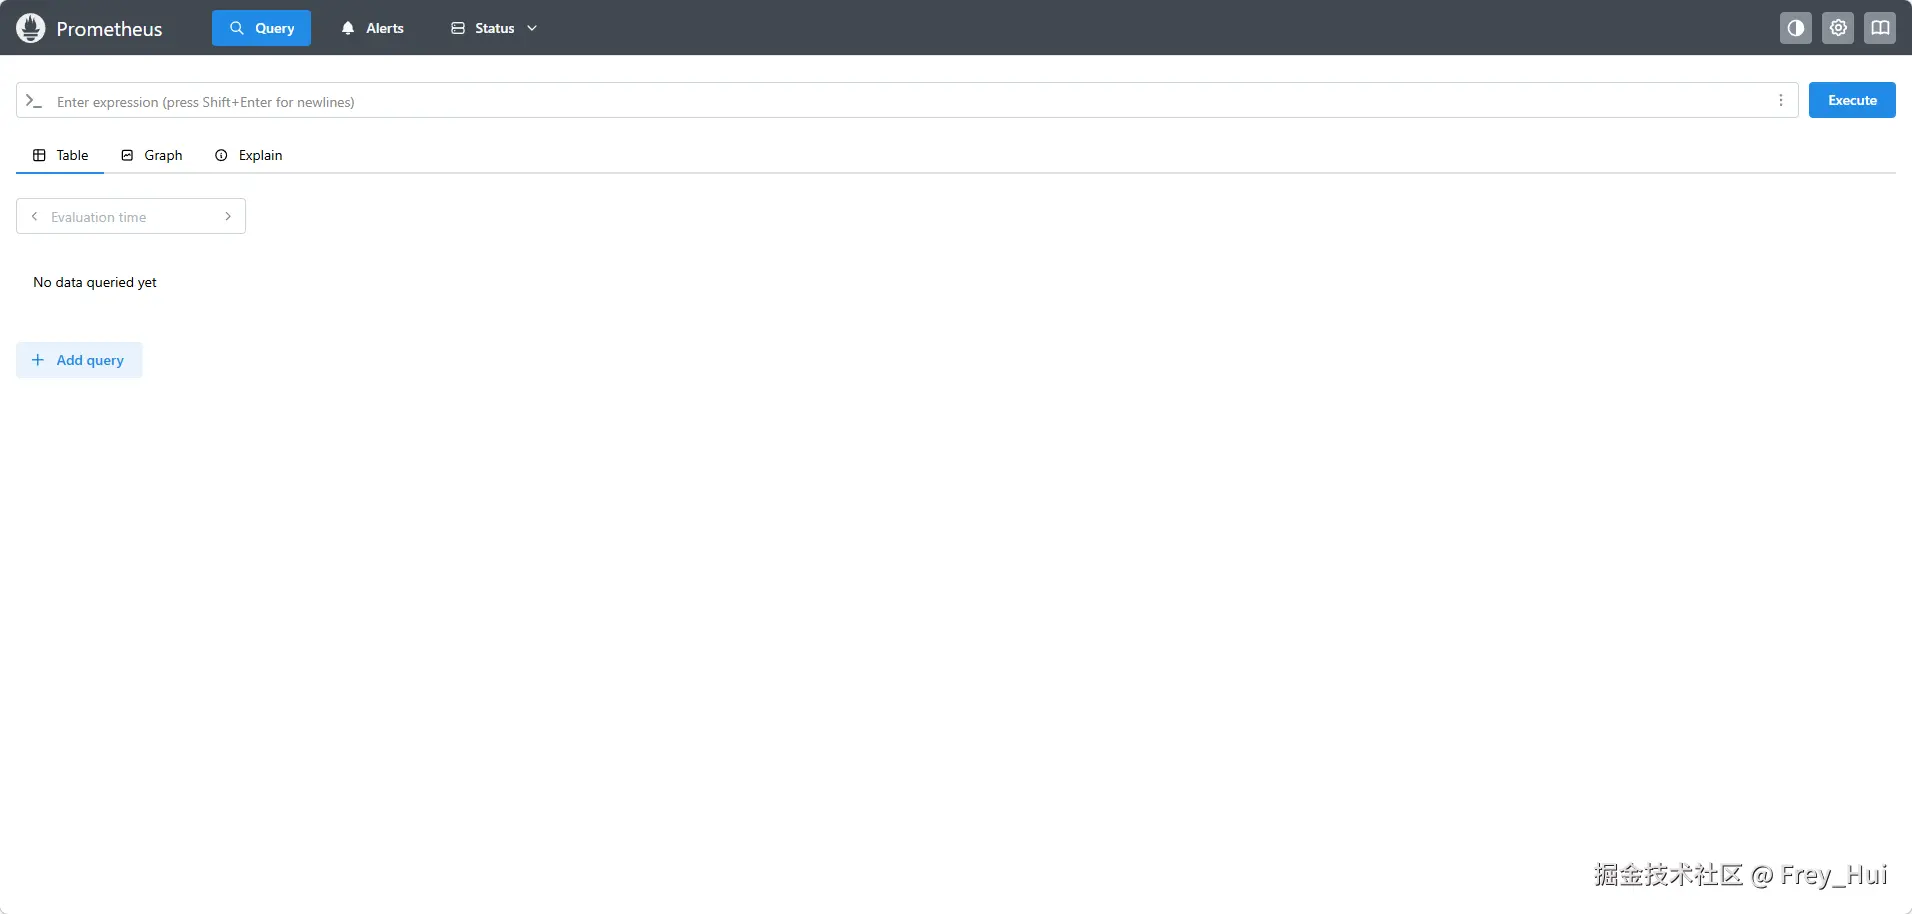
Grafana
执行命令启动Grafana服务:
bash
sudo docker run -itd --name=grafana -p 3000:3000 -v /datas/grafana-storage:/var/lib/grafana -v /etc/localtime:/etc/localtime:ro -v /etc/timezone:/etc/timezone:ro grafana/grafana注:/datas/grafana-storage 路径可根据情况修改本机路径,用于持久化grafana的数据。
启动完成后浏览器输入地址和端口,出现下图则表示Grafana服务运行正常。 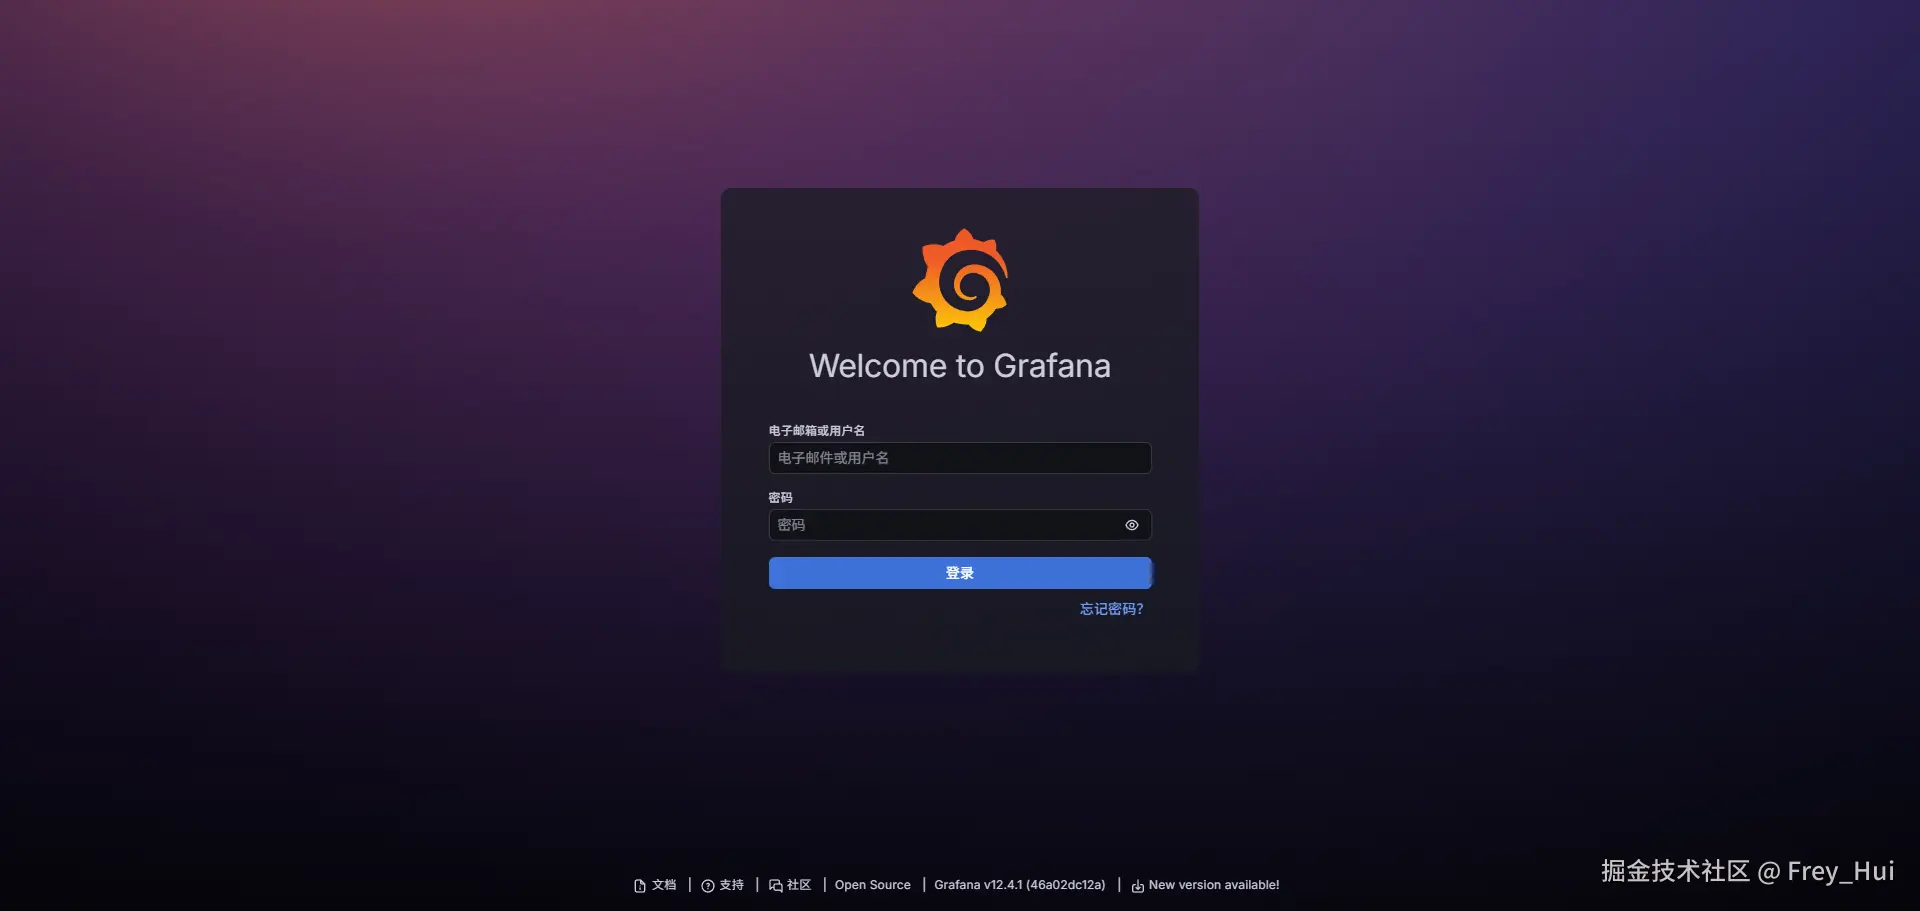 输入用户名和密码,默认:admin \ admin, 登录后可以修改密码,也可跳过不修改。
 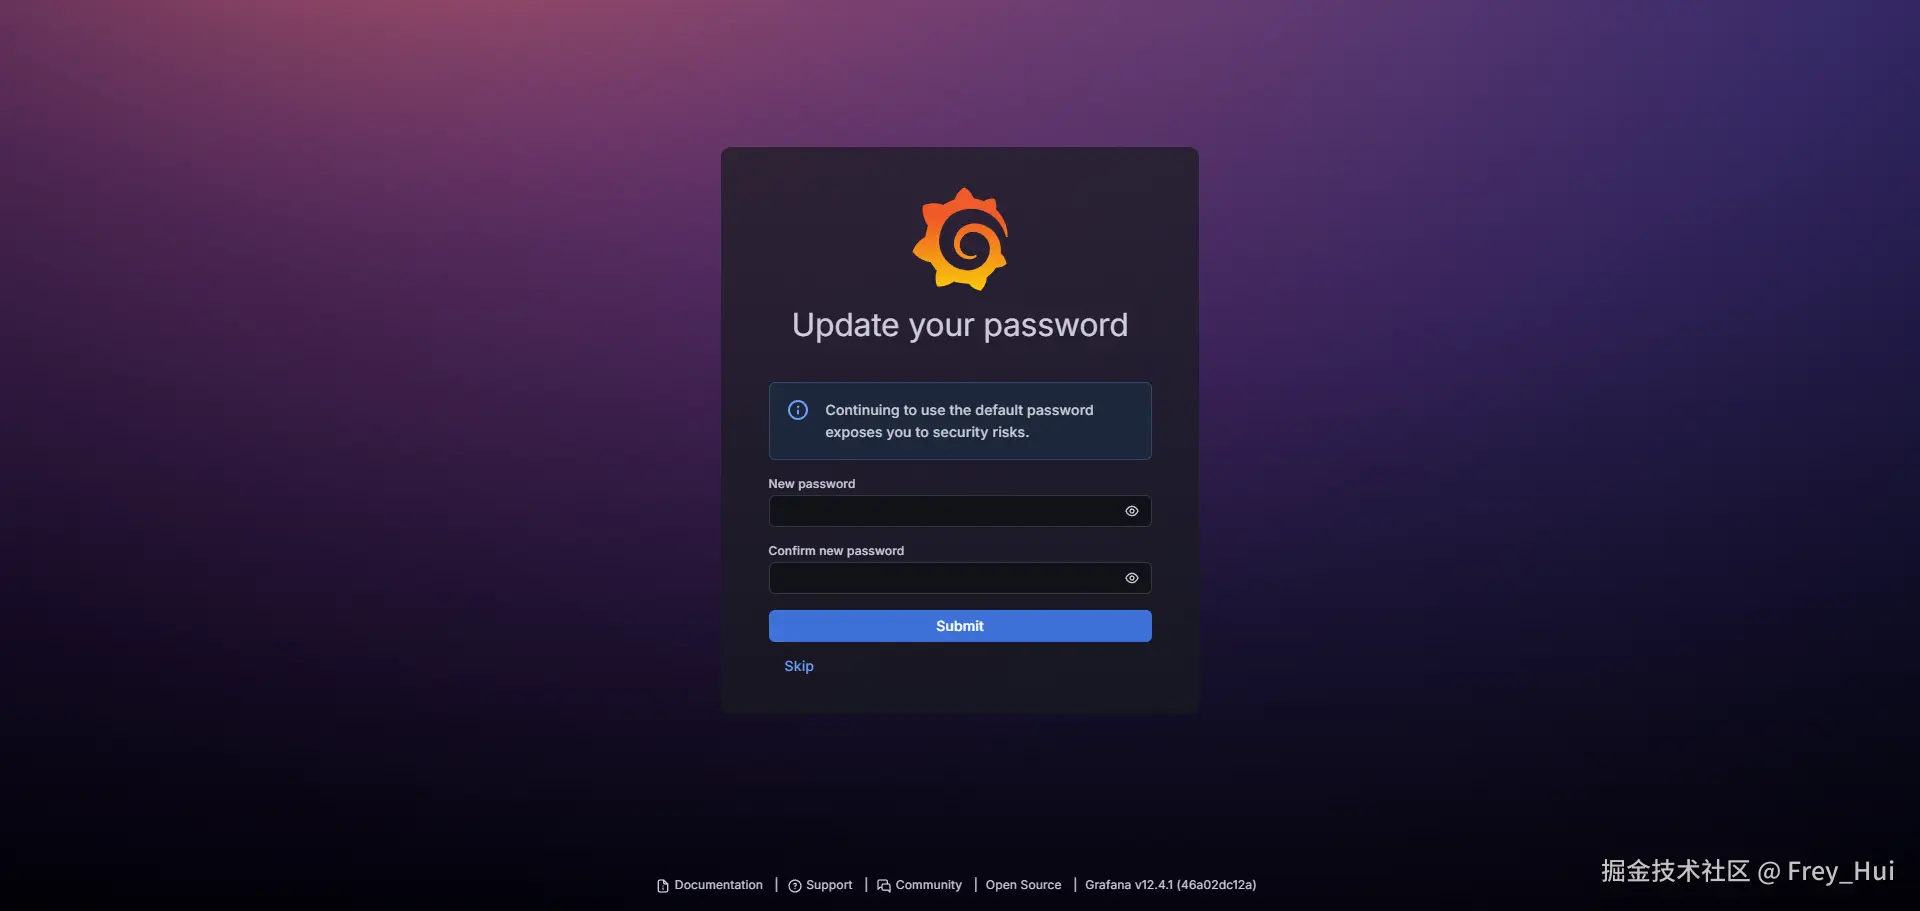 点击skip跳过,进入主界面。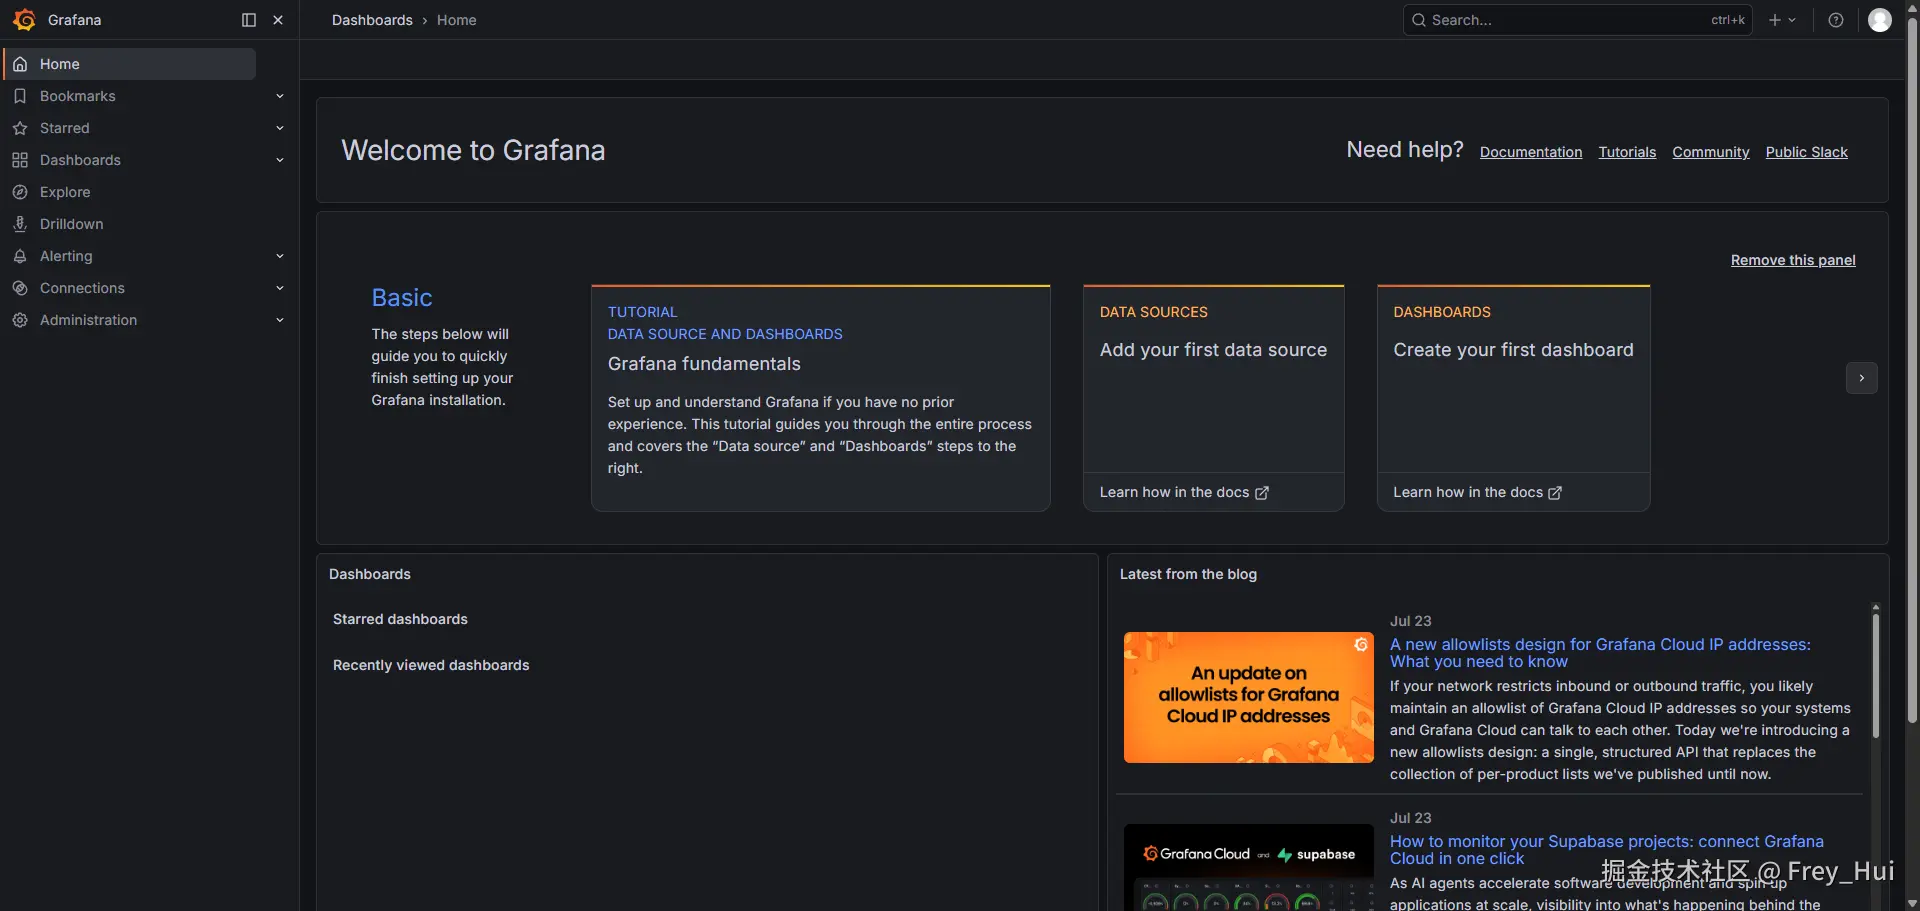
exporter监控程序
针对Windows和Linux系统需要下载不同的程序来进行资源提取与发送。 下载地址: windows_exporter node_exporter
- windows_exporter 根据当前系统平台下载程序(支持amd64、arm64)exe文件,在Windows服务器上新建一个文件夹windows_exporter,将exe放入文件夹下,再新建一个config.yml文件,内容如下:
yml
---
# Note this is not an exhaustive list of all configuration values
collectors:
    enabled: cpu,memory,net,os,process,service,system,logical_disk,cpu_info

collector:
    # 包含哪些需要监控的进程
    process:
        include: "httpd.*"

log:
    level: debug

web:
    listen-address: ":9182"
以上配置比较常规简单,如果需要更多配置信息,可查看官方说明。最后启动程序:
bat
D:\Software\windows_exporter\windows_exporter-0.31.3-amd64.exe --config.file=D:\Software\windows_exporter\config.yml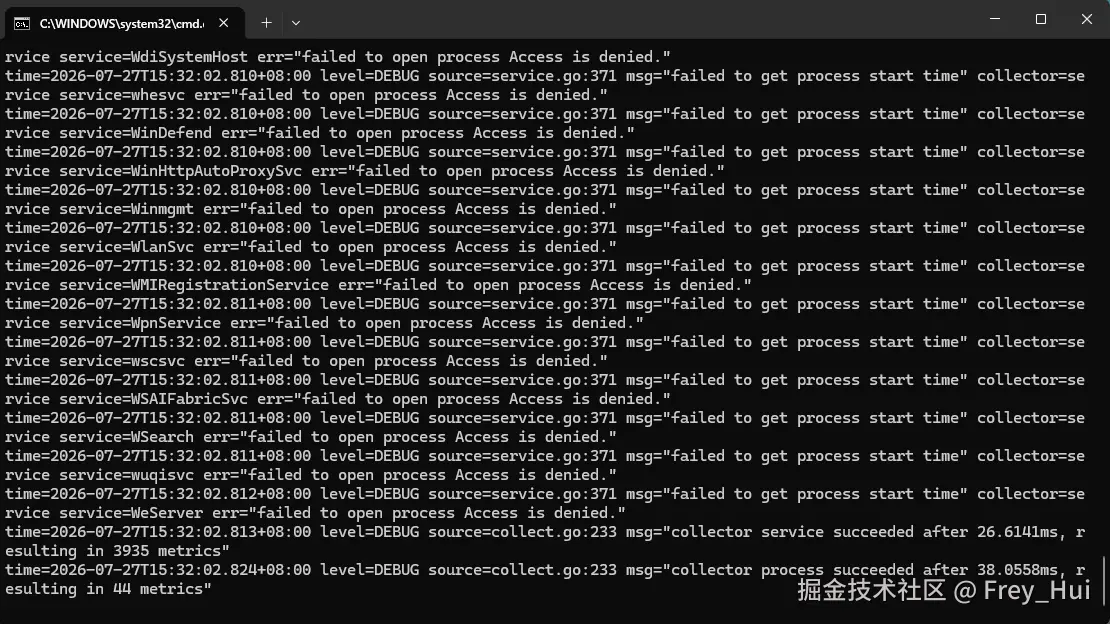 也可通过服务的方式在后台进行服务启动。
- node_exporter 根据系统平台下载程序,我们以amd64程序进行操作(node_exporter-1.11.1.linux-amd64.tar.gz),将文件放入需要监控的Linux系统并解压,启动程序:
bash
./node_exporter该命令支持命令参数,可通过-h查看参数配置,启动后默认端口:9100 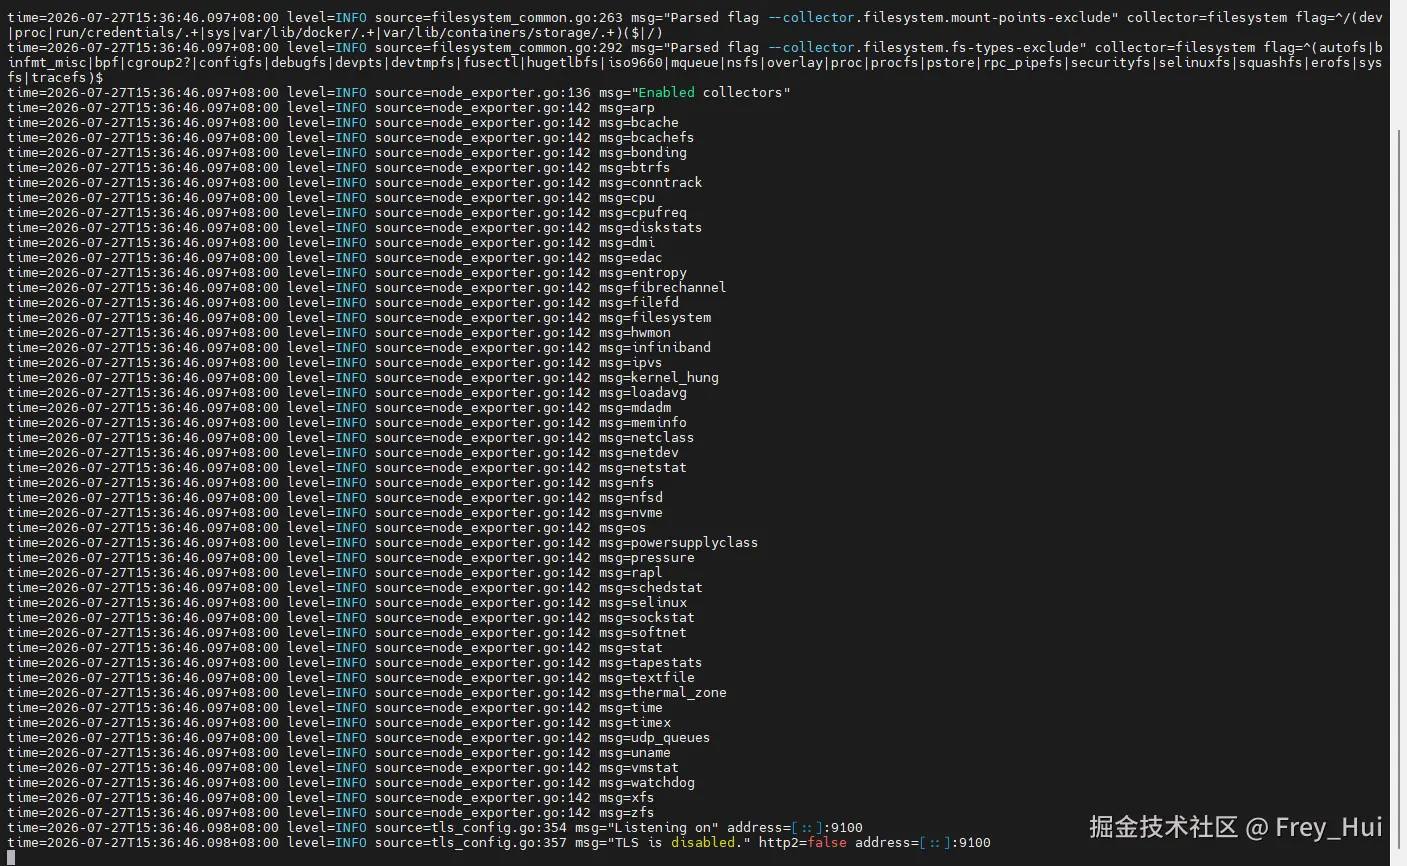
配置与模板
启动对应的服务器监控程序,需要在Prometheus中进行配置,才能接收到监控服务信息。回到Prometheus服务器上,新建文件prometheus.yml,修改内容如下:
yml
# my global config
global:
  scrape_interval: 15s # Set the scrape interval to every 15 seconds. Default is every 1 minute.
  evaluation_interval: 15s # Evaluate rules every 15 seconds. The default is every 1 minute.
  # scrape_timeout is set to the global default (10s).

# Alertmanager configuration
alerting:
  alertmanagers:
    - static_configs:
        - targets:
          # - alertmanager:9093

# Load rules once and periodically evaluate them according to the global 'evaluation_interval'.
rule_files:
  # - "first_rules.yml"
  # - "second_rules.yml"

# A scrape configuration containing exactly one endpoint to scrape:
# Here it's Prometheus itself.
scrape_configs:
  # The job name is added as a label `job=<job_name>` to any timeseries scraped from this config.
  - job_name: "prometheus"

    # metrics_path defaults to '/metrics'
    # scheme defaults to 'http'.

    static_configs:
      - targets: ["localhost:9090"]
        # The label name is added as a label `label_name=<label_value>` to any timeseries scraped from this config.
        labels:
          app: "prometheus"

  - job_name: "windows_apache_benchmark"
    static_configs:
      - targets: ['192.168.5.88:9182']
        labels:
          # 可以添加标签区分不同的压测环境
          instance: '192.168.5.88'

  - job_name: "linux_apache_benchmark"
    static_configs:
      - targets: ['192.168.0.200:9100']
        labels:
          instance: '192.168.0.200'
以上配置中总共配置了两台服务器,Windows和Linux分别各一台,配置对应的名称、服务地址,配置完成后保存文件,将文件拷贝到Prometheus容器中,执行命令:
bash
# 拷贝替换配置文件
docker cp prometheus.yml prometheus:/etc/prometheus/prometheus.yml

# 重启服务
docker restart prometheus
再次通过浏览器访问Prometheus服务地址,点击顶部Status下拉菜单,点击Target health,能看到已被监控的两台服务器信息,说明已正常配置监控数据。 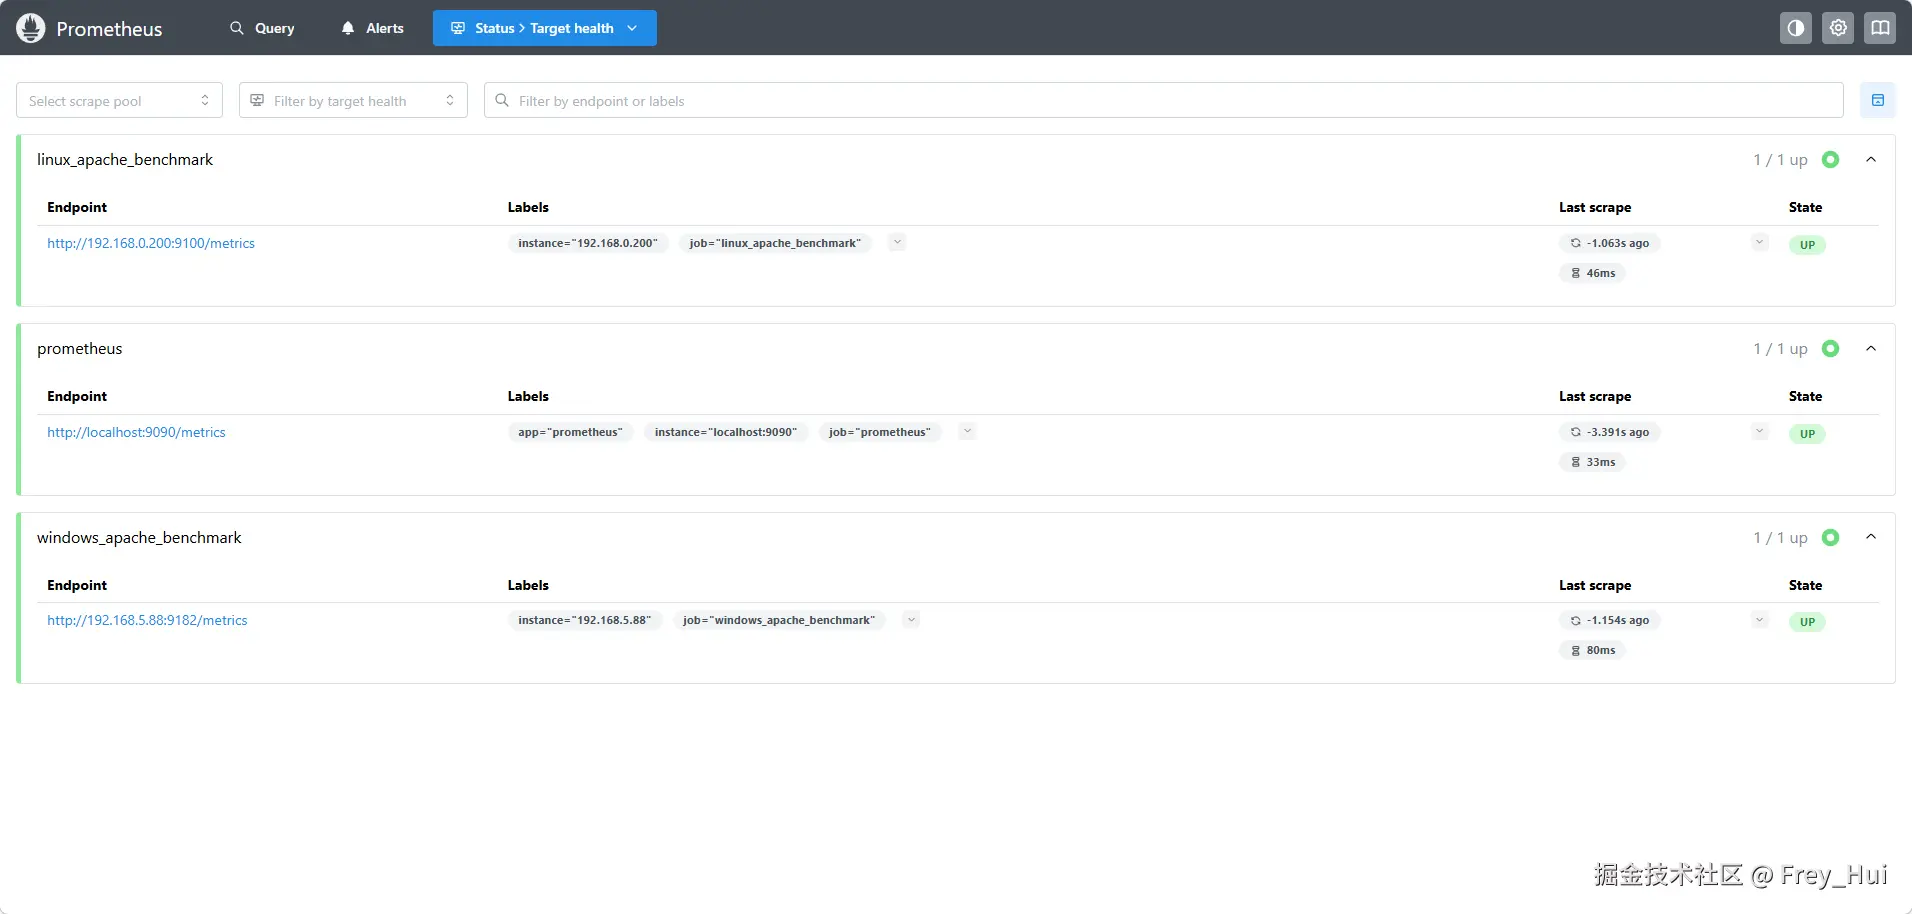 进入Grafana首页,点击Data Sources,点击Add data source进入添加数据源界面
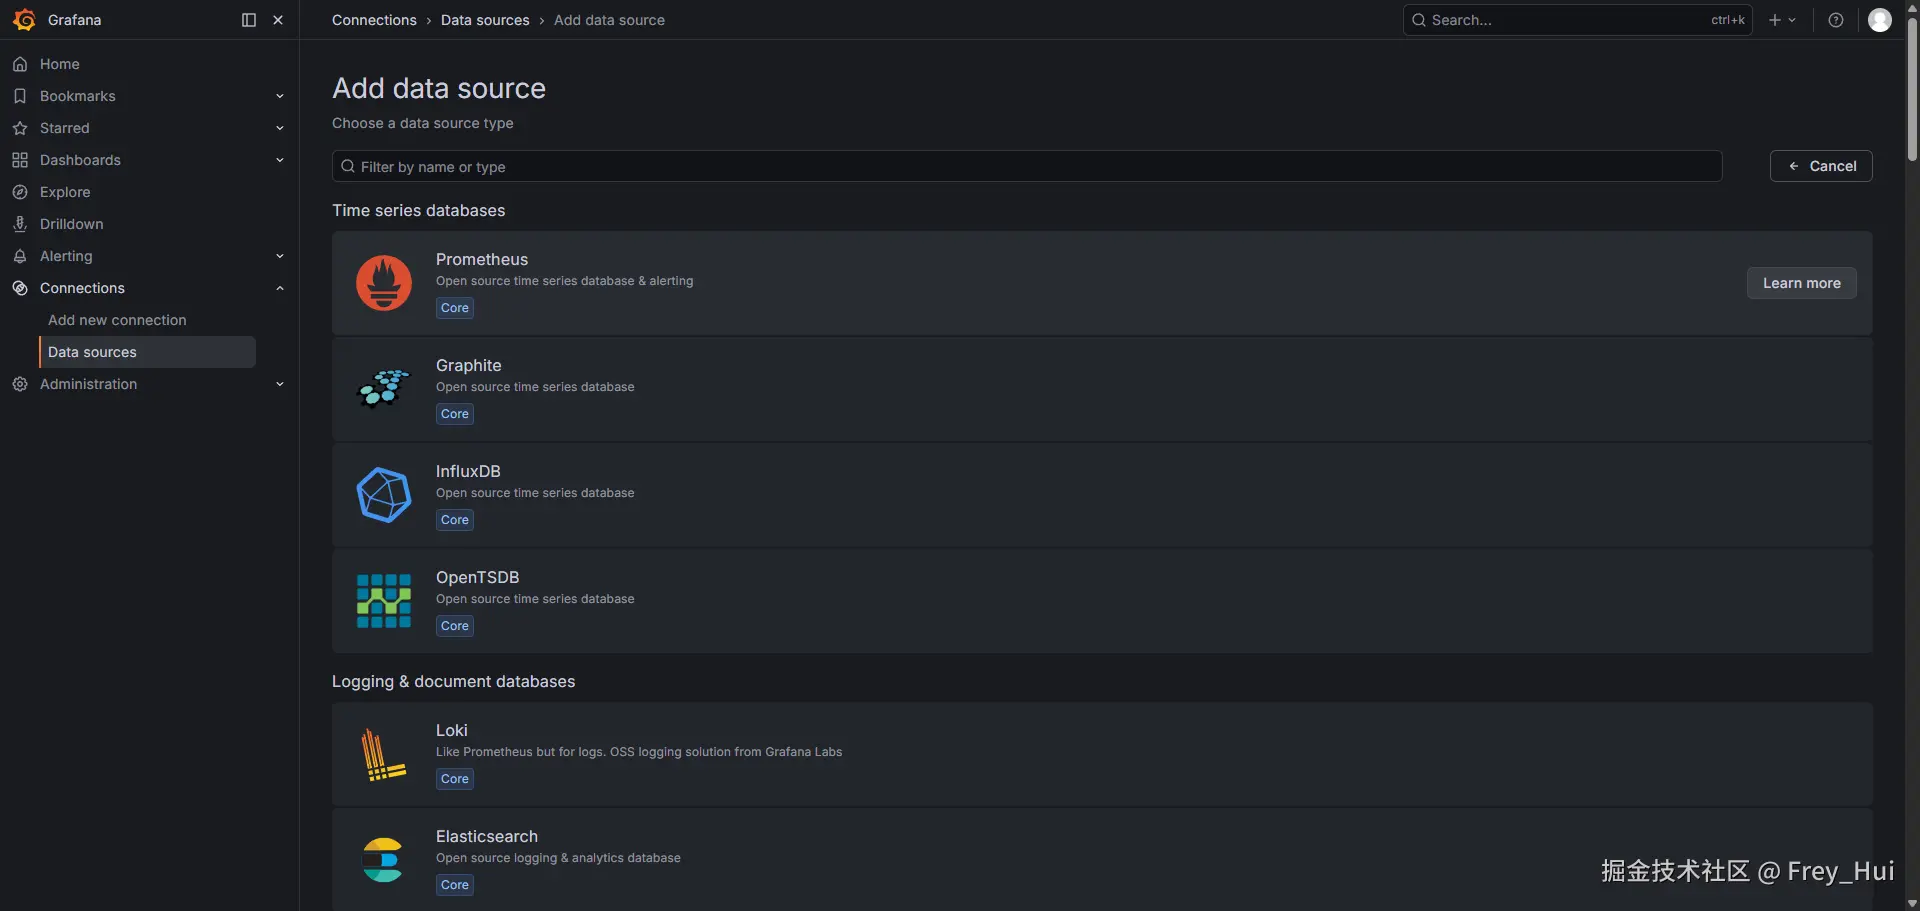
 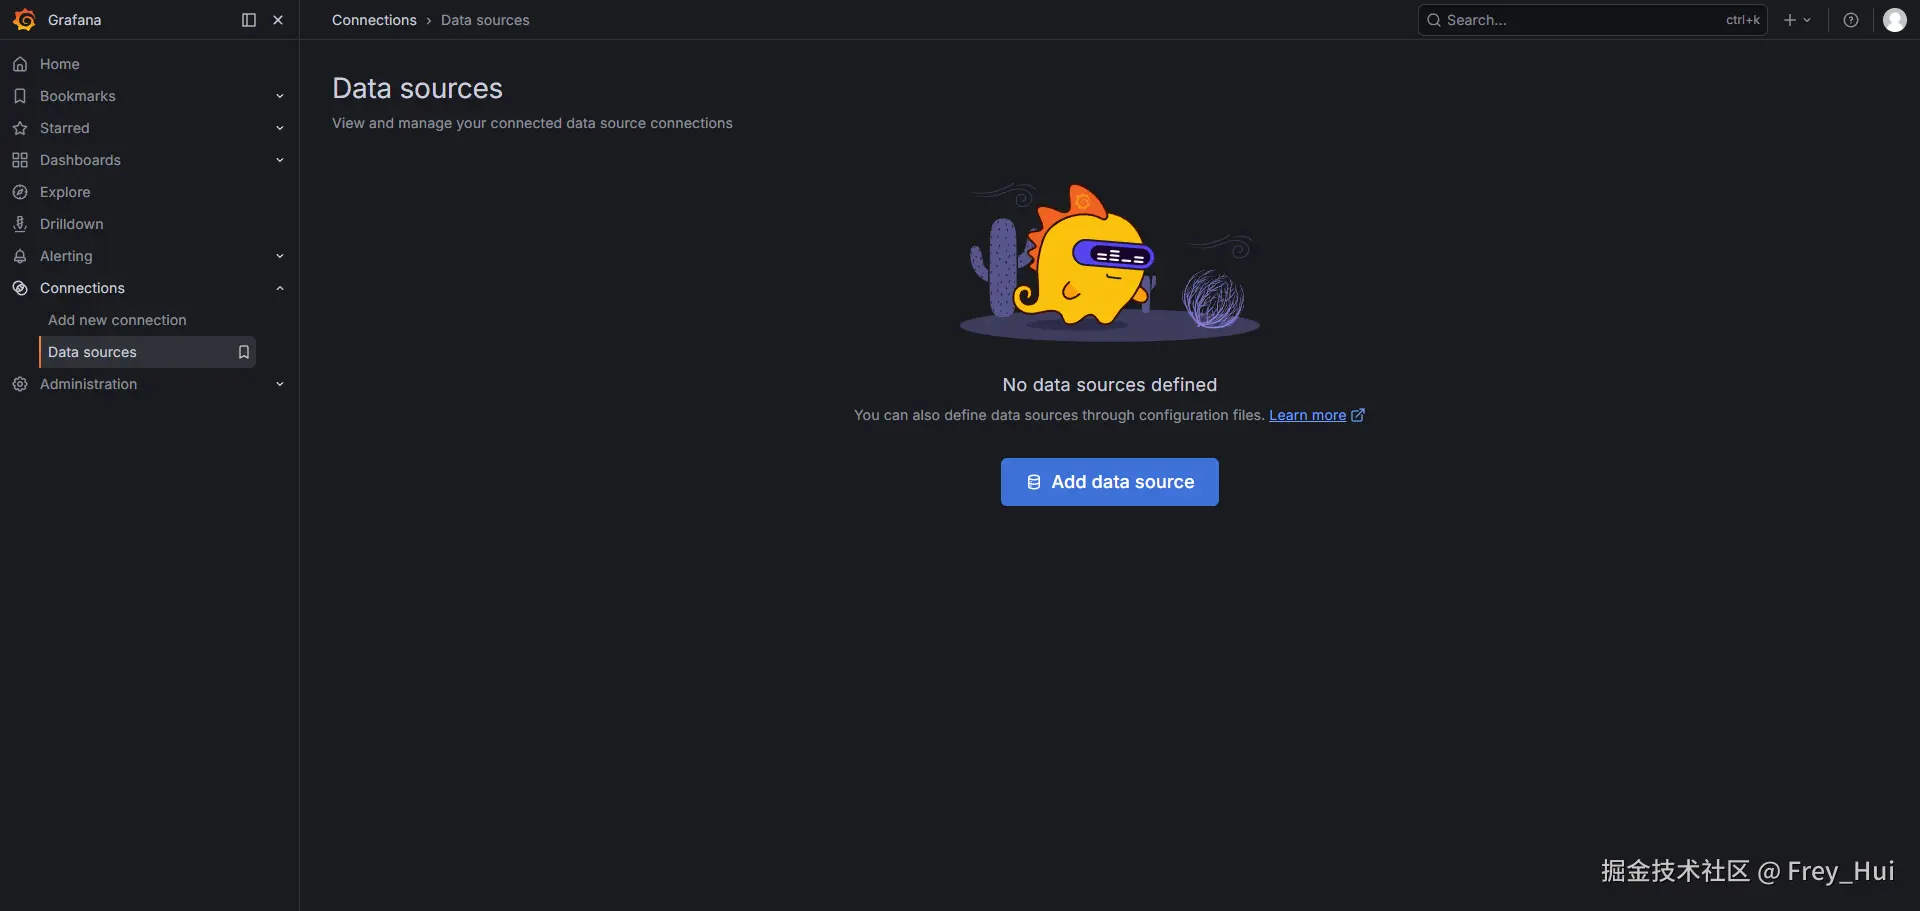 选择Prometheus
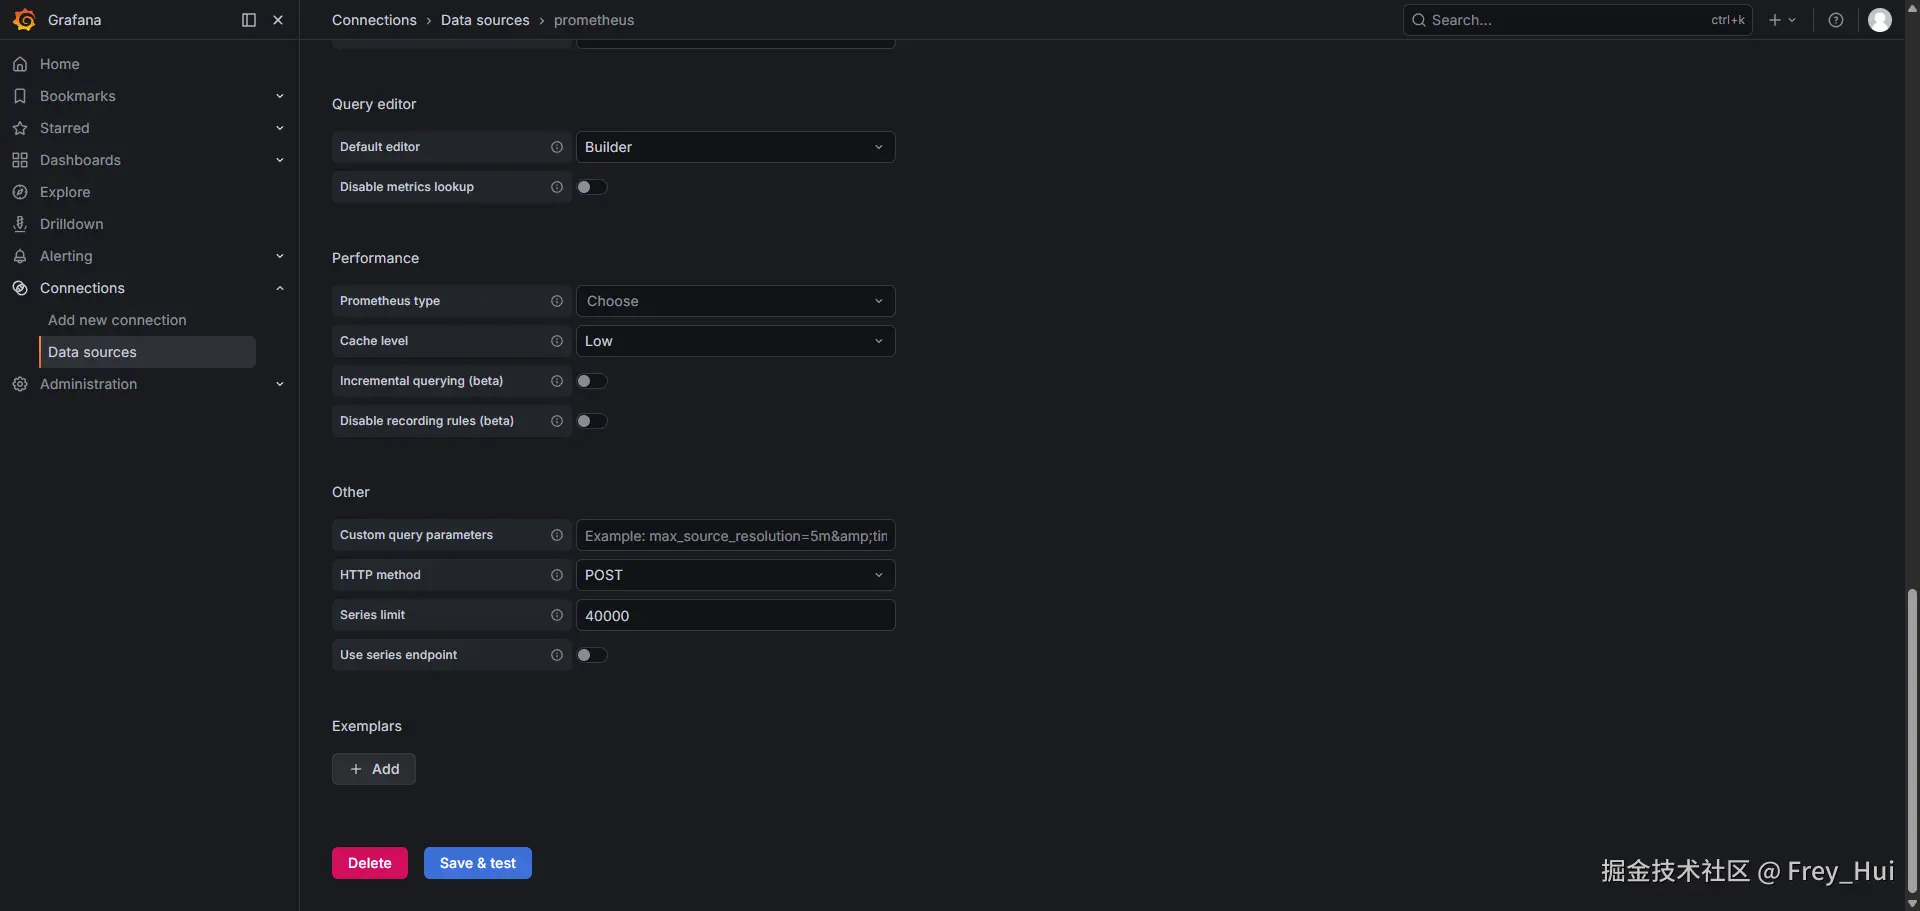
  填写Prometheus服务地址,互动到底部,点击【保存并测试】,看是否正常连接,如果连接正常则配置数据源成功。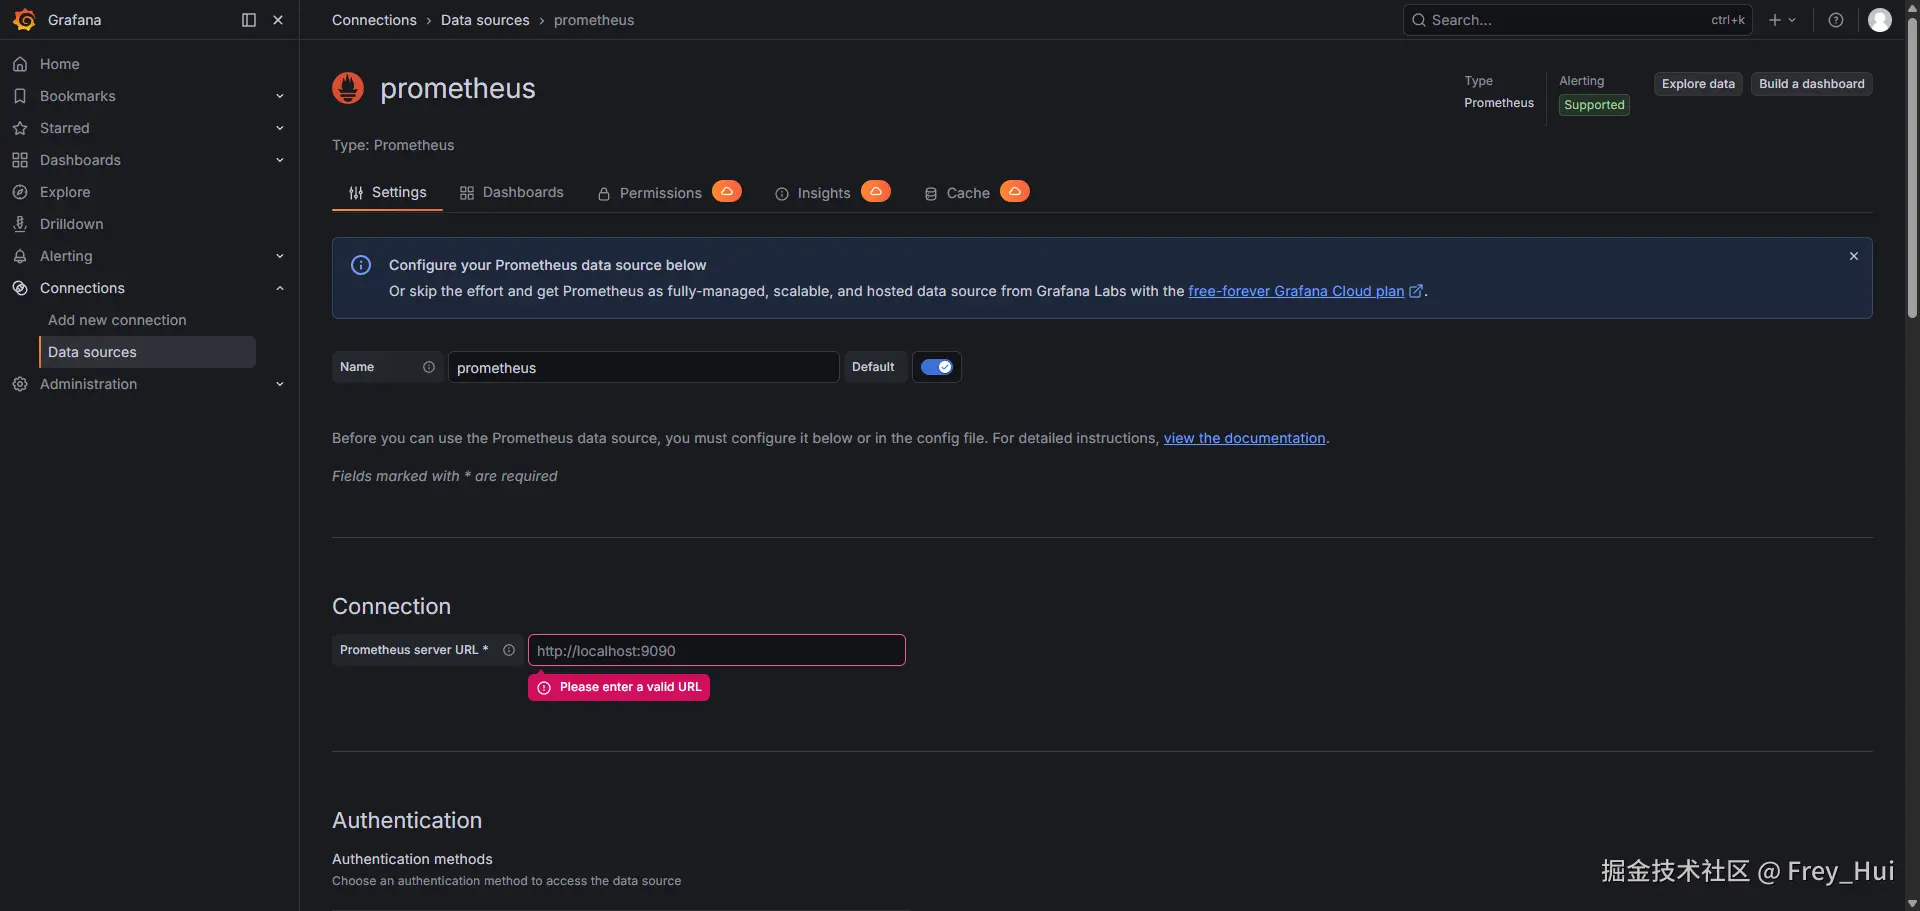
 点击左侧Dashboards,点击Create dashboard
 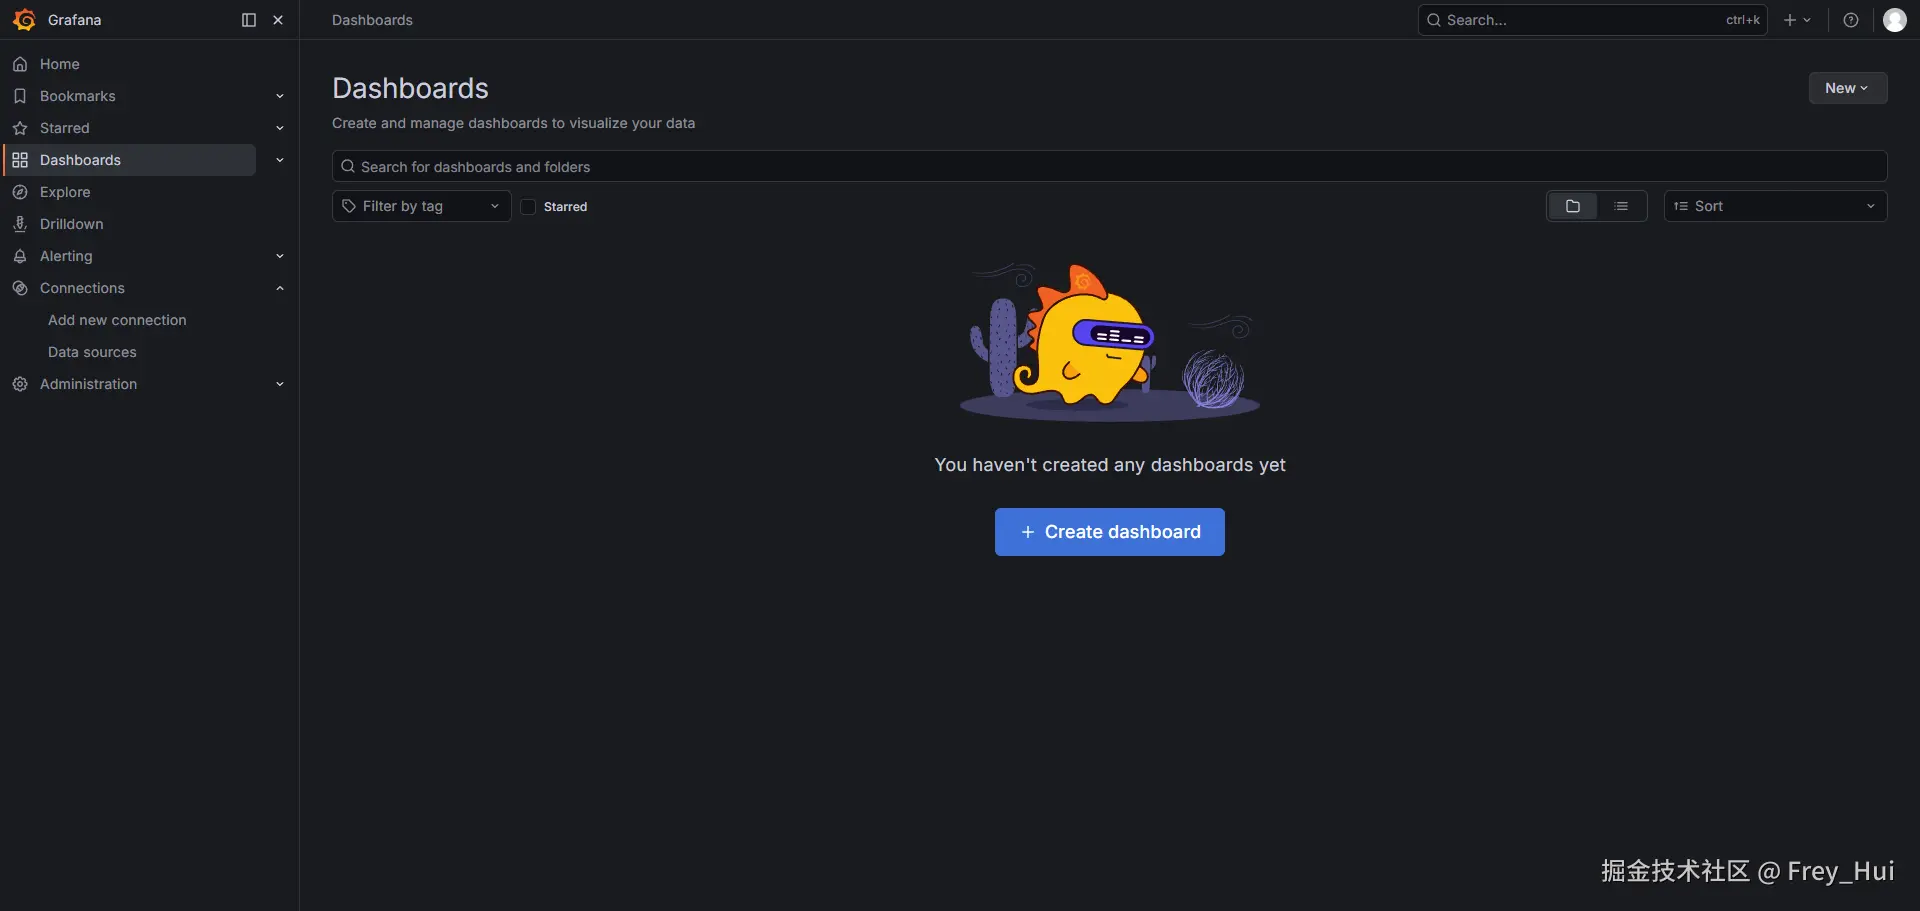 点击Import dashboard
 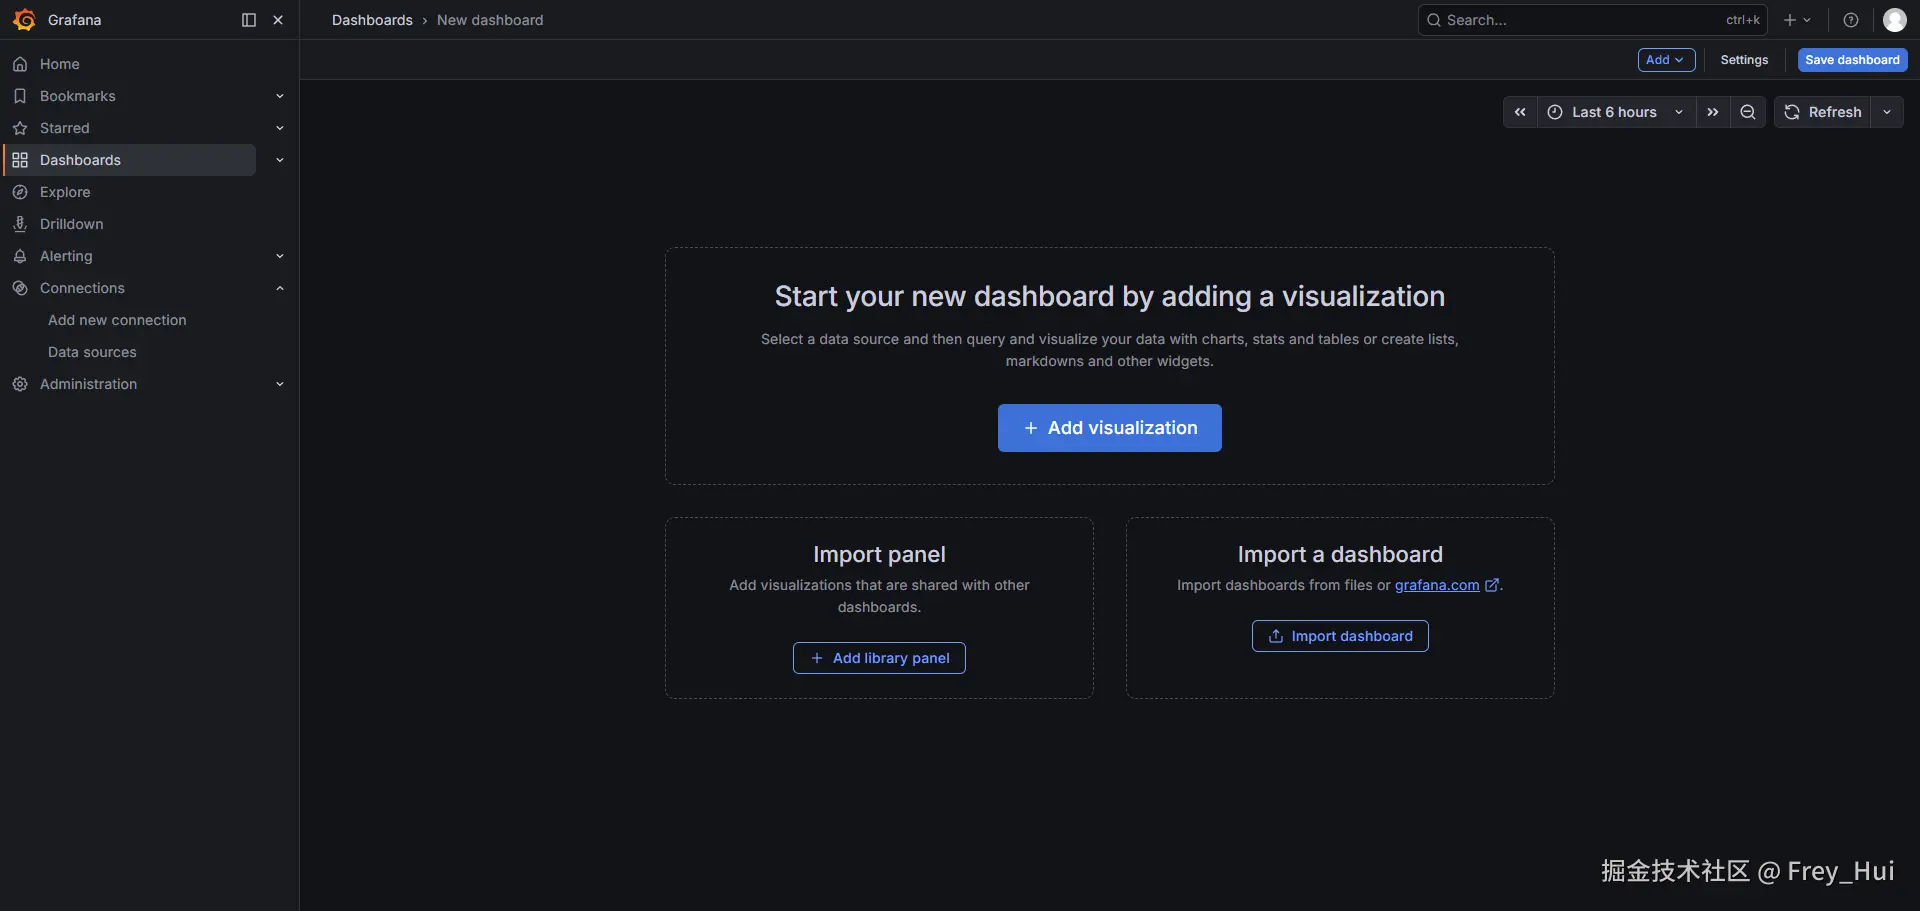 输入模板ID:24390,点击Load,在DS_PROMETHEUS_MSP下拉选项中选择上一步添加的Prometheus数据源,点击Import可查看到服务器数据。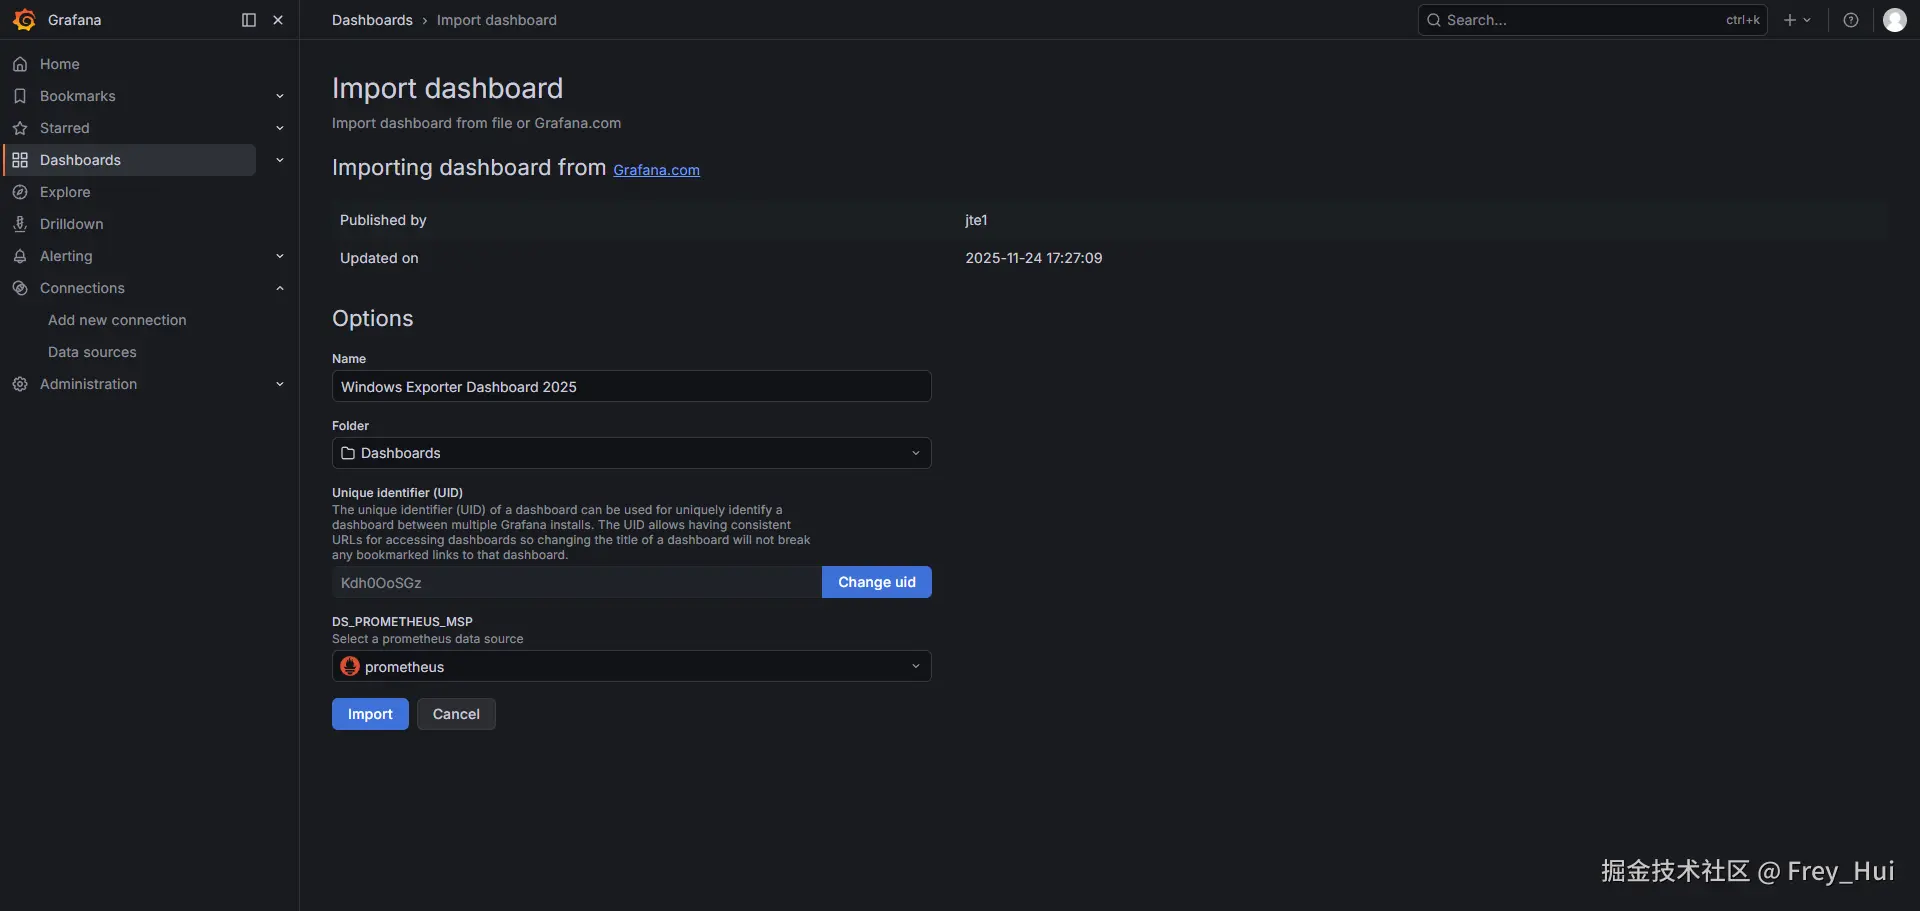
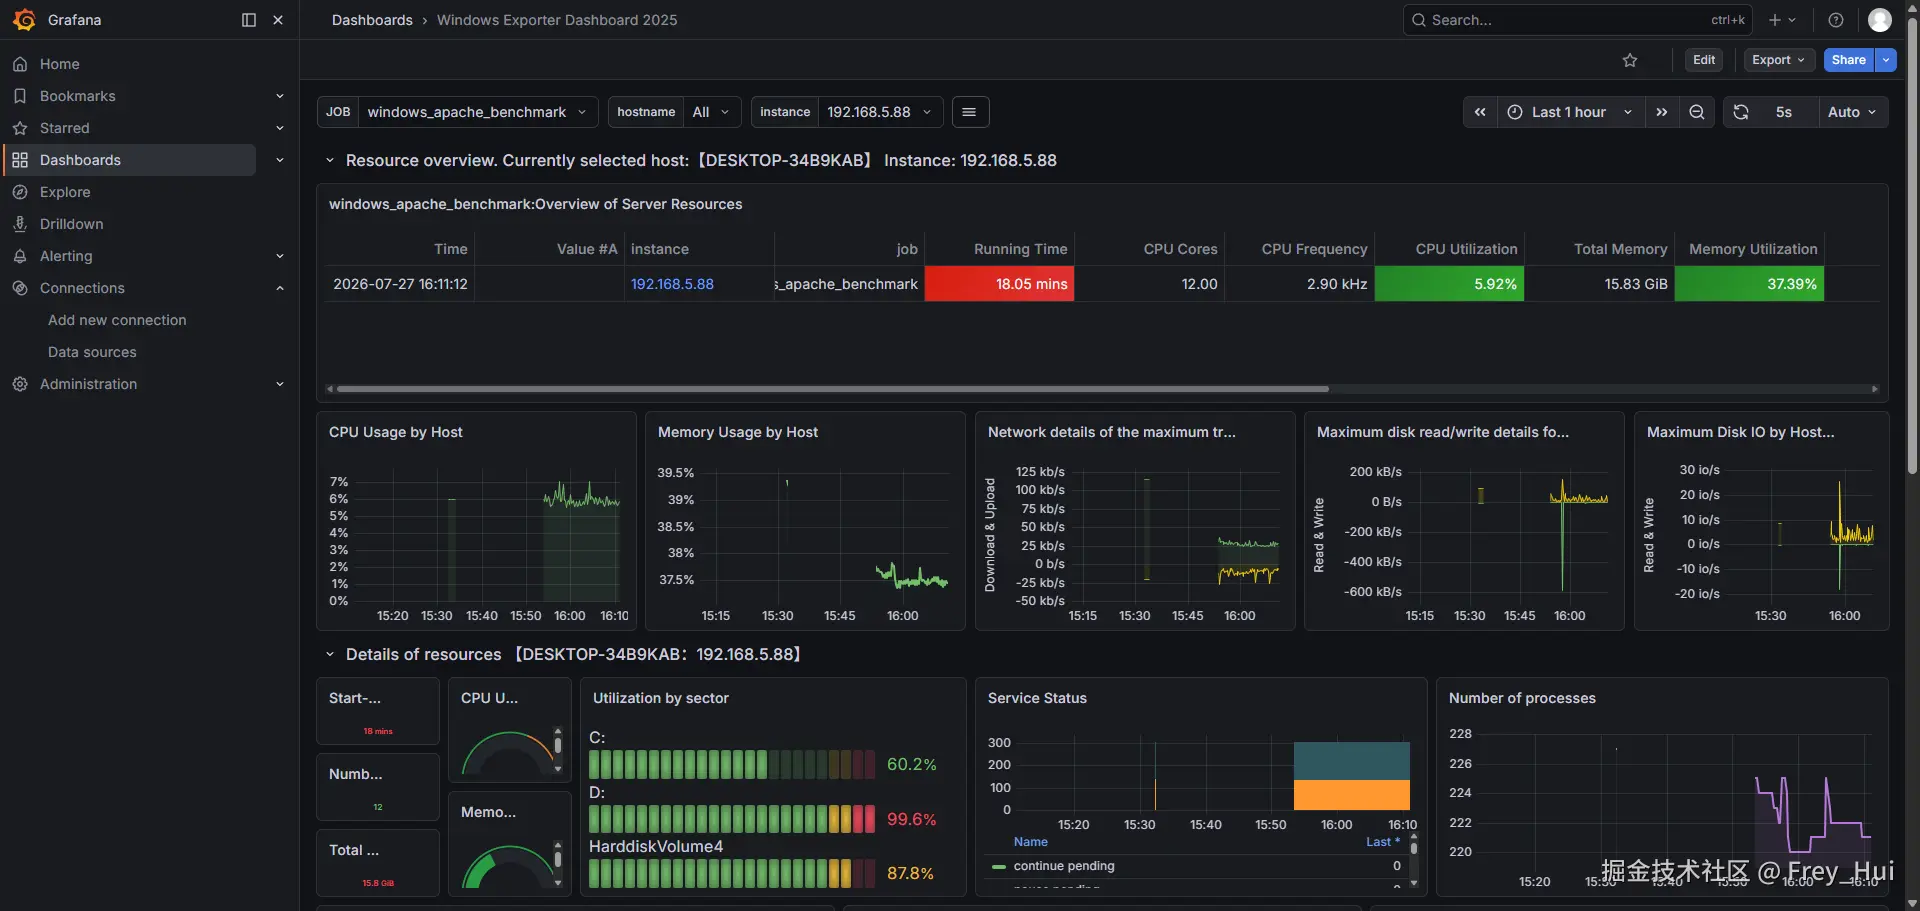 Linux 也是一样,只是使用的模板ID:21902。