适用场景:景区规划图、园区平面图、户型图、电力/管网示意图等只有图片、没有经纬度的"底图标绘"需求。
前言
在很多业务里,我们手里只有一张不带任何坐标系的规划图/平面图 (比如本文用的《桃花岭景区自行车道规划图》),但需要在这张图上让用户自由标注点、画线、圈面、框矩形 ,还要能二次导出成 GeoJSON 进库(例如落进 PostGIS 的 geometry 字段)。
对这种"无空间参考"的图,标准做法是用 Leaflet 的 L.CRS.Simple(平面像素坐标系),再配合 leaflet-draw 做交互式标绘。本文完整给出可运行的 HTML、关键代码拆解,以及一个极易踩坑的导出坑 (leaflet-draw 1.0.4 根本没有 toGeoJSON 方法)。
一、基础回顾:L.CRS.Simple 坐标约定
L.CRS.Simple 是一套没有投影、单位就是像素 的直角坐标系。图片按原始像素尺寸加载,不做任何经纬度换算。
1.1 图片 bounds 与 y 轴翻转
Leaflet 的地图坐标 y 轴向上为正 ,而图片像素 y 轴向下为正 。因此用 imageOverlay 加载时,bounds 的 y 要取负值,保证图面方向正确:
javascript
// 图片像素尺寸(1920 x 1356)
const IMG_W = 1920, IMG_H = 1356;

// L.CRS.Simple:无空间参考的平面直角坐标系(单位 = 像素)
// y 轴向上为正,因此 bounds 的 y 取负值,保证图片显示方向正确
const bounds = L.latLngBounds([
  [ -IMG_H, 0 ],      // 图片左下角(y 翻转)
  [ 0, IMG_W ]        // 图片右上角
]);一句话记忆:图片像素
(px, py)在地图里就是latLng(-py, px),即x = 像素横坐标,y = -像素纵坐标。后面导出 GeoJSON 的坐标[lng, lat] = [px, -py]就是这么来的。
1.2 初始化地图 + 加载图片
javascript
// 图片中心点(CRS.Simple 坐标系),旋转始终绕该点进行
const IMAGE_CENTER = bounds.getCenter();

const map = L.map('map', {
  crs: L.CRS.Simple,          // 无空间参考坐标系
  rotate: true,               // 开启旋转能力(leaflet-rotate 插件)
  bearing: 0,                 // 初始旋转角
  minZoom: -3,
  maxZoom: 4,
  zoomSnap: 0.25,             // 平滑缩放
  zoomDelta: 0.5,
  attributionControl: false
});

// 以图片方式加载规划图(ImageOverlay,不做任何投影变换)
L.imageOverlay('taohualing.jpg', bounds, {
  interactive: true,
  className: 'plan-img'
}).addTo(map);

map.fitBounds(bounds, { padding: [20, 20] });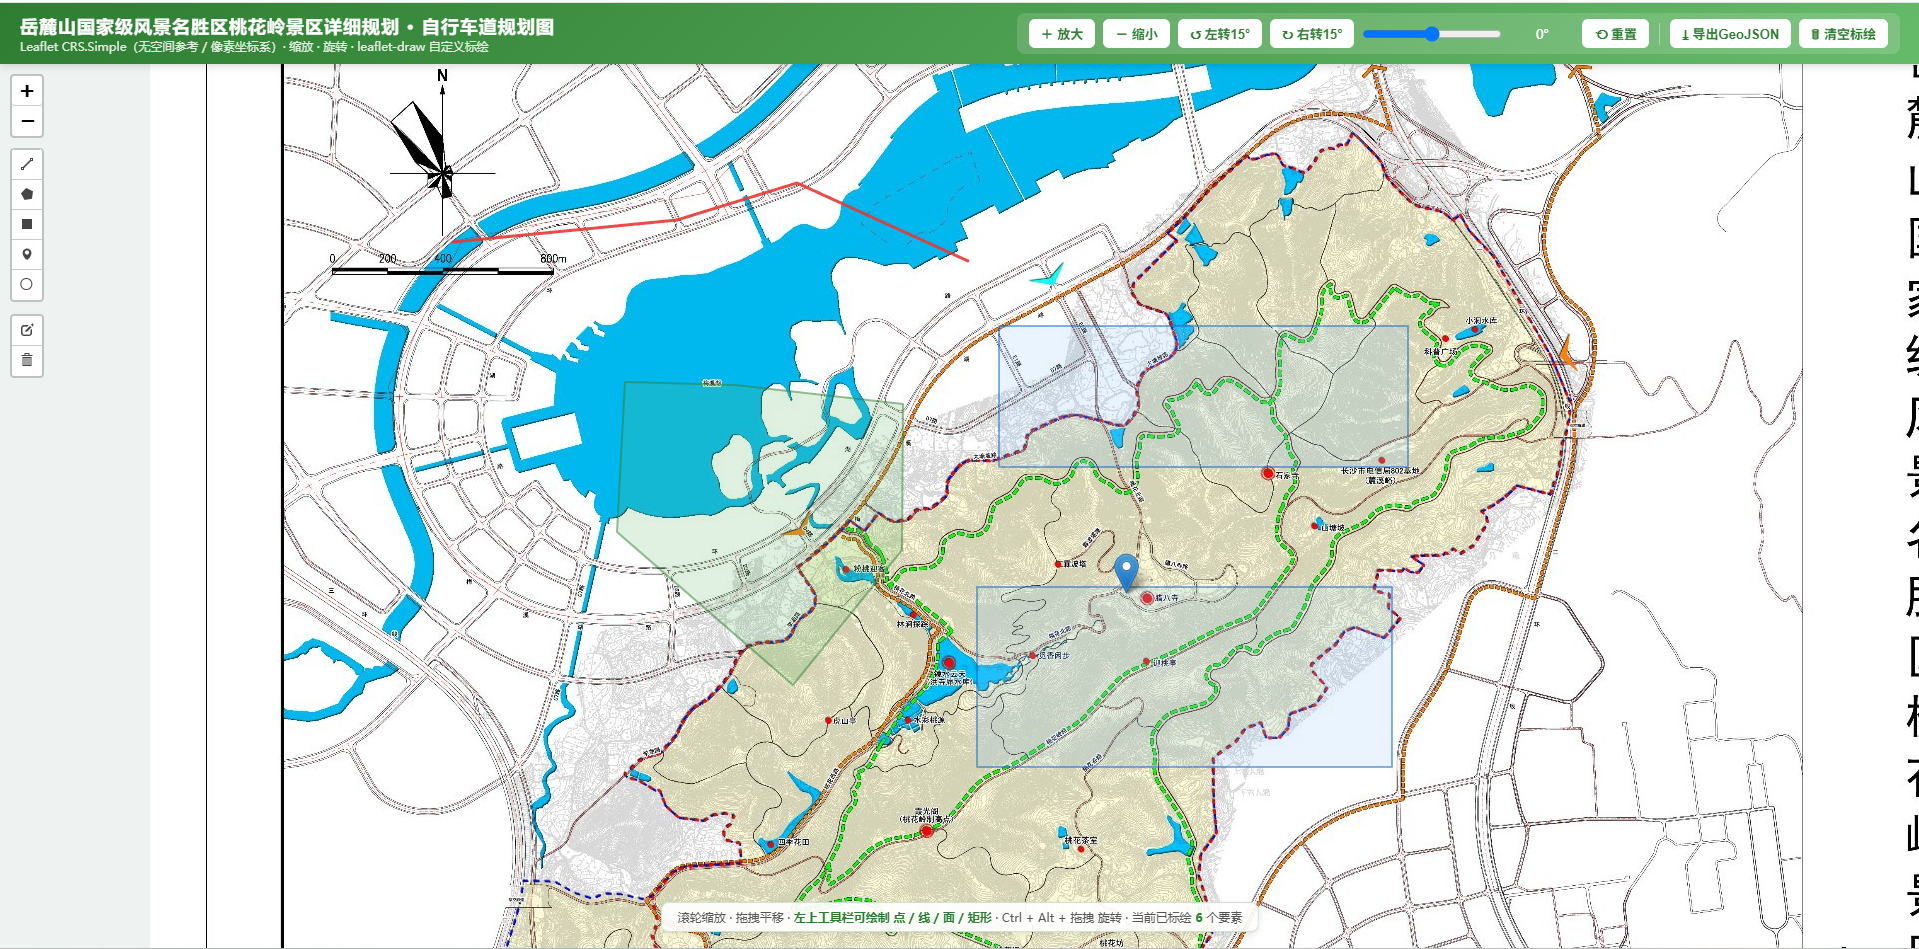
📷 图1 初始全图
侧边工具栏按钮 + 底栏信息条 + 规划图底图初始画面
二、集成 leaflet-draw:绘制工具栏
引入 leaflet-draw 的 css/js(注意版本 1.0.4 ,与 Leaflet 1.9.4 搭配),再用 L.Control.Draw 挂上绘制控件。
2.1 兼容性关键点(必看)
leaflet-draw 1.0.4 与 Leaflet ≥ 1.8 有两个已知坑,不处理会直接报错/破图:
- 矩形/多边形默认会自动计算面积 (
showArea: true),而面积计算依赖真实米制距离 ------ 在L.CRS.Simple下没有真实距离单位,1.8+ 会抛错。→ 必须showArea: false。 - "圆(按米)"无意义 :
circle的半径是真实距离,像素坐标系下画出来的圆会失真。→ 直接circle: false关闭。 - marker 默认图标破图 :显式指定 CDN 的
marker-icon图标,避免默认图标请求失败。
html
<link rel="stylesheet" href="https://unpkg.com/leaflet-draw@1.0.4/dist/leaflet.draw.css">
...
<script src="https://unpkg.com/leaflet-draw@1.0.4/dist/leaflet.draw.js"></script>
javascript
// 存放所有用户绘制的要素,编辑/删除/导出都基于它
const drawnItems = new L.FeatureGroup();
map.addLayer(drawnItems);

const drawControl = new L.Control.Draw({
  position: 'topleft',
  draw: {
    circle: false,          // CRS.Simple 没有真实距离单位,关闭"圆(按米)"
    marker: {
      icon: new L.Icon({
        iconUrl: 'https://unpkg.com/leaflet@1.9.4/dist/images/marker-icon.png',
        iconRetinaUrl: 'https://unpkg.com/leaflet@1.9.4/dist/images/marker-icon-2x.png',
        shadowUrl: 'https://unpkg.com/leaflet@1.9.4/dist/images/marker-shadow.png',
        iconSize: [25, 41], iconAnchor: [12, 41], popupAnchor: [1, -34]
      })
    },
    polyline: { shapeOptions: { color: '#e53935', weight: 3, opacity: .9 } },
    // showArea:false ------ 关键:关闭面积自动计算,规避 leaflet-draw 1.0.4 在 Leaflet≥1.8 下的报错
    polygon:  { showArea: false, shapeOptions: { color: '#2e7d32', weight: 2, fillColor: '#66bb6a', fillOpacity: .2 } },
    rectangle:{ showArea: false, shapeOptions: { color: '#1565c0', weight: 2, fillColor: '#90caf9', fillOpacity: .2 } }
  },
  edit: {
    featureGroup: drawnItems,   // 必须:编辑/删除作用于此图层组
    remove: true
  }
});
map.addControl(drawControl);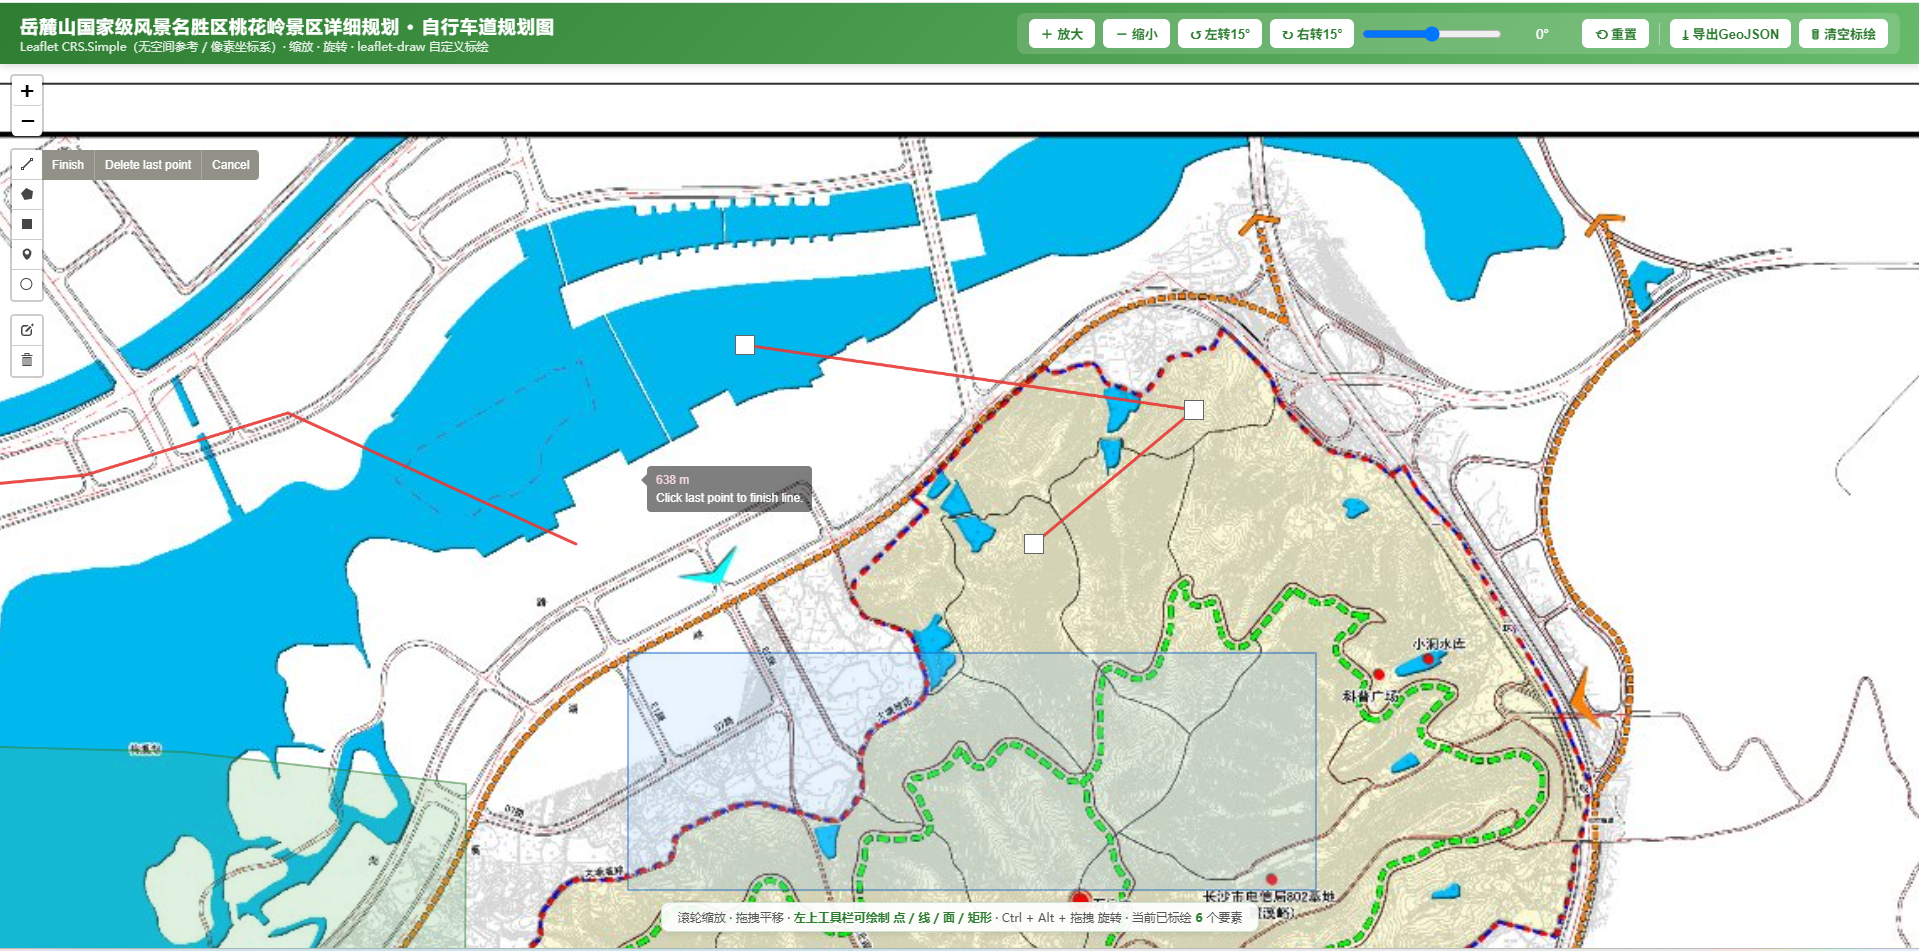
📷 图2 绘制工具栏
左上角 leaflet-draw 工具:点 / 线 / 面 / 矩形 / 编辑 / 删除
2.2 四种绘制工具说明
| 工具 | 对应图层 | 导出 GeoJSON 类型 | 说明 |
|---|---|---|---|
| 点 marker | L.Marker |
Point |
自定义标注点,点击落点 |
| 线 polyline | L.Polyline |
LineString |
连续点击画折线,双击/回车结束 |
| 面 polygon | L.Polygon |
Polygon |
连续点围成闭合区域 |
| 矩形 rectangle | L.Rectangle(继承自 Polygon) |
Polygon |
拖拽两对角点生成矩形 |
三、事件处理:创建 / 编辑 / 删除
leaflet-draw 通过 L.Draw.Event 派发事件,我们监听 CREATED / EDITED / DELETED 三个事件,把新图层加入 drawnItems 并刷新计数。
javascript
// 创建 / 编辑 / 删除 事件
map.on(L.Draw.Event.CREATED, function (e) {
  const layer = e.layer;
  const type = e.layerType;
  if (type === 'marker') {
    layer.bindPopup('自定义标注点');
  } else if (type === 'polyline') {
    layer.bindPopup('自定义线');
  } else {
    layer.bindPopup('自定义面');
  }
  drawnItems.addLayer(layer);
  updateCount();
});
map.on(L.Draw.Event.EDITED, updateCount);
map.on(L.Draw.Event.DELETED, updateCount);

function updateCount() {
  const n = drawnItems.getLayers().length;
  document.getElementById('info').innerHTML =
    '滚轮缩放 · 拖拽平移 · <b>左上工具栏可绘制 点 / 线 / 面 / 矩形</b> · Ctrl + Alt + 拖拽 旋转 · ' +
    '当前已标绘 <b>' + n + '</b> 个要素';
}
updateCount();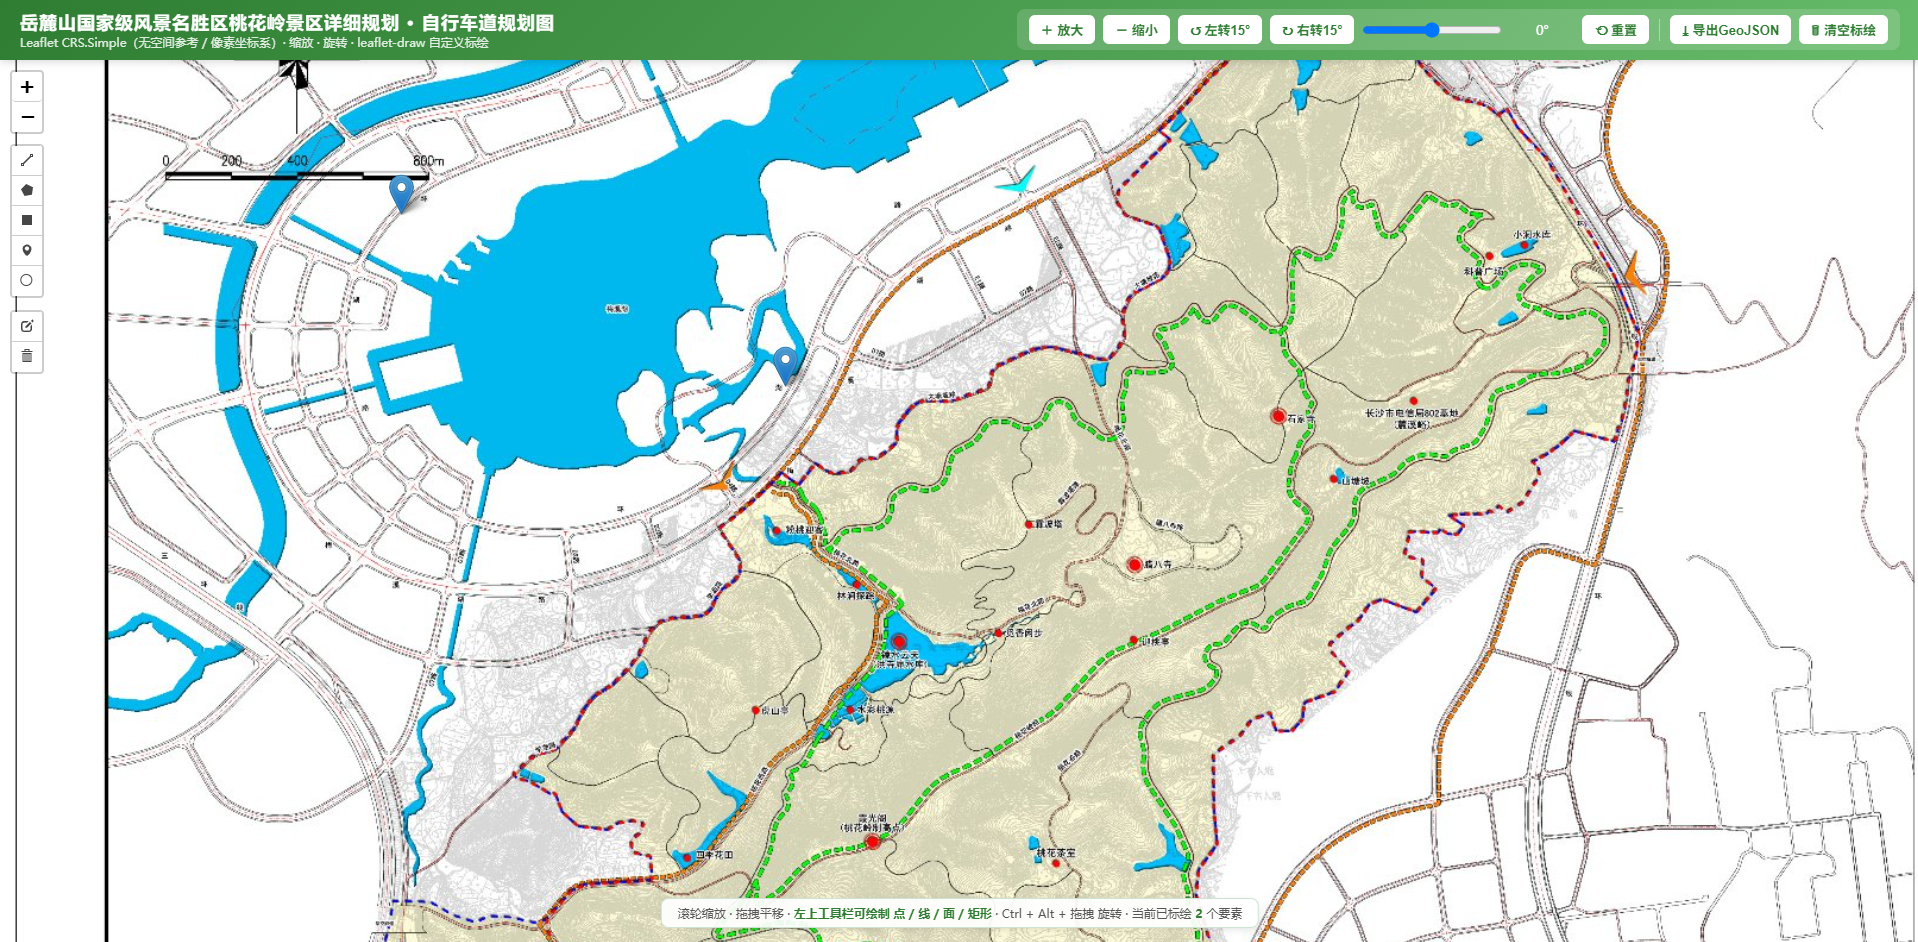
📷 图3 绘制点效果
marker 标注点落在规划图上的效果
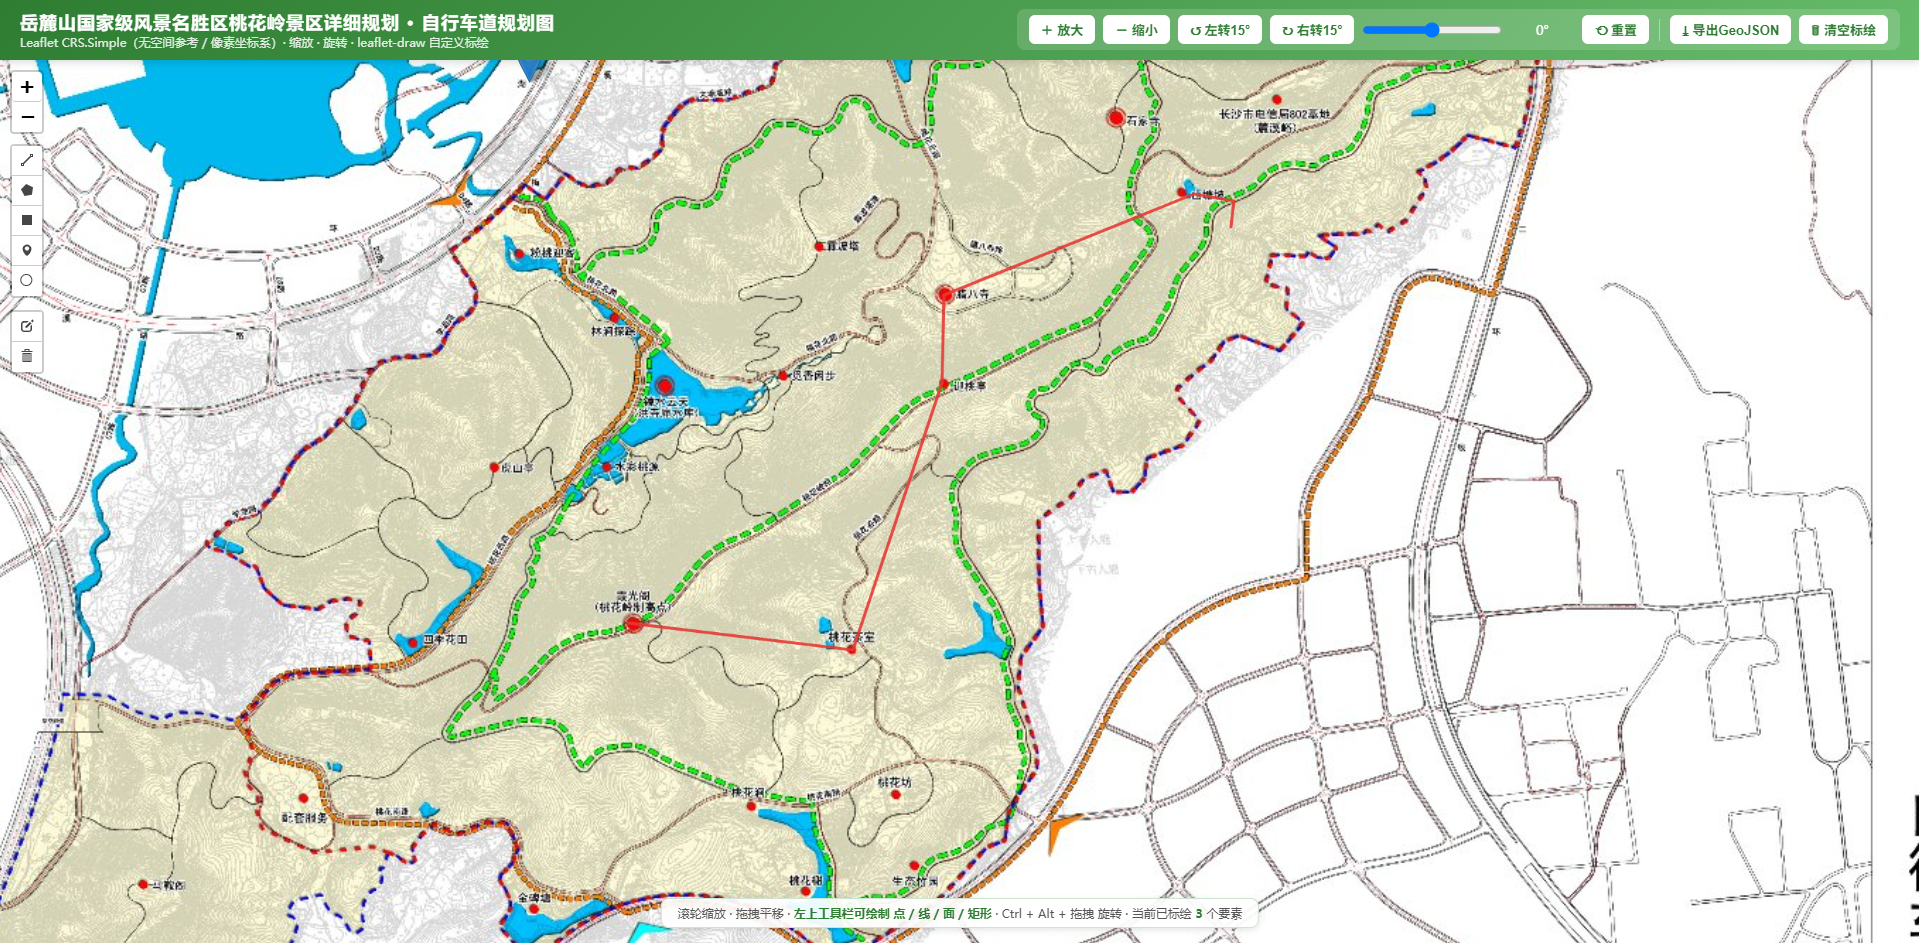
📷 图4 绘制线效果
红色折线(polyline)贯穿底图的效果
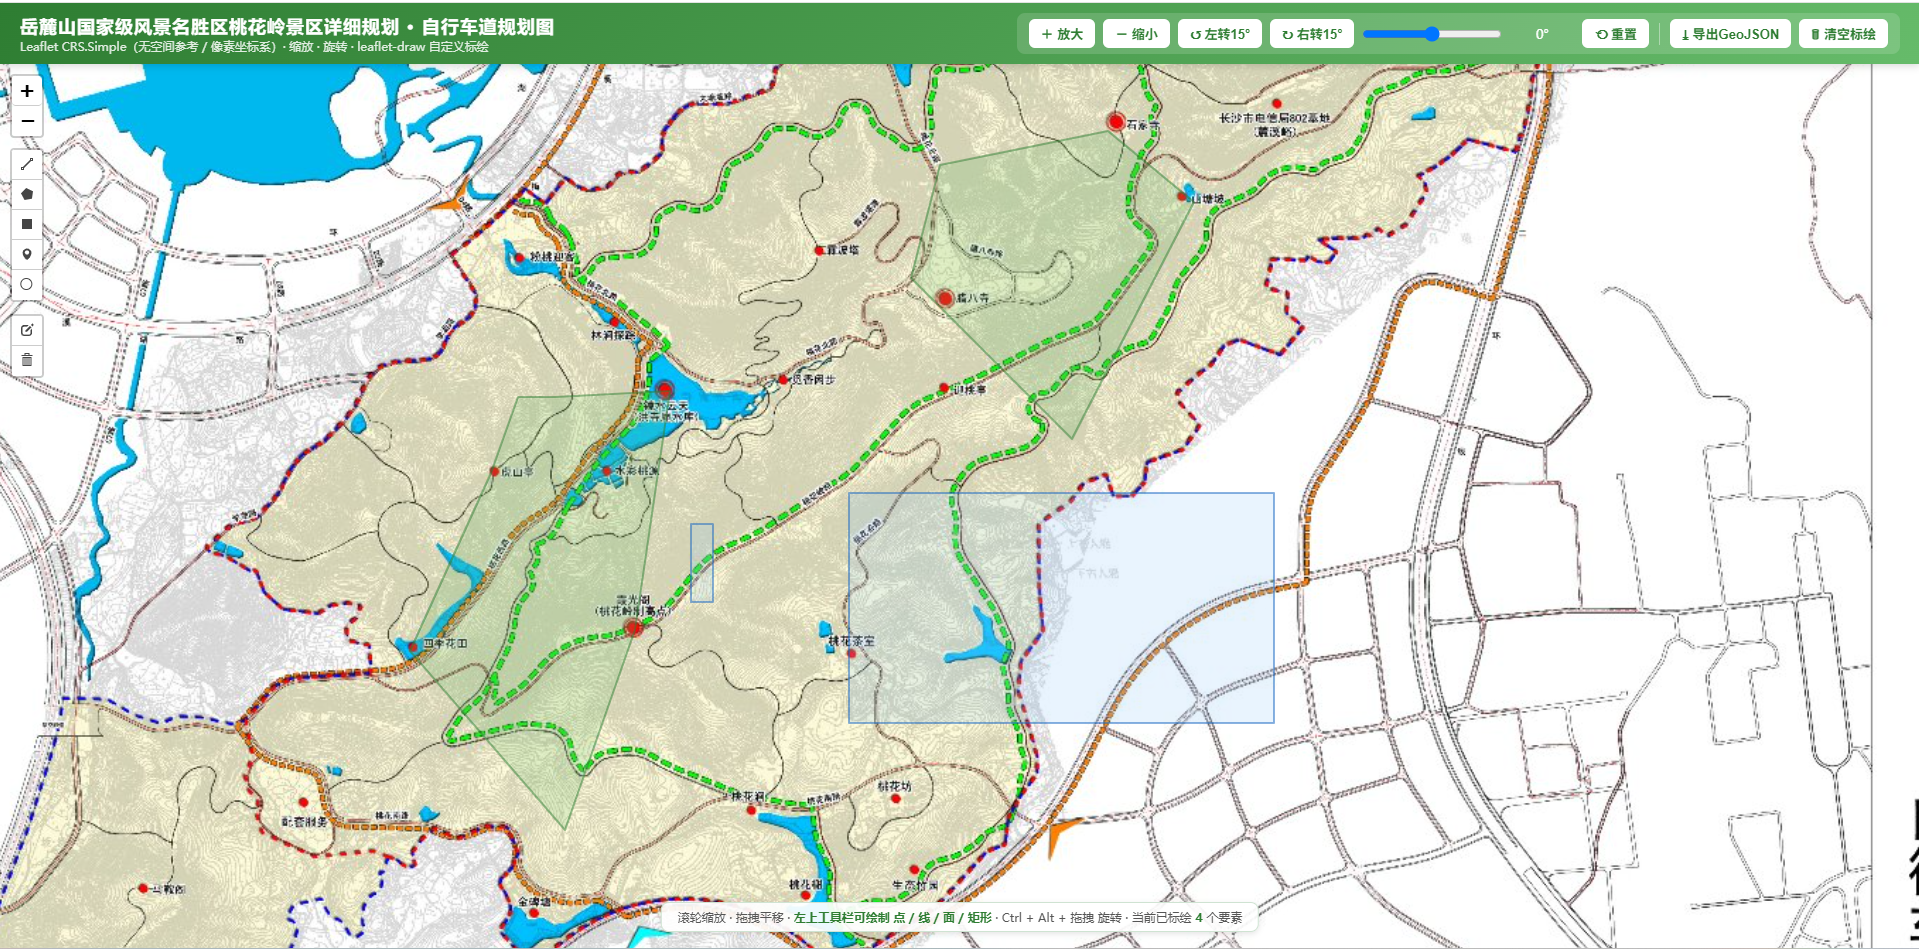
📷 图5 绘制面/矩形效果
绿色多边形 / 蓝色矩形半透明覆盖底图的效果
四、编辑与删除
drawControl 的 edit.featureGroup 已经指向 drawnItems,所以编辑(拖顶点改形)和删除(框选清除)能力由插件自带 ,无需额外代码。点击工具栏的"编辑"按钮进入顶点编辑模式,点击"删除"按钮进入框选删除模式。
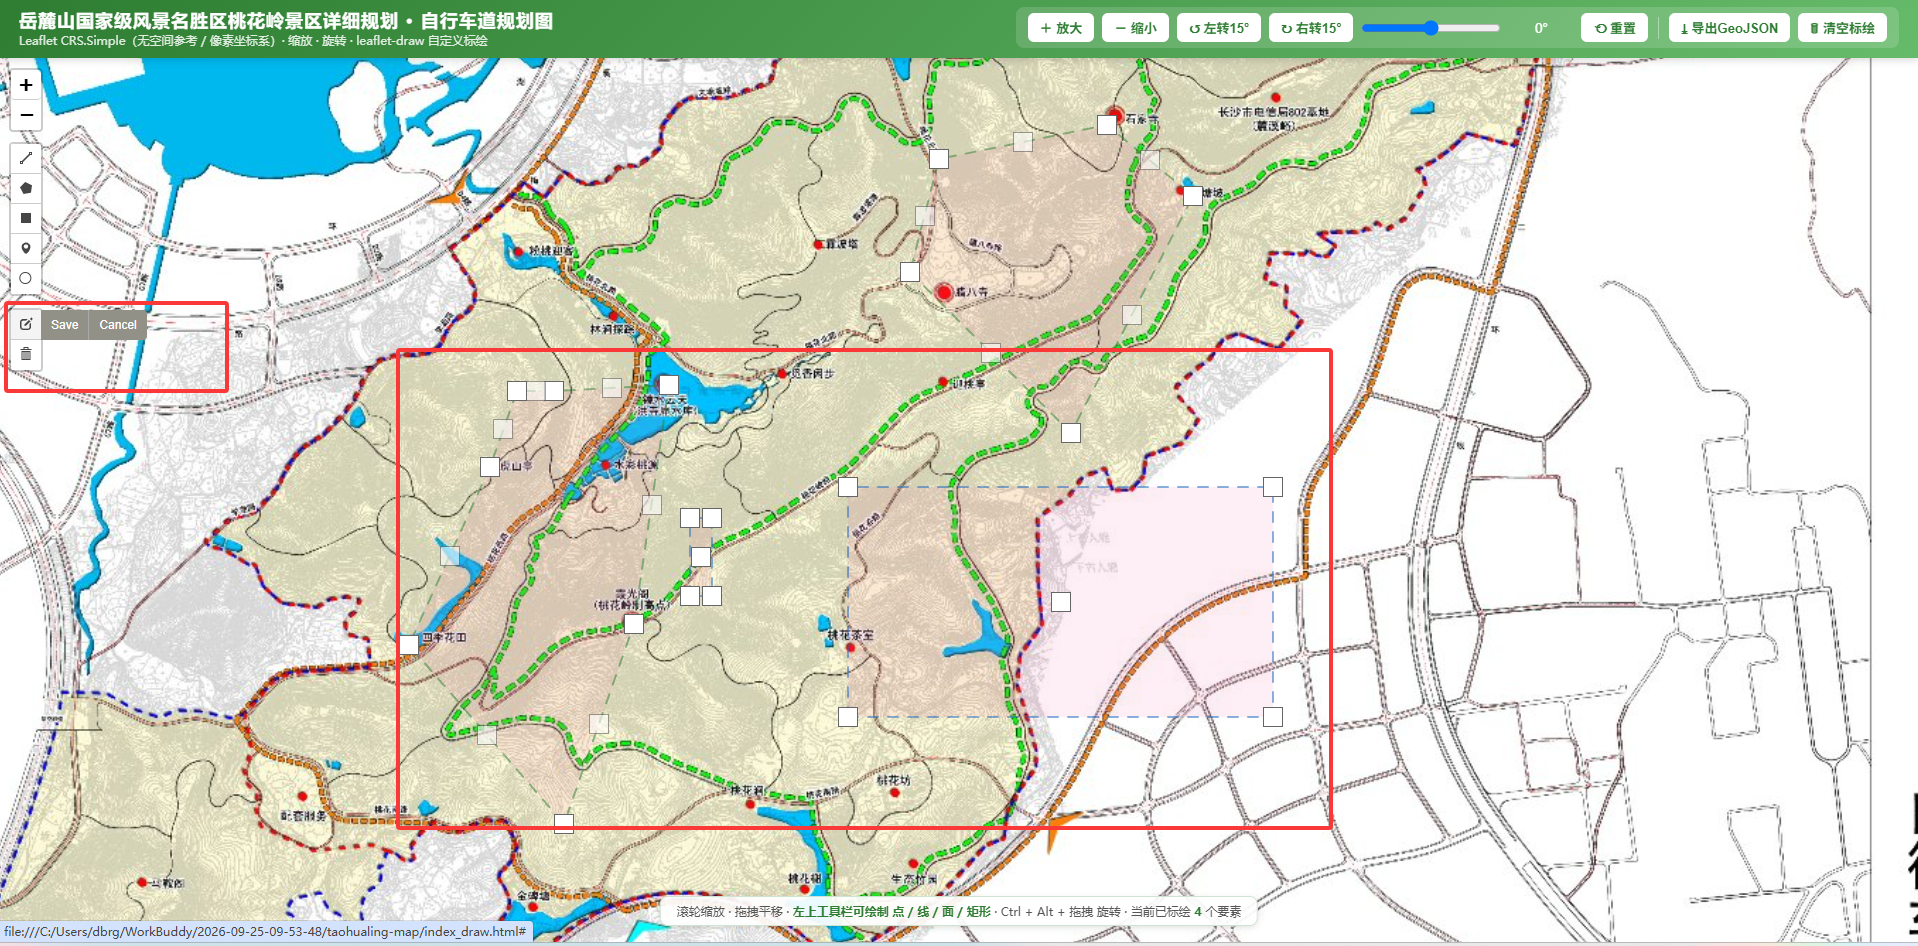
📷 图6 编辑/删除模式
编辑工具激活(出现顶点把手)或删除工具框选画面
五、GeoJSON 导出(重点:leaflet-draw 1.0.4 没有 toGeoJSON)
5.1 踩坑现场
原生直觉会写:
javascript
const data = drawnItems.toGeoJSON(); // ❌ 会抛错但 leaflet-draw 1.0.4 的源码里根本没有 toGeoJSON 方法 (把整个 leaflet.draw.js 拉到本地 grep,toGeoJSON / GeoJSON 零匹配)。所以 drawnItems.toGeoJSON() 会直接抛 is not a function,点击导出按钮毫无反应。这就是"导出 GeoJSON 无效"的真正根因。
5.2 正确做法:手动构造标准 GeoJSON
不依赖任何魔法方法,遍历 drawnItems 里的每个图层,直接读取经纬度 latlng 构造 FeatureCollection:
Marker→PointPolyline→LineStringPolygon/Rectangle→Polygon(矩形继承自 Polygon)
坐标映射很关键:在 L.CRS.Simple 下 latlng = (-py, px),因此 GeoJSON 坐标 [lng, lat] = [px, -py](即像素坐标),可直接进 PostGIS 或二次处理。
javascript
// 导出为 GeoJSON。
// 注意:leaflet-draw 1.0.4 并不提供 toGeoJSON(源码无此方法),
// 因此这里手动遍历绘制图层,直接读取 latlng 构造标准 GeoJSON。
// CRS.Simple 下 latlng = (-py, px),故 GeoJSON 坐标为 [lng=x, lat=-y](像素坐标)。
function llToCoord(ll) { return [ll.lng, ll.lat]; }

function layerToFeature(layer, idx) {
  if (layer instanceof L.Marker) {
    const ll = layer.getLatLng();
    return {
      type: 'Feature',
      geometry: { type: 'Point', coordinates: llToCoord(ll) },
      properties: { id: idx, kind: 'marker', popup: layer.getPopup() ? layer.getPopup().getContent() : '' }
    };
  }
  if (layer instanceof L.Polygon) {                       // 矩形也继承自 Polygon
    const rings = layer.getLatLngs();                     // 环数组(外环 + 孔)
    // 兼容 Leaflet 返回"嵌套环"或"扁平点"两种形态
    const isNested = rings.length && Array.isArray(rings[0]);
    const coords = isNested ? rings.map(ring => ring.map(llToCoord)) : [rings.map(llToCoord)];
    return {
      type: 'Feature',
      geometry: { type: 'Polygon', coordinates: coords },
      properties: { id: idx, kind: (layer instanceof L.Rectangle ? 'rectangle' : 'polygon'),
                    color: layer.options.color, popup: layer.getPopup() ? layer.getPopup().getContent() : '' }
    };
  }
  if (layer instanceof L.Polyline) {
    const line = layer.getLatLngs();
    const coords = Array.isArray(line[0])
      ? line.map(sub => sub.map(llToCoord))      // 多段线:[[LL...],[LL...]]
      : line.map(ll => llToCoord(ll));            // 单列线:[LL,LL,...]
    return {
      type: 'Feature',
      geometry: { type: 'LineString', coordinates: coords },
      properties: { id: idx, kind: 'polyline',
                    color: layer.options.color, popup: layer.getPopup() ? layer.getPopup().getContent() : '' }
    };
  }
  return null;
}

function buildGeoJSON() {
  const feats = [];
  let i = 0;
  drawnItems.eachLayer(layer => {
    const f = layerToFeature(layer, i++);
    if (f) feats.push(f);
  });
  return { type: 'FeatureCollection', features: feats };
}

document.getElementById('exportGeo').onclick = function () {
  const data = buildGeoJSON();
  if (!data.features.length) {
    alert('当前没有可导出的标绘要素,请先用左上工具栏绘制点 / 线 / 面 / 矩形。');
    return;
  }
  const blob = new Blob([JSON.stringify(data, null, 2)], { type: 'application/geo+json' });
  const url = URL.createObjectURL(blob);
  const a = document.createElement('a');
  a.href = url;
  a.download = 'drawn_features.geojson';
  document.body.appendChild(a);
  a.click();
  a.remove();
  setTimeout(() => URL.revokeObjectURL(url), 1000);   // 延迟释放,避免中断下载
  console.log('已导出 GeoJSON(CRS.Simple 像素坐标,[lng=x, lat=-y]):', data);
};
5.3 导出健壮性细节(已单元验证)
- 多边形嵌套兼容 :
Polygon.getLatLngs()可能返回[[LL,LL,...]](嵌套环)或[LL,LL,...](扁平),导出分支做了isNested判断,两种形态都正确。 - 折线单列误判 :原写法
(Array.isArray(line[0]) ? line : [line]).map(ll => llToCoord(ll))在单列线时会把整条线当成一个点,导致坐标变成[[null,null]];修正为line.map(ll => llToCoord(ll))(多段线再嵌套 map)。 - 空要素时
alert提示,避免下载空文件;blob URL 延迟 1 秒释放,防止中断下载。
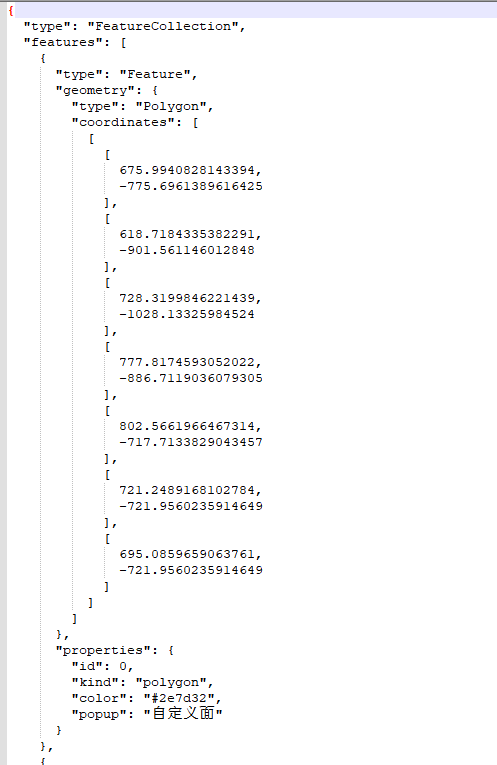
📷 图7 GeoJSON 导出结果
浏览器下载的 drawn_features.geojson 文件 或 控制台打印的 FeatureCollection
5.4 导出示例(像素坐标系)
假设用户在图上画了一个点(像素 300,320)、一条线(像素 200,300 → 520,430 → 900,360),导出的 GeoJSON 片段为:
json
{
  "type": "FeatureCollection",
  "features": [
    {
      "type": "Feature",
      "geometry": { "type": "Point", "coordinates": [300, -320] },
      "properties": { "id": 0, "kind": "marker", "popup": "自定义标注点" }
    },
    {
      "type": "Feature",
      "geometry": { "type": "LineString", "coordinates": [[200, -300], [520, -430], [900, -360]] },
      "properties": { "id": 1, "kind": "polyline", "color": "#e53935", "popup": "自定义线" }
    }
  ]
}
注意坐标 [-y]:因为图片像素 y 向下为正,而地图 y 向上为正,所以存成 GeoJSON 时 lat = -py。这与第一节的 latLng(-py, px) 完全自洽。
六、清空标绘
带确认,避免误删:
javascript
// 清空所有标绘
document.getElementById('clearDraw').onclick = function () {
  if (drawnItems.getLayers().length === 0) return;
  if (!confirm('确认清空所有标绘要素?')) return;
  drawnItems.clearLayers();
  updateCount();
};
七、工具栏:缩放 / 旋转 / 重置
除了标绘,顶栏还集成了放大、缩小、旋转(左转/右转 15°、滑块 -180°~180°)、重置。旋转的关键技巧是先把地图中心锁定到图片中心再 setBearing,这样旋转始终绕"图片中心点"进行,而不是视口中心(否则图会被甩偏):
javascript
function setBearing(deg) {
  // 先把地图中心锁定到图片中心,再设置旋转角:
  // 此时视口中心 == 图片中心,旋转便始终围绕"图片中心点"进行
  map.setView(IMAGE_CENTER, map.getZoom(), { animate: false });
  map.setBearing(deg);                       // 绕图片中心旋转地图
  bearingSlider.value = deg;
  bearingVal.textContent = deg + '°';
}

document.getElementById('zoomIn').onclick  = () => map.zoomIn(1);
document.getElementById('zoomOut').onclick = () => map.zoomOut(1);
document.getElementById('rotLeft').onclick  = () => setBearing(norm(map.getBearing() - 15));
document.getElementById('rotRight').onclick = () => setBearing(norm(map.getBearing() + 15));
bearingSlider.oninput = e => setBearing(norm(+e.target.value));

function norm(d) { return ((d + 180) % 360 + 360) % 360 - 180; }

document.getElementById('reset').onclick = () => {
  setBearing(0);
  map.fitBounds(bounds, { padding: [20, 20] });
};

// 同步:Ctrl+Alt+拖拽等方式旋转时,更新滑块与角度显示
map.on('rotate', () => {
  const b = Math.round(map.getBearing());
  bearingSlider.value = b;
  bearingVal.textContent = b + '°';
});旋转后,所有标绘要素(点/线/面/矩形)会整体随底图一起转动 ,因为它们都挂在同一个地图坐标系上。
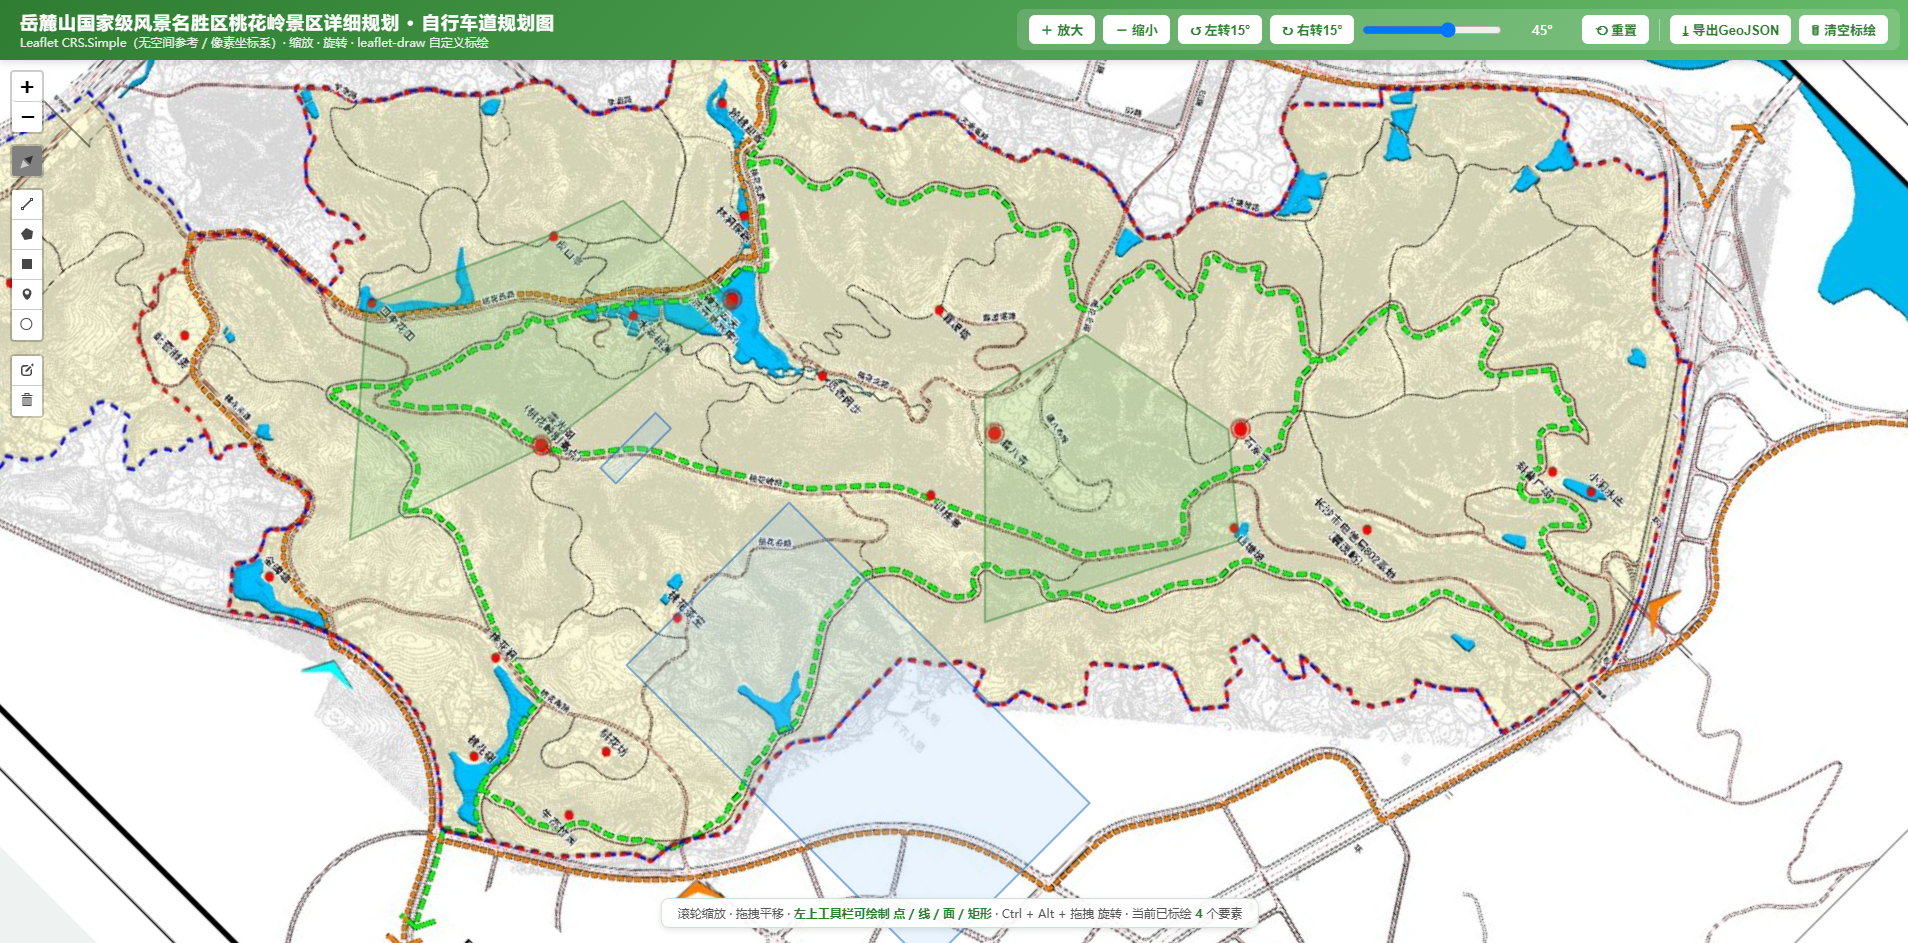
📷 图8 旋转后要素随动
地图旋转(如 45°)后标绘要素整体随底图转动
八、完整 HTML(index_draw.html 全量源码)
下面贴出可直接保存为 index_draw.html 并与 taohualing.jpg 同目录打开的完整代码:
html
<!DOCTYPE html>
<html lang="zh-CN">
<head>
<meta charset="UTF-8">
<meta name="viewport" content="width=device-width, initial-scale=1.0">
<title>桃花岭景区规划图 - Leaflet 查看器(自定义标绘)</title>
<link rel="stylesheet" href="https://unpkg.com/leaflet@1.9.4/dist/leaflet.css">
<link rel="stylesheet" href="https://unpkg.com/leaflet-rotate@0.2.1/dist/leaflet-rotate.css">
<link rel="stylesheet" href="https://unpkg.com/leaflet-draw@1.0.4/dist/leaflet.draw.css">
<style>
  * { margin: 0; padding: 0; box-sizing: border-box; }

  html, body { height: 100%; overflow: hidden; }

  body {
    font-family: "Microsoft YaHei", "PingFang SC", sans-serif;
    background: #f4f7f6;
    display: flex;
    flex-direction: column;
  }

  header {
    position: relative;          /* 建立层叠上下文,避免被地图图片覆盖 */
    z-index: 2000;               /* 高于地图容器(#map 为 1) */
    flex: 0 0 auto;              /* 不收缩,保持高度 */
    background: linear-gradient(135deg, #2e7d32, #66bb6a);
    color: #fff;
    padding: 10px 20px;
    display: flex;
    align-items: center;
    justify-content: space-between;
    flex-wrap: wrap;             /* 窗口较窄时按钮换行而非被挤出 */
    gap: 8px;
    box-shadow: 0 2px 8px rgba(0,0,0,.15);
  }

  header h1 { font-size: 18px; font-weight: 600; letter-spacing: 1px; }
  header .sub { font-size: 12px; opacity: .85; }

  #toolbar {
    display: flex;
    align-items: center;
    gap: 8px;
    background: rgba(255,255,255,.15);
    padding: 6px 12px;
    border-radius: 8px;
    flex-wrap: wrap;
  }

  #toolbar button {
    background: #fff;
    color: #2e7d32;
    border: none;
    border-radius: 6px;
    padding: 5px 12px;
    font-size: 13px;
    cursor: pointer;
    font-weight: 600;
    transition: all .15s;
  }

  #toolbar button:hover { background: #e8f5e9; transform: translateY(-1px); }
  #toolbar .sep { width: 1px; height: 22px; background: rgba(255,255,255,.4); margin: 0 2px; }

  #bearingVal {
    color: #fff;
    font-size: 13px;
    min-width: 64px;
    text-align: center;
    font-variant-numeric: tabular-nums;
  }

  #map {
    flex: 1;
    position: relative;   /* 建立独立层叠上下文 */
    z-index: 1;           /* 低于 header / info,地图内容不会盖住它们 */
    background: #eef2f0;
  }

  /* 自定义缩放按钮样式 */
  .leaflet-control-zoom a { border-radius: 4px !important; }

  #info {
    position: fixed;      /* 固定在视口底部,独立于地图流 */
    z-index: 2000;        /* 高于地图 */
    bottom: 16px;
    left: 50%;
    transform: translateX(-50%);
    background: rgba(255,255,255,.92);
    border: 1px solid #cfe3d2;
    border-radius: 8px;
    padding: 6px 16px;
    font-size: 12px;
    color: #555;
    box-shadow: 0 2px 6px rgba(0,0,0,.1);
    pointer-events: none;
    white-space: nowrap;
  }

  #info b { color: #2e7d32; }
</style>
</head>
<body>

<header>
  <div>
    <h1>岳麓山国家级风景名胜区桃花岭景区详细规划 · 自行车道规划图</h1>
    <div class="sub">Leaflet CRS.Simple(无空间参考 / 像素坐标系)· 缩放 · 旋转 · leaflet-draw 自定义标绘</div>
  </div>
  <div id="toolbar">
    <button id="zoomIn"  title="放大">+ 放大</button>
    <button id="zoomOut" title="缩小">- 缩小</button>
    <button id="rotLeft" title="逆时针旋转 15°">↺ 左转15°</button>
    <button id="rotRight" title="顺时针旋转 15°">↻ 右转15°</button>
    <input id="bearingSlider" type="range" min="-180" max="180" step="1" value="0" style="width:140px;" title="旋转角度滑块">
    <span id="bearingVal">0°</span>
    <button id="reset" title="重置视图">⟲ 重置</button>
    <span class="sep"></span>
    <button id="exportGeo" title="导出为 GeoJSON(像素坐标)">⤓ 导出GeoJSON</button>
    <button id="clearDraw" title="清空所有标绘">🗑 清空标绘</button>
  </div>
</header>

<div id="map"></div>
<div id="info">滚轮缩放 · 拖拽平移 · <b>左上工具栏可绘制 点 / 线 / 面 / 矩形</b> · Ctrl + Alt + 拖拽 旋转 · Alt + 滚轮 缩放</div>

<script src="https://unpkg.com/leaflet@1.9.4/dist/leaflet.js"></script>
<script src="https://unpkg.com/leaflet-rotate@0.2.1/dist/leaflet-rotate.js"></script>
<script src="https://unpkg.com/leaflet-draw@1.0.4/dist/leaflet.draw.js"></script>
<script>
  // 图片像素尺寸(1920 x 1356)
  const IMG_W = 1920, IMG_H = 1356;

  // L.CRS.Simple:无空间参考的平面直角坐标系(单位 = 像素)
  // y 轴向上为正,因此 bounds 的 y 取负值,保证图片显示方向正确
  const bounds = L.latLngBounds([
    [ -IMG_H, 0 ],      // 图片左下角(y 翻转)
    [ 0, IMG_W ]        // 图片右上角
  ]);

  // 图片中心点(CRS.Simple 坐标系),旋转始终绕该点进行
  const IMAGE_CENTER = bounds.getCenter();

  const map = L.map('map', {
    crs: L.CRS.Simple,          // 无空间参考坐标系
    rotate: true,               // 开启旋转能力(leaflet-rotate 插件)
    bearing: 0,                 // 初始旋转角
    minZoom: -3,
    maxZoom: 4,
    zoomSnap: 0.25,             // 平滑缩放
    zoomDelta: 0.5,
    attributionControl: false
  });

  // 以图片方式加载规划图(ImageOverlay,不做任何投影变换)
  const overlay = L.imageOverlay('taohualing.jpg', bounds, {
    interactive: true,
    className: 'plan-img'
  }).addTo(map);

  map.fitBounds(bounds, { padding: [20, 20] });

  // ================= 自定义标绘:leaflet-draw =================
  // 存放所有用户绘制的要素,编辑/删除/导出都基于它
  const drawnItems = new L.FeatureGroup();
  map.addLayer(drawnItems);

  const drawControl = new L.Control.Draw({
    position: 'topleft',
    draw: {
      circle: false,          // CRS.Simple 没有真实距离单位,关闭"圆(按米)"
      marker: {
        icon: new L.Icon({
          iconUrl: 'https://unpkg.com/leaflet@1.9.4/dist/images/marker-icon.png',
          iconRetinaUrl: 'https://unpkg.com/leaflet@1.9.4/dist/images/marker-icon-2x.png',
          shadowUrl: 'https://unpkg.com/leaflet@1.9.4/dist/images/marker-shadow.png',
          iconSize: [25, 41], iconAnchor: [12, 41], popupAnchor: [1, -34]
        })
      },
      polyline: { shapeOptions: { color: '#e53935', weight: 3, opacity: .9 } },
      // showArea:false ------ 关键:关闭面积自动计算,规避 leaflet-draw 1.0.4 在 Leaflet≥1.8 下的报错
      polygon:  { showArea: false, shapeOptions: { color: '#2e7d32', weight: 2, fillColor: '#66bb6a', fillOpacity: .2 } },
      rectangle:{ showArea: false, shapeOptions: { color: '#1565c0', weight: 2, fillColor: '#90caf9', fillOpacity: .2 } }
    },
    edit: {
      featureGroup: drawnItems,   // 必须:编辑/删除作用于此图层组
      remove: true
    }
  });
  map.addControl(drawControl);

  // 创建 / 编辑 / 删除 事件
  map.on(L.Draw.Event.CREATED, function (e) {
    const layer = e.layer;
    const type = e.layerType;
    if (type === 'marker') {
      layer.bindPopup('自定义标注点');
    } else if (type === 'polyline') {
      layer.bindPopup('自定义线');
    } else {
      layer.bindPopup('自定义面');
    }
    drawnItems.addLayer(layer);
    updateCount();
  });
  map.on(L.Draw.Event.EDITED, updateCount);
  map.on(L.Draw.Event.DELETED, updateCount);

  function updateCount() {
    const n = drawnItems.getLayers().length;
    document.getElementById('info').innerHTML =
      '滚轮缩放 · 拖拽平移 · <b>左上工具栏可绘制 点 / 线 / 面 / 矩形</b> · Ctrl + Alt + 拖拽 旋转 · ' +
      '当前已标绘 <b>' + n + '</b> 个要素';
  }
  updateCount();

  // 导出为 GeoJSON。
  // 注意:leaflet-draw 1.0.4 并不提供 toGeoJSON(源码无此方法),
  // 因此这里手动遍历绘制图层,直接读取 latlng 构造标准 GeoJSON。
  // CRS.Simple 下 latlng = (-py, px),故 GeoJSON 坐标为 [lng=x, lat=-y](像素坐标)。
  function llToCoord(ll) { return [ll.lng, ll.lat]; }

  function layerToFeature(layer, idx) {
    if (layer instanceof L.Marker) {
      const ll = layer.getLatLng();
      return {
        type: 'Feature',
        geometry: { type: 'Point', coordinates: llToCoord(ll) },
        properties: { id: idx, kind: 'marker', popup: layer.getPopup() ? layer.getPopup().getContent() : '' }
      };
    }
    if (layer instanceof L.Polygon) {                       // 矩形也继承自 Polygon
      const rings = layer.getLatLngs();                     // 环数组(外环 + 孔)
      // 兼容 Leaflet 返回"嵌套环"或"扁平点"两种形态
      const isNested = rings.length && Array.isArray(rings[0]);
      const coords = isNested ? rings.map(ring => ring.map(llToCoord)) : [rings.map(llToCoord)];
      return {
        type: 'Feature',
        geometry: { type: 'Polygon', coordinates: coords },
        properties: { id: idx, kind: (layer instanceof L.Rectangle ? 'rectangle' : 'polygon'),
                      color: layer.options.color, popup: layer.getPopup() ? layer.getPopup().getContent() : '' }
      };
    }
    if (layer instanceof L.Polyline) {
      const line = layer.getLatLngs();
      const coords = Array.isArray(line[0])
        ? line.map(sub => sub.map(llToCoord))      // 多段线:[[LL...],[LL...]]
        : line.map(ll => llToCoord(ll));            // 单列线:[LL,LL,...]
      return {
        type: 'Feature',
        geometry: { type: 'LineString', coordinates: coords },
        properties: { id: idx, kind: 'polyline',
                      color: layer.options.color, popup: layer.getPopup() ? layer.getPopup().getContent() : '' }
      };
    }
    return null;
  }

  function buildGeoJSON() {
    const feats = [];
    let i = 0;
    drawnItems.eachLayer(layer => {
      const f = layerToFeature(layer, i++);
      if (f) feats.push(f);
    });
    return { type: 'FeatureCollection', features: feats };
  }

  document.getElementById('exportGeo').onclick = function () {
    const data = buildGeoJSON();
    if (!data.features.length) {
      alert('当前没有可导出的标绘要素,请先用左上工具栏绘制点 / 线 / 面 / 矩形。');
      return;
    }
    const blob = new Blob([JSON.stringify(data, null, 2)], { type: 'application/geo+json' });
    const url = URL.createObjectURL(blob);
    const a = document.createElement('a');
    a.href = url;
    a.download = 'drawn_features.geojson';
    document.body.appendChild(a);
    a.click();
    a.remove();
    setTimeout(() => URL.revokeObjectURL(url), 1000);   // 延迟释放,避免中断下载
    console.log('已导出 GeoJSON(CRS.Simple 像素坐标,[lng=x, lat=-y]):', data);
  };

  // 清空所有标绘
  document.getElementById('clearDraw').onclick = function () {
    if (drawnItems.getLayers().length === 0) return;
    if (!confirm('确认清空所有标绘要素?')) return;
    drawnItems.clearLayers();
    updateCount();
  };

  // ---------- 工具栏交互 ----------
  const bearingSlider = document.getElementById('bearingSlider');
  const bearingVal    = document.getElementById('bearingVal');

  function setBearing(deg) {
    // 先把地图中心锁定到图片中心,再设置旋转角:
    // 此时视口中心 == 图片中心,旋转便始终围绕"图片中心点"进行
    map.setView(IMAGE_CENTER, map.getZoom(), { animate: false });
    map.setBearing(deg);                       // 绕图片中心旋转地图
    bearingSlider.value = deg;
    bearingVal.textContent = deg + '°';
  }

  document.getElementById('zoomIn').onclick  = () => map.zoomIn(1);
  document.getElementById('zoomOut').onclick = () => map.zoomOut(1);
  document.getElementById('rotLeft').onclick  = () => setBearing(norm(map.getBearing() - 15));
  document.getElementById('rotRight').onclick = () => setBearing(norm(map.getBearing() + 15));
  bearingSlider.oninput = e => setBearing(norm(+e.target.value));

  function norm(d) { return ((d + 180) % 360 + 360) % 360 - 180; }

  document.getElementById('reset').onclick = () => {
    setBearing(0);
    map.fitBounds(bounds, { padding: [20, 20] });
  };

  // 同步:Ctrl+Alt+拖拽等方式旋转时,更新滑块与角度显示
  map.on('rotate', () => {
    const b = Math.round(map.getBearing());
    bearingSlider.value = b;
    bearingVal.textContent = b + '°';
  });
</script>
</body>
</html>
九、总结
- 无坐标图标绘 =
L.CRS.Simple+leaflet-draw:图片按像素加载,坐标就是像素,无需经纬度。 - 坐标约定要记牢 :图片像素
(px, py)→ 地图latLng(-py, px)→ GeoJSON[lng=x, lat=-y]。 - 兼容性三个必做 :
showArea:false(关面积计算)、circle:false(无真实距离)、marker 显式指定图标(防破图)。 - 导出坑 :leaflet-draw 1.0.4 没有
toGeoJSON,必须手动遍历图层构造FeatureCollection;同时注意多边形嵌套、折线单列两种形态,避免坐标错乱。 - 旋转绕中心 :
setView(IMAGE_CENTER)再setBearing,保证旋转锚定图片中心,标绘要素随底图一起转。
适用场景延伸
- 把导出的 GeoJSON 直接落进 PostGIS 的
geometry字段(配合 SRID=0 或自定义像素坐标系),与你的水务/供水知识图谱本体打通; - 标绘点可绑定业务属性(如"水管家""小区 POI"),导出时写进
properties; - 多张规划图可做图层切换,复用同一套标绘交互。