原理
通过DataV工具 生成行政区的geojson(得到各区的面元素数据), 随后使用手动绘制featureLayer与Label,并加载到地图。
JS
    //vue3加载geojson数据public/geojson/pt.json,在MapView渲染上加载geojson数据 type是"MultiPolygon"
      fetch(baseUrl+'/geojson/pt.json')
        .then(response => response.json())
        .then(data => {
          console.log(data)
          // debugger
          let graphics = data.features.map((feature) => {
            //Polygon 单个多边形绘制
            let geometry = {
              type: 'polygon',
              rings: feature.geometry.coordinates[0]
            }
            return new Graphic({
              geometry: geometry,
              attributes: feature.properties
            })
          })

          let featureLayer = new FeatureLayer({
            fields: [
              {
                name: 'ObjectID',
                alias: 'ObjectID',
                type: 'oid'
              },
              {
                name: 'name',
                alias: 'name',
                type: 'string'
              },
              {
                name: 'adcode',
                alias: 'adcode',
                type: 'integer'
              }
            ],
            objectIdField: 'ObjectID',
            geometryType: 'polygon',
            spatialReference: {
              wkid: 4326
            },
            source: graphics,
            renderer: {
              type: 'simple',
              symbol: {
                type: 'simple-fill',
                color: [227, 139, 79, 0.8],
                outline: {
                  color: [255, 255, 255],
                  width: 1
                }
              }
            },
            labelingInfo: [
              {
                labelExpressionInfo: {
                  expression: '$feature.name'
                },
                symbol: {
                  type: 'text',
                  color: [0, 0, 0, 1],
                  haloColor: [255, 255, 255, 1],
                  haloSize: 1,
                  font: {
                    size: 12
                  }
                }
              }
            ]
          })

          //地图加载featureLayer
          view.map.layers.add(featureLayer)
        })

    })
源码地址
演示站点
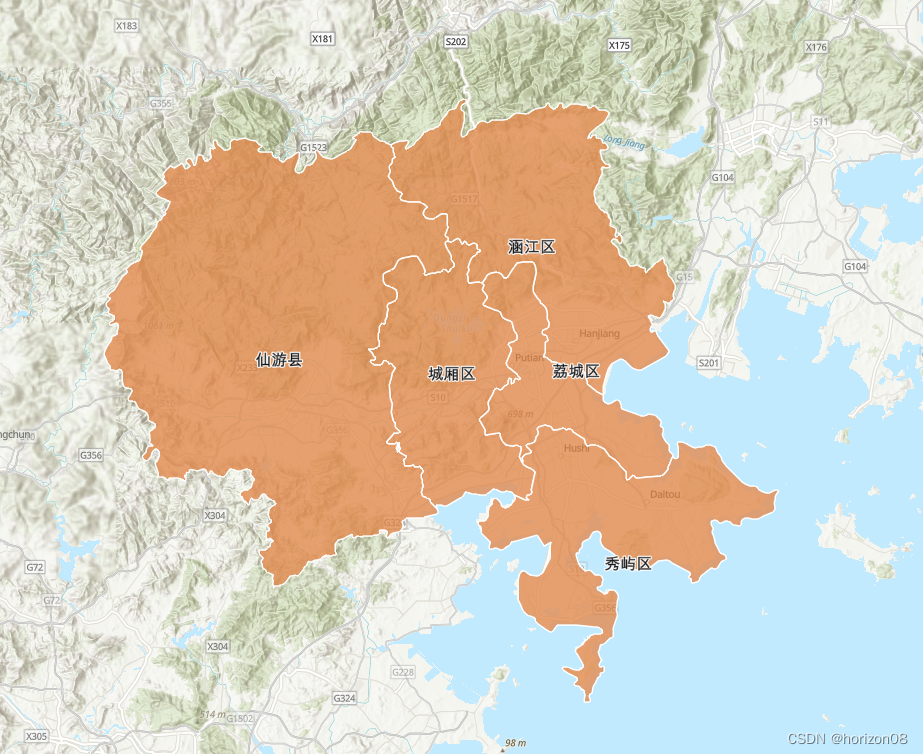
效果