甘特图
手动封装简版甘特图,纯展示功能,无其他操作
文章目录
前言
开始的思路是使用echarts 瀑布图来体现,但是试验后发现,头部时间功能不满足,然未找到其他组件,于是手动封装一个,比较简陋,凑乎看。
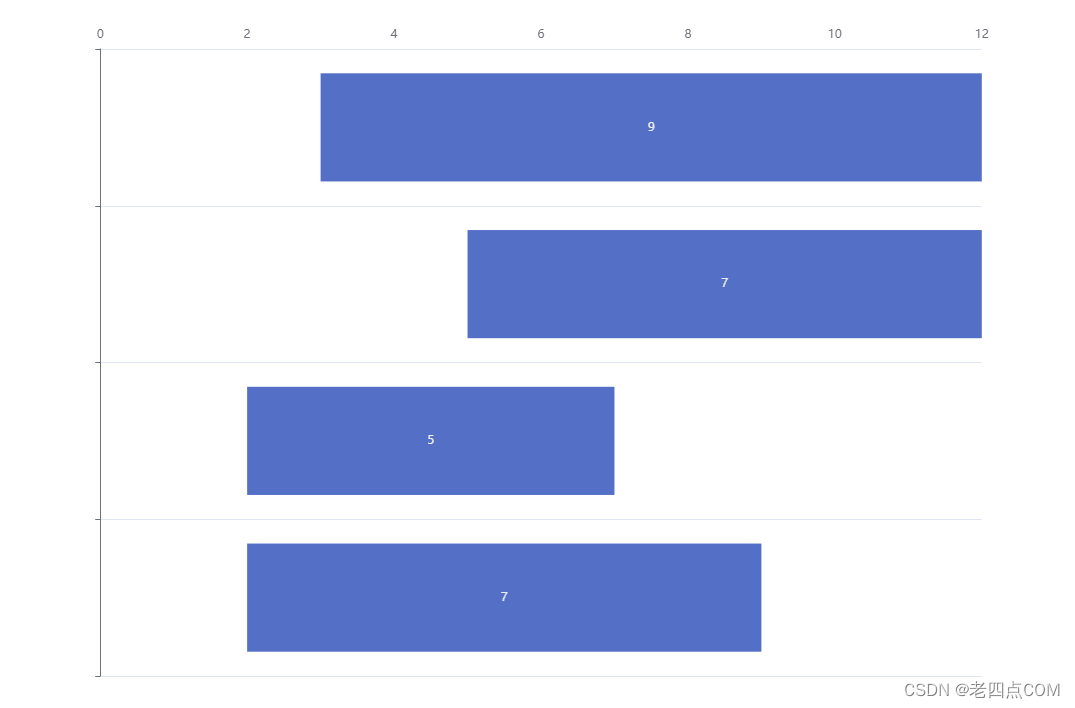
echarts效果
效果图
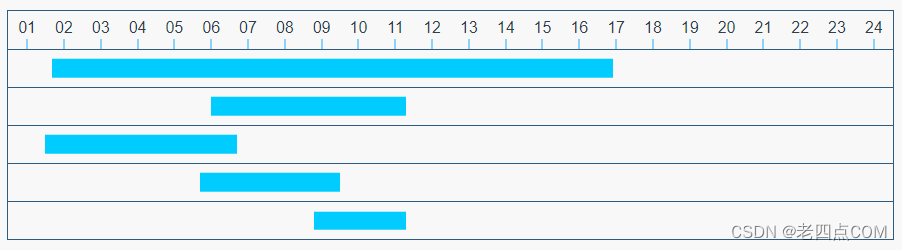
组件
javascript
<template>

    <div class="gantt_chart">
        <ul class="title" :style="{height}">
            <li  v-for="i in 24" :key="i">
                <p class="title_font">
                    {{ i.toString().length == 1 ? `0${i}` : i }}
                </p>
                <p class="title_node"></p>
            </li>
        </ul>
        <div class="gantt_chart_columns" v-for="v,i in chartData" :key="i" :style="{height}">
            <p class="time_value" :style="{width:getWidth(v),left:getLeft(v)}">
            </p>
        </div>
    </div>

</template>

<script setup>

import {computed,toRefs } from 'vue';


let props = defineProps({
    chartData:{
        type:Object,
        default:() =>  {
            return []
        }
    },
    height:{
        type:String,
        default:() =>  {
            return ''
        }
    }
})

const { chartData } = toRefs(props);


const getWidth = computed(() =>{
    return function (val) {
        if (val.length == 2) {
            if (val[0] > val[1]) {
                let num = ((val[0] - val[1]) / 24 * 100).toString() + '%'
                return num
            } else {
                let num = ((val[1] - val[0]) / 24 * 100).toString() + '%'
                return num
            }
        }
    }

})

const getLeft = computed(() =>{
    return function (val) {
        if (val.length == 2) {
            if (val[0] > val[1]) {
                let num = (val[1] / 24 * 100).toString() + '%'
                return num
            } else {
                let num = (val[0] / 24 * 100).toString() + '%'
                return num
            }
        }
    }
})


</script>
<style scoped lang="scss">
    .gantt_chart{
        width: 100%;
        height: 100%;
        border: 1px solid #2e5c80;
        overflow: auto;
        .title{
            width: 100%;
            // height: 16.6666%;
            overflow: hidden;
            display: flex;
            justify-content: space-evenly;
            overflow: hidden;
            border-bottom: 1px solid #2e5c80;
            margin: 0;
            padding: 0;
            li {
                width: 4%;
                position: relative;
                text-align: center;
                list-style:none;
                box-sizing: border-box;
            }
            .title_font {
                display: inline-block;
                height: 22px;
                margin: 0;
                position: absolute;
                left: 50%;
                top: 50%;
                transform: translate(-50%, -50%);
            }
            .title_node {
                width: 1px;
                height: 10px;
                margin: 0;
                background: #1ea9fa;
                position: absolute;
                left: 50%;
                bottom: 0;
                transform: translateX(-50%);
            }
        }
        .gantt_chart_columns {
            width: 100%;
            // height: 16.6666%;
            overflow: hidden;
            border-bottom: 1px solid #2e5c80;
            .time_value {
                height: 50%;
                position: relative;
                top: 50%;
                transform: translateY(-50%);
                margin: 0;
                background-color: #00ccff;
            }

        }
        .gantt_chart_columns:last-child {
             border-bottom:none;
        }
    }
</style>
使用
javascript
import GanttChart from '@/components/GanttChart.vue';

<GanttChart style="width:50%;height:30%; margin-top: 1.1%;" :chartData="chartData" height="16.3%"/>


import { ref } from 'vue';
let chartData = ref([
    [1.2,16.4],
    [5.5,10.8],
    [1,6.2],
    [5.2,9],
    [8.3,10.8],
])
总结
简单使用,至于数据需要处理后传入
感谢各位大佬观看