前言
工作中有业务涉及到机器学习模型,以CatBoost为例记录学习流程。
1.CatBoost简介
CatBoost是俄罗斯的搜索巨头Y andex在2017年开源的机器学习库,和lightgbm、xgboost并成为gbdt三大主流神器库,它是一种基于对称决策树(oblivious trees) 算法的参数少、支持类别型变量和高准确性的GBDT框架,主要说解决的痛点是高效合理地处理类别型特征,另外提出了新的方法来处理**梯度偏差(Gradient bias)以及预测偏移(Prediction shift)**问题,提高算法的准确性和泛化能力。
2.使用CatBoost进行多分类
2.1 引入库
python
import os
import pandas as pd
import numpy as np
import catboost
from catboost.datasets import amazon
from catboost import CatBoostClassifier
from catboost import Pool
from sklearn.model_selection import train_test_split
from tqdm import tqdm
from sklearn.metrics import accuracy_score,f1_score
2.2 数据处理
python
def GetNewDataByPandas(data_file):
    data = pd.read_csv(data_file)
    data = data.dropna()  #将所有含空缺值的行都删除
    print(data.keys())
    y = np.array(data["pkg_label"],dtype=np.int64)
    x = np.array(data.drop("pkg_label", axis=1),dtype=np.int64)
    return x, y
2.3 划分数据集
python
# 划分训练集和测试集
x, y = GetNewDataByPandas(DATASET_FILE)
x_train, x_test, y_train, y_test = train_test_split(x, y, test_size=0.1)
2.4 设定cat_features
python
cat_features = list(range(0,x_test.shape[-1]))
print(cat_features)
#[0, 1, 2, 3, 4, 5, 6, 7, 8, 9]
2.5 设定params
python
params={
    'classes_count':3,
    #'auto_class_weights' :'Balanced',
    #'task_type': 'GPU',
    #'devices': '0:1',
    'loss_function': 'MultiClassOneVsAll', # 损失函数,取值RMSE, Logloss, MAE, CrossEntropy, Quantile, LogLinQuantile, Multiclass, MultiClassOneVsAll, MAPE, Poisson。默认Logloss。
    #'custom_loss': 'Logloss', # 训练过程中计算显示的损失函数,取值Logloss、CrossEntropy、Precision、Recall、F、F1、BalancedAccuracy、AUC等等
    'eval_metric': 'AUC', # 用于过度拟合检测和最佳模型选择的指标,取值范围同custom_loss
    'iterations': 10, # 最大迭代次数,默认500. 别名:num_boost_round, n_estimators, num_trees
    'learning_rate': 0.1, # 学习速率,默认0.03 别名:eta
    'random_seed': 123, # 训练的随机种子,别名:random_state
    'l2_leaf_reg': 5, # l2正则项,别名:reg_lambda
    'bootstrap_type': 'Bernoulli', # 确定抽样时的样本权重,取值Bayesian、Bernoulli(伯努利实验)、MVS(仅支持cpu)、Poisson(仅支持gpu)、No(取值为No时,每棵树为简单随机抽样);默认值GPU下为Bayesian、CPU下为MVS
#   'bagging_temperature': 0,  # bootstrap_type=Bayesian时使用,取值为1时采样权重服从指数分布;取值为0时所有采样权重均等于1。取值范围[0,inf),值越大、bagging就越激进
    'subsample': 0.6, # 样本采样比率(行采样)
    'sampling_frequency': 'PerTree', # 采样频率,取值PerTree(在构建每棵新树之前采样)、PerTreeLevel(默认值,在子树的每次分裂之前采样);仅支持CPU
    'use_best_model': True, # 让模型使用效果最优的子树棵树/迭代次数,使用验证集的最优效果对应的迭代次数(eval_metric:评估指标,eval_set:验证集数据),布尔类型可取值0,1(取1时要求设置验证集数据)
    'best_model_min_trees': 50, # 最少子树棵树,和use_best_model一起使用
    'depth': 4, # 树深,默认值6
    'grow_policy': 'SymmetricTree', # 子树生长策略,取值SymmetricTree(默认值,对称树)、Depthwise(整层生长,同xgb)、Lossguide(叶子结点生长,同lgb)
    'min_data_in_leaf': 500, # 叶子结点最小样本量
#    'max_leaves': 12, # 最大叶子结点数量
    'one_hot_max_size': 4, # 对唯一值数量<one_hot_max_size的类别型特征使用one-hot编码
    'rsm': 0.8, # 列采样比率,别名colsample_bylevel 取值(0,1],默认值1
    'nan_mode': 'Max', # 缺失值处理方法,取值Forbidden(不支持缺失值,输入包含缺失时会报错)、Min(处理为该列的最小值,比原最小值更小)、Max(同理)
    'input_borders': None, # 特征数据边界(最大最小边界)、会影响缺失值的处理(nan_mode取值Min、Max时),默认值None、在训练时特征取值的最大最小值即为特征值边界
    'boosting_type': 'Ordered', # 提升类型,取值Ordered(catboost特有的排序提升,在小数据集上效果可能更好,但是运行速度较慢)、Plain(经典提升)
    'max_ctr_complexity': 2, # 分类特征交叉的最高阶数,默认值4
    'logging_level':'Verbose', # 模型训练过程的信息输出等级,取值Silent(不输出信息)、Verbose(默认值,输出评估指标、已训练时间、剩余时间等)、Info(输出额外信息、树的棵树)、Debug(debug信息)
    'metric_period': 1, # 计算目标值、评估指标的频率,默认值1、即每次迭代都输出目标值、评估指标
    'early_stopping_rounds': 20,
    'border_count': 254, # 数值型特征的分箱数,别名max_bin,取值范围[1,65535]、默认值254(CPU下), # 设置提前停止训练,在得到最佳的评估结果后、再迭代n(参数值为n)次停止训练,默认值不启用
    'feature_border_type': 'GreedyLogSum', # 数值型特征的分箱方法,取值Median、Uniform、UniformAndQuantiles、MaxLogSum、MinEntropy、GreedyLogSum(默认值)

}
2.6 定义模型
python
model = CatBoostClassifier(**params)2.7 训练
python
model.fit(x_train, y_train,eval_set=[(x_test,y_test)],cat_features=cat_features,plot=True,)
#model.fit(train_pool,eval_set=validation_pool,cat_features=cat_features,plot=True)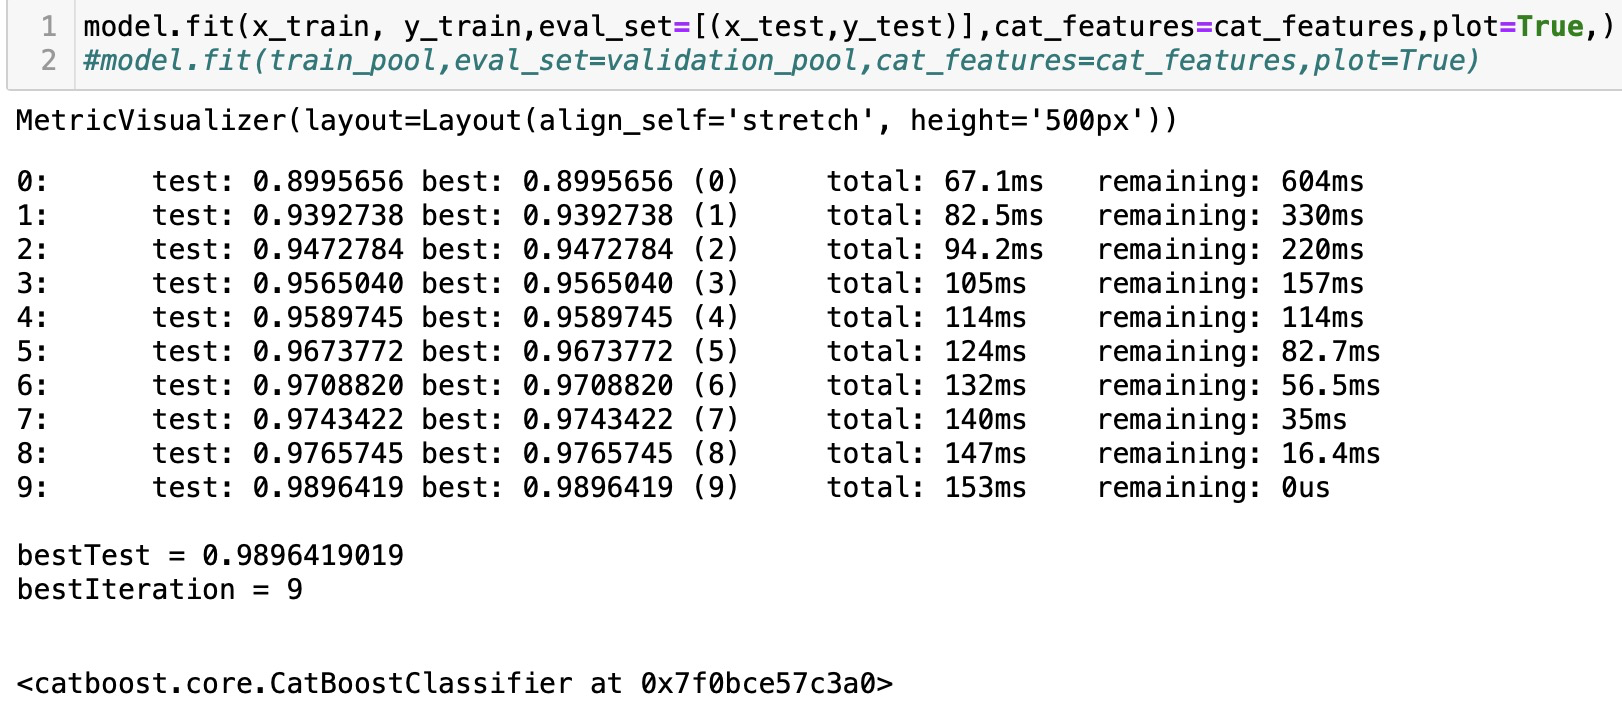
2.8 预测
python
pred_y = model.predict(x_test)
y_pred=[list(x).index(max(x)) for x in pred_y]
print("accuracy_score",accuracy_score(y_test,y_pred))
print('f1_score',f1_score(y_test, np.array(y_pred), average='weighted'))
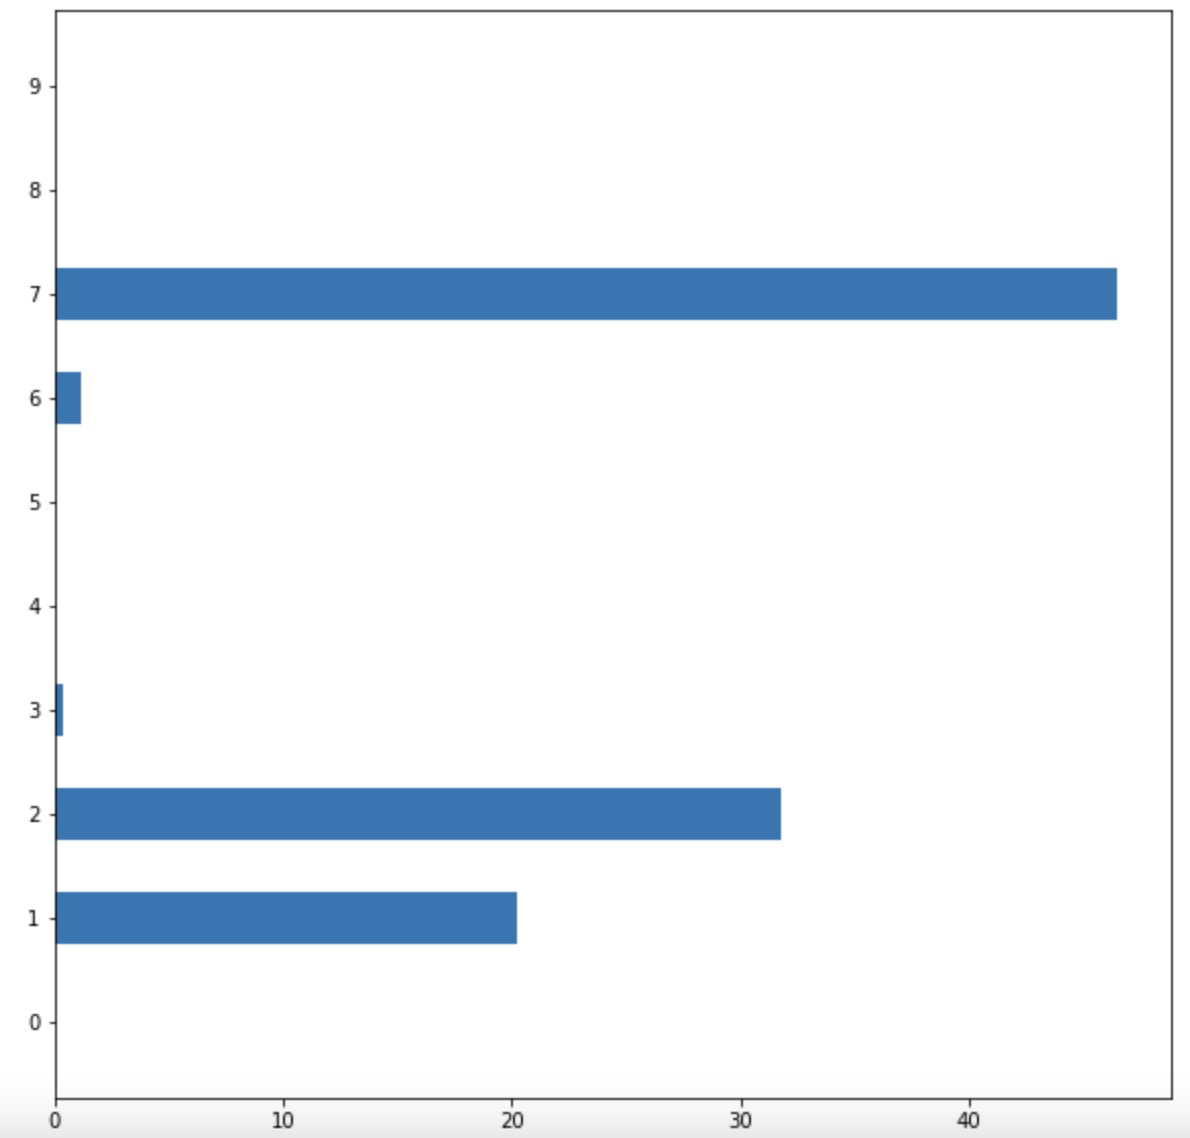
2.9 画图
python
import matplotlib.pyplot as plt
fea_ = model.feature_importances_
fea_name = ['0', '1', '2', '3', '4', '5', '6', '7', '8', '9']
plt.figure(figsize=(10, 10))
plt.barh(fea_name,fea_,height =0.5)
注意: 可以将fea_name = '0', '1', '2', '3', '4', '5', '6', '7', '8', '9'换成自己数据集中的特征名。
2.10 特征排序显示
python
import matplotlib.pyplot as plt
import numpy as np
fea_ = model.feature_importances_
print(fea_)
print(type(fea_))
fea_name = model.feature_names_
print(fea_name)
idx_name = {}
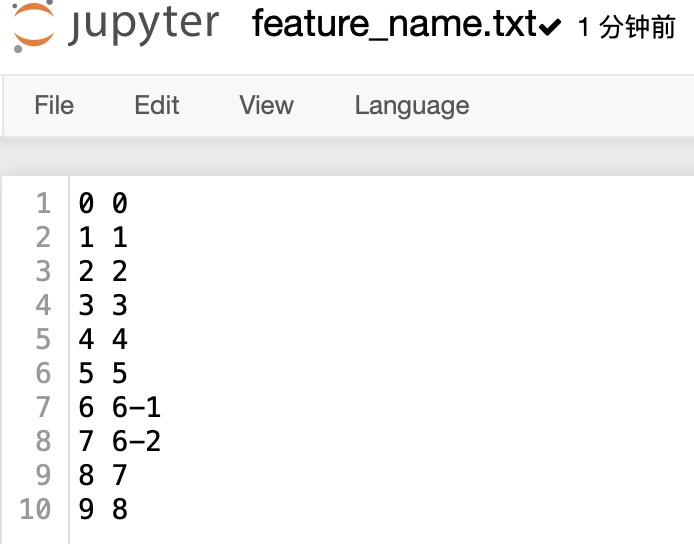
with open('./feature_name.txt', 'r') as rf:
    for line in rf:
        ln = line.strip().split(' ')
        idx_name[ln[0]] = ln[1]
print(idx_name)

# fea_arr = np.array(fea_)
idx = np.argsort(fea_)
print('---idx: ', idx)
print(idx.shape)
final_feat = []
final_name = []

for i in idx:
    print('--{0}   {1}'.format(i, fea_[i]))
    final_feat.append(fea_[i])
    final_name.append(idx_name[str(i)])
print(final_feat)
print(final_name)

fig, ax = plt.subplots(figsize=(11, 11))

# Horizontal Bar Plot
ax.barh(final_name, final_feat, height=0.5)

# Remove axes splines
for s in ['top', 'bottom', 'left', 'right']:
    ax.spines[s].set_visible(False)

# Add x, y gridlines
ax.grid(b=True, color='grey',
        linestyle='-.', linewidth=0.5,
        alpha=0.2)
# Add annotation to bars
for i in ax.patches:
    plt.text(i.get_width()+0.2, i.get_y()+0.2,
             str(round((i.get_width()), 2)),
             fontsize=9, fontweight='bold',
             color='black')
ax.set_title('feature importance' )
plt.show()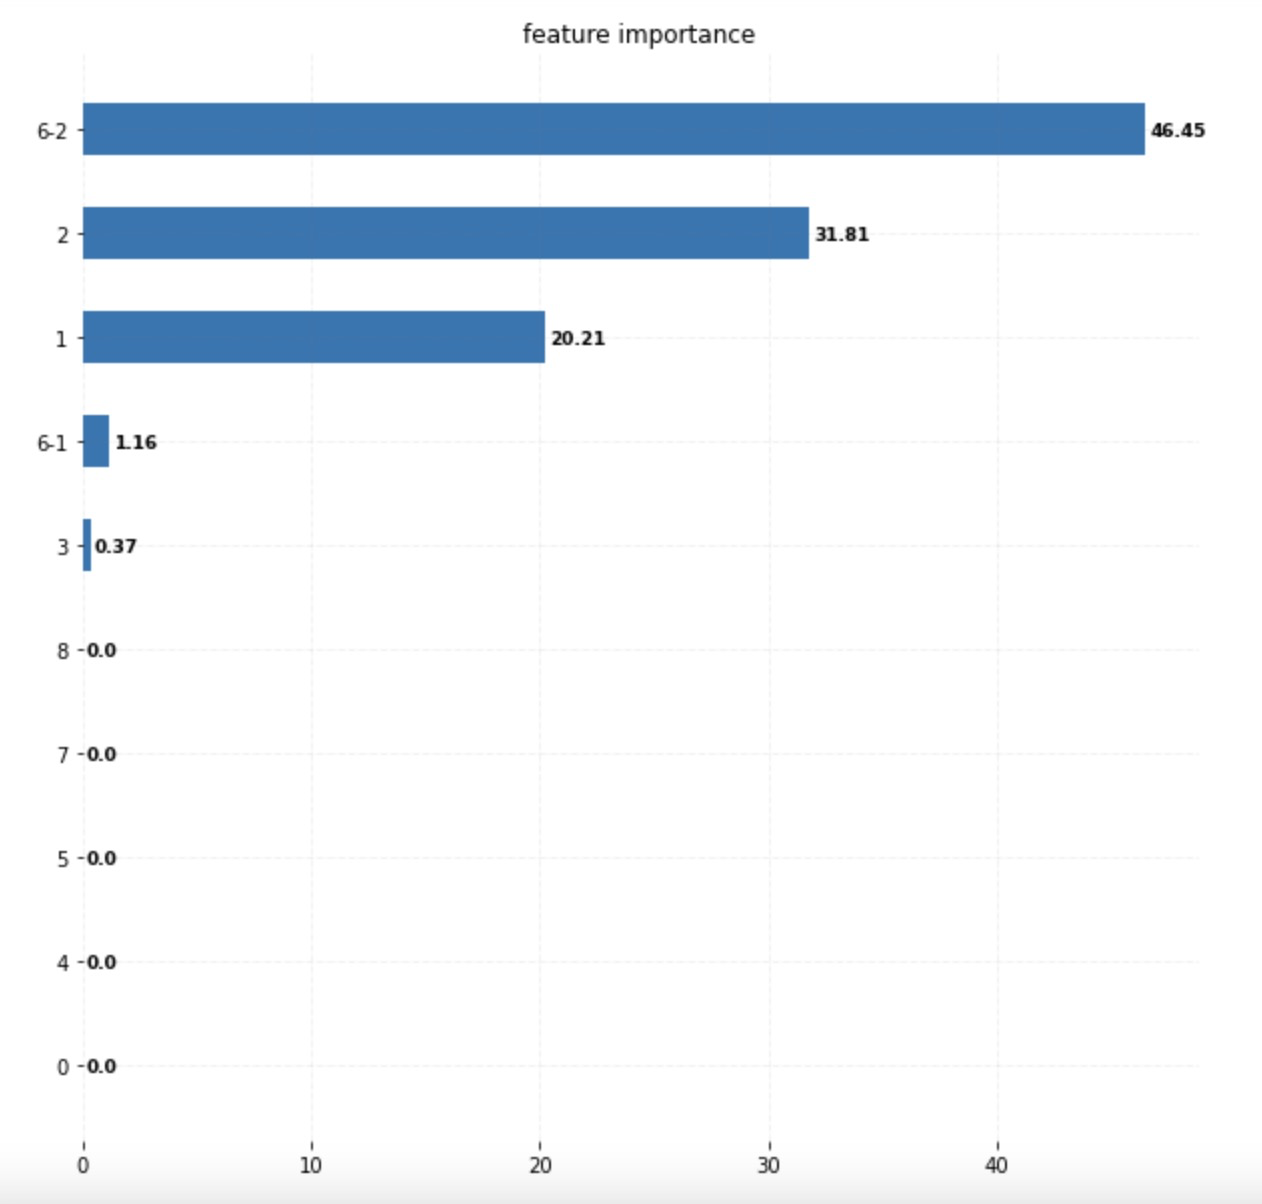
注意:文件格式
Reference: