找到ECharts中路径图。
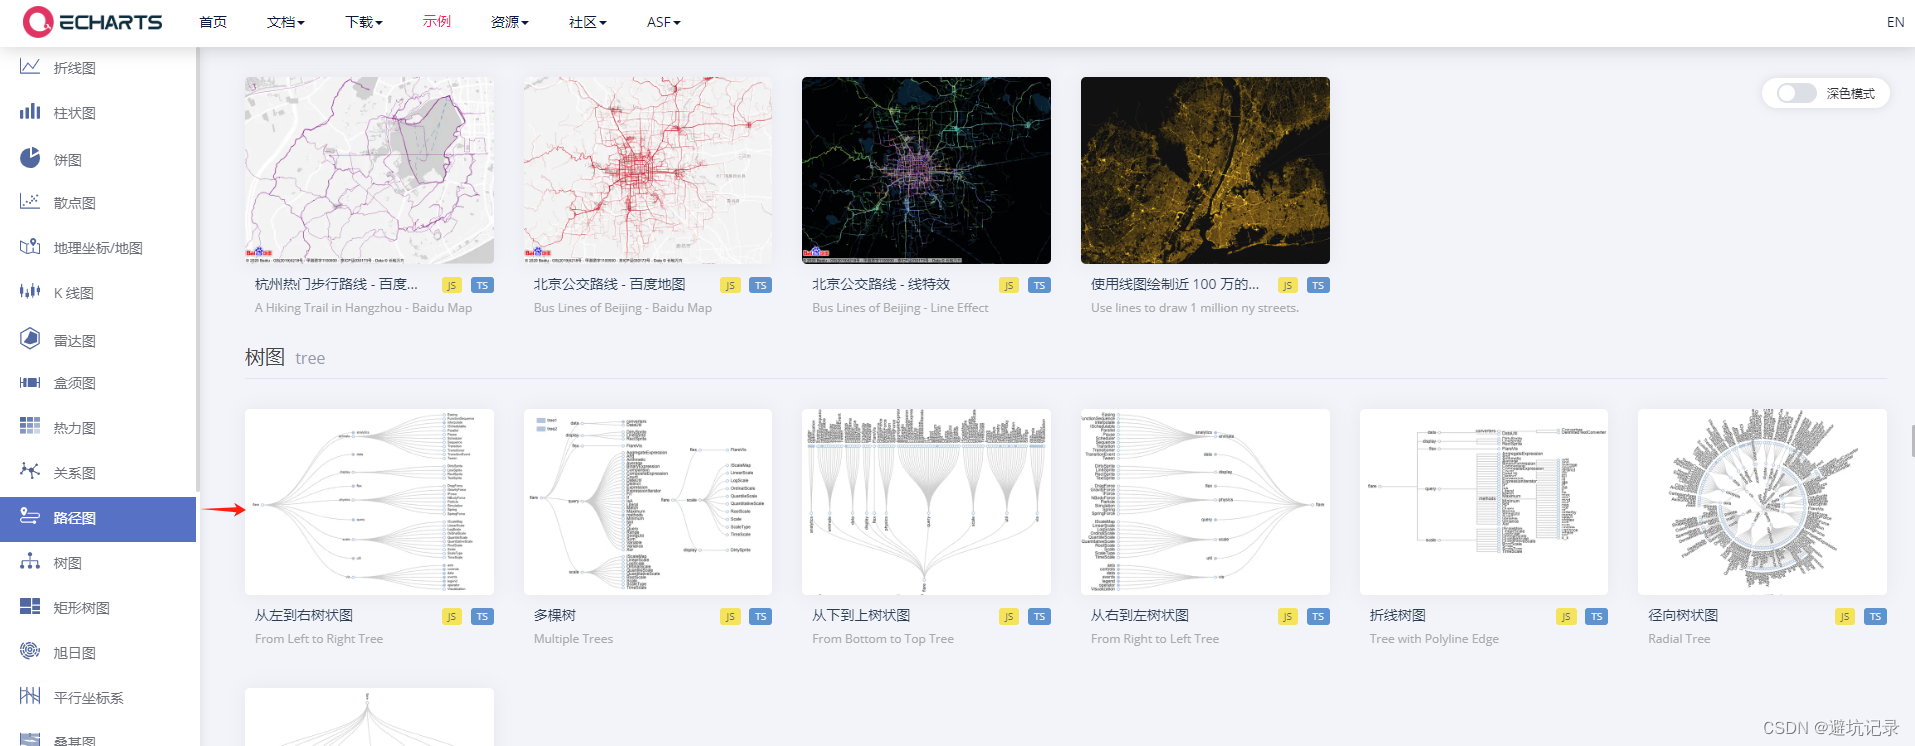
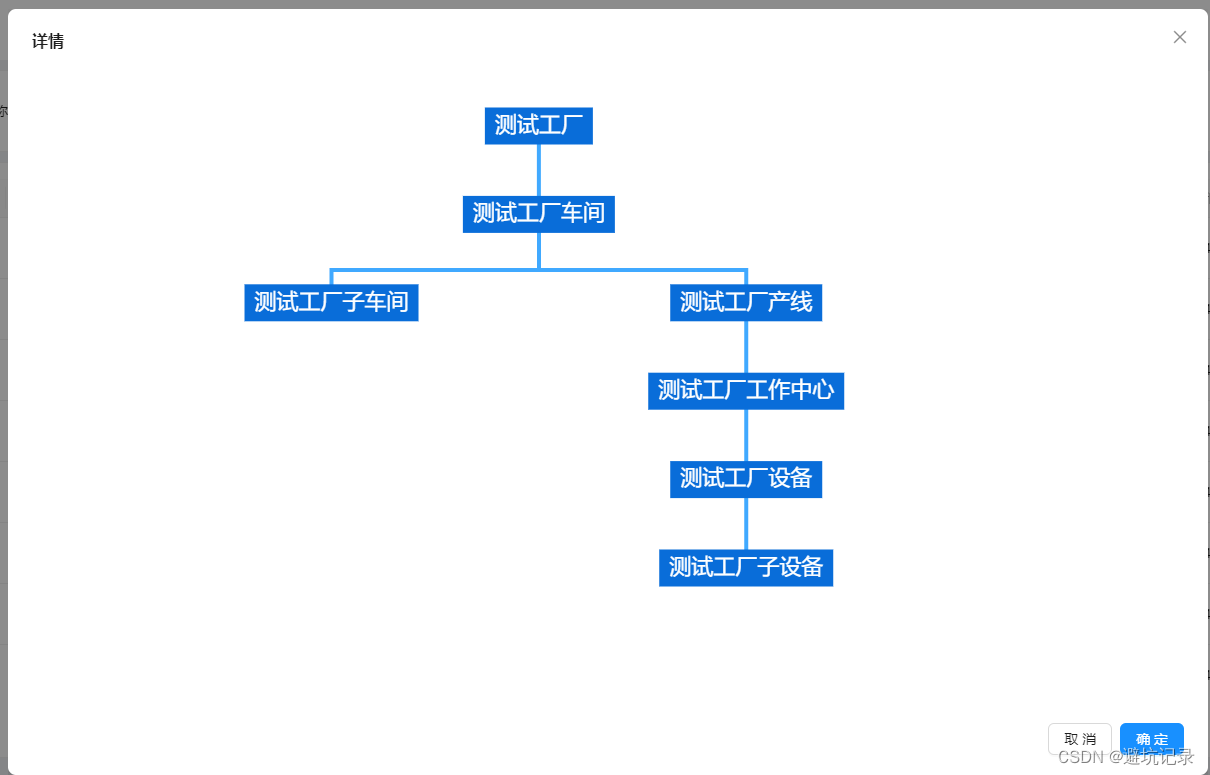
然后开始爆改。
html
<div id={'org-' + name} style={{ width: '100%', height: 650, display: 'flex', justifyContent: 'center' }}></div>
TypeScript
// data的数据格式
interface ChartData {
  name: string;
  value: number;
  children: ChartData[];
}
TypeScript
const treeDepth = useRef(0);
const initChart = () => {
    const demoId = document.getElementById('org-' + name);
    let myChart = echarts.getInstanceByDom(demoId);
    if (!myChart) {
      myChart = echarts.init(demoId);
      const options = {
        tooltip: {
          trigger: 'item',
          triggerOn: 'mousemove',
          formatter: function (params: any) {
            // 获取当前节点的所有父级名称
            const parentNames = params.treeAncestors.map((node: any, index: number) =>                 (index > 0 ? node.name : null)).filter((item: string) => item);
            // 返回父级名称,不包含值
            return parentNames.join('<br/> ');
          },
        },
        series: [
          {
            type: 'tree',
            id: 0,
            name: '工厂模型',
            layout: 'orthogonal', // 水平
            orient: 'TB', // 从上到下
            data,
            top: '10%',
            left: '8%',
            bottom: '22%',
            right: '20%',
            edgeShape: 'polyline',
            edgeForkPosition: '63%',
            initialTreeDepth: treeDepth.current,
            lineStyle: {
              // 每个节点所对应的文本标签的样式
              width: 4,
              color: '#40a9ff',
            },
            label: {
              // 每个节点所对应的文本标签的样式
              backgroundColor: '#096dd9',
              verticalAlign: 'middle',
              align: 'center',
              fontSize: 22,
              padding: [10, 10, 5, 10],
              color: '#fff',
            },
            leaves: {
              // 叶子节点的特殊配置
              label: {
                verticalAlign: 'middle',
                align: 'center',
              },
            },
            emphasis: {
              focus: 'descendant',
            },
            expandAndCollapse: true,
            animationDuration: 550,
            animationDurationUpdate: 750,
          },
        ],
      };
      myChart.setOption(options, true);
    }
  };


  useEffect(() => {
    initChart();
  }, []);