题目
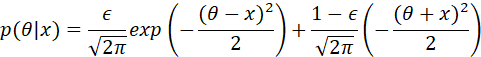
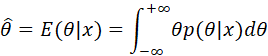
对于后验PDF
画出 和
和 时的PDF。然后,对于同样的
 值,求 MMSE和 MAP 的估计量。
解答
根据题目条件,通过Matlab,画出两个函数的概率密度函数图像,其中的x设定为2.
clc, clear, close all;
x=2;
e=0.5;
theat=-10:0.01:10;
p_theat=e/sqrt(2*pi)*exp(-0.5*(theat-x).^2)+(1-e)/sqrt(2*pi)*exp(-0.5*(theat+x).^2);
figure(1)
plot(theat,p_theat)
hold on
xline(x);
xline(-x)
hold off
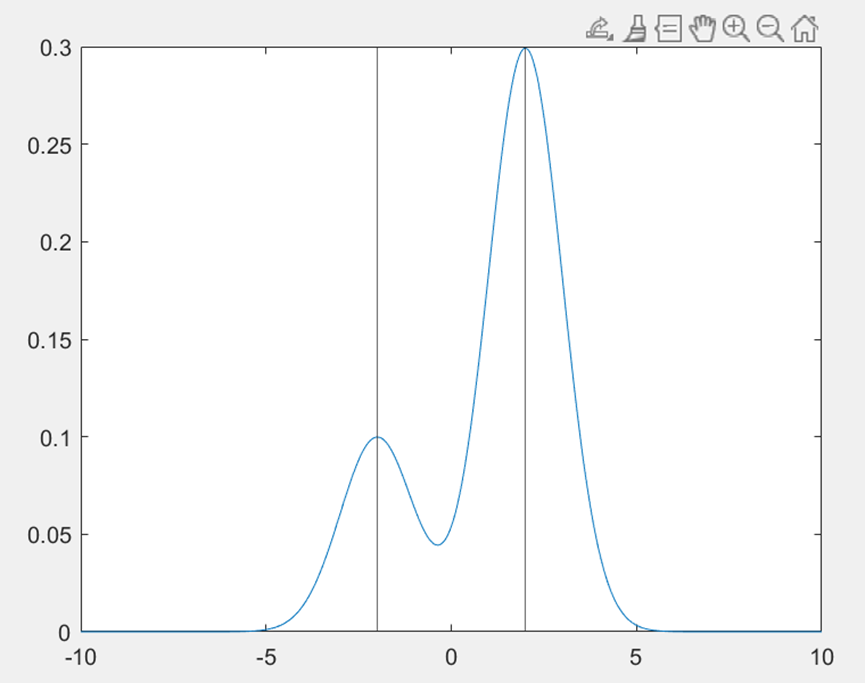
e=0.75;
p_theat=e/sqrt(2*pi)*exp(-0.5*(theat-x).^2)+(1-e)/sqrt(2*pi)*exp(-0.5*(theat+x).^2);
figure(2)
plot(theat,p_theat)
hold on
xline(x);
xline(-x)
hold off 时,做出图案:
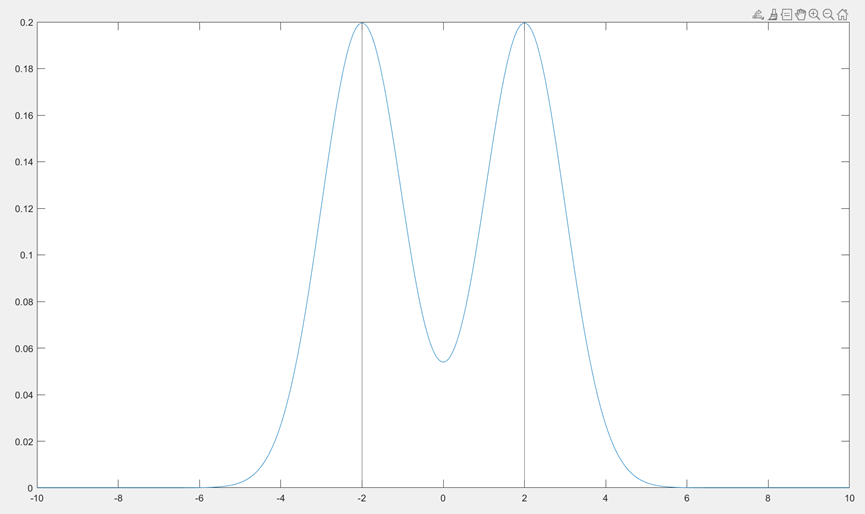
此时可以发现, 是个偶函数,因此:
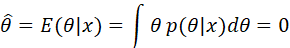
也就是此时的 的MMSE估计量为0。
而对 的观察可知,该函数存在两个极值点,所以
 的MMSE估计量不唯一:

当 时
时
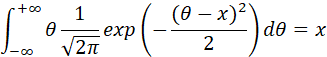
计算MMSE:


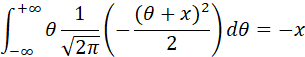
上式的积分,分别是 和
和 的数学期望,因此可以得到:
因此:当时

此时代入 也验证了上半题目的结论。
而观察图像的特性,可以发现该函数存在一个极值点,也就是 的MAP估计量为:

经过这个例子分析,可以发现,MAP估计量不一定等于MMSE估计量。
书上举得联合分布是高斯,先验也是高斯情况下两者相等,只是特例。