本次博客基于监控平台zabbix介绍与部署-CSDN博客的环境下进行的
1、安装grafana并启动
添加一台虚拟机20.0.0.30
(1)系统初始化
[root@zx3 ~]# systemctl stop firewalld
[root@zx3 ~]# setenforce 0
[root@zx3 ~]#
(2)安装并启动
[root@zx3 ~]# cd /opt/
[root@zx3 opt]# ls
grafana-enterprise-9.4.7-1.x86_64.rpm rh
[root@zx3 opt]# yum localinstall -y grafana-enterprise-9.4.7-1.x86_64.rpm
[root@zx3 opt]# systemctl enable --now grafana-server.service
Created symlink from /etc/systemd/system/multi-user.target.wants/grafana-server.service to /usr/lib/systemd/system/grafana-server.service.
[root@zx3 opt]# netstat -lntp | grep 3000
tcp6 0 0 :::3000 :::* LISTEN 8047/grafana
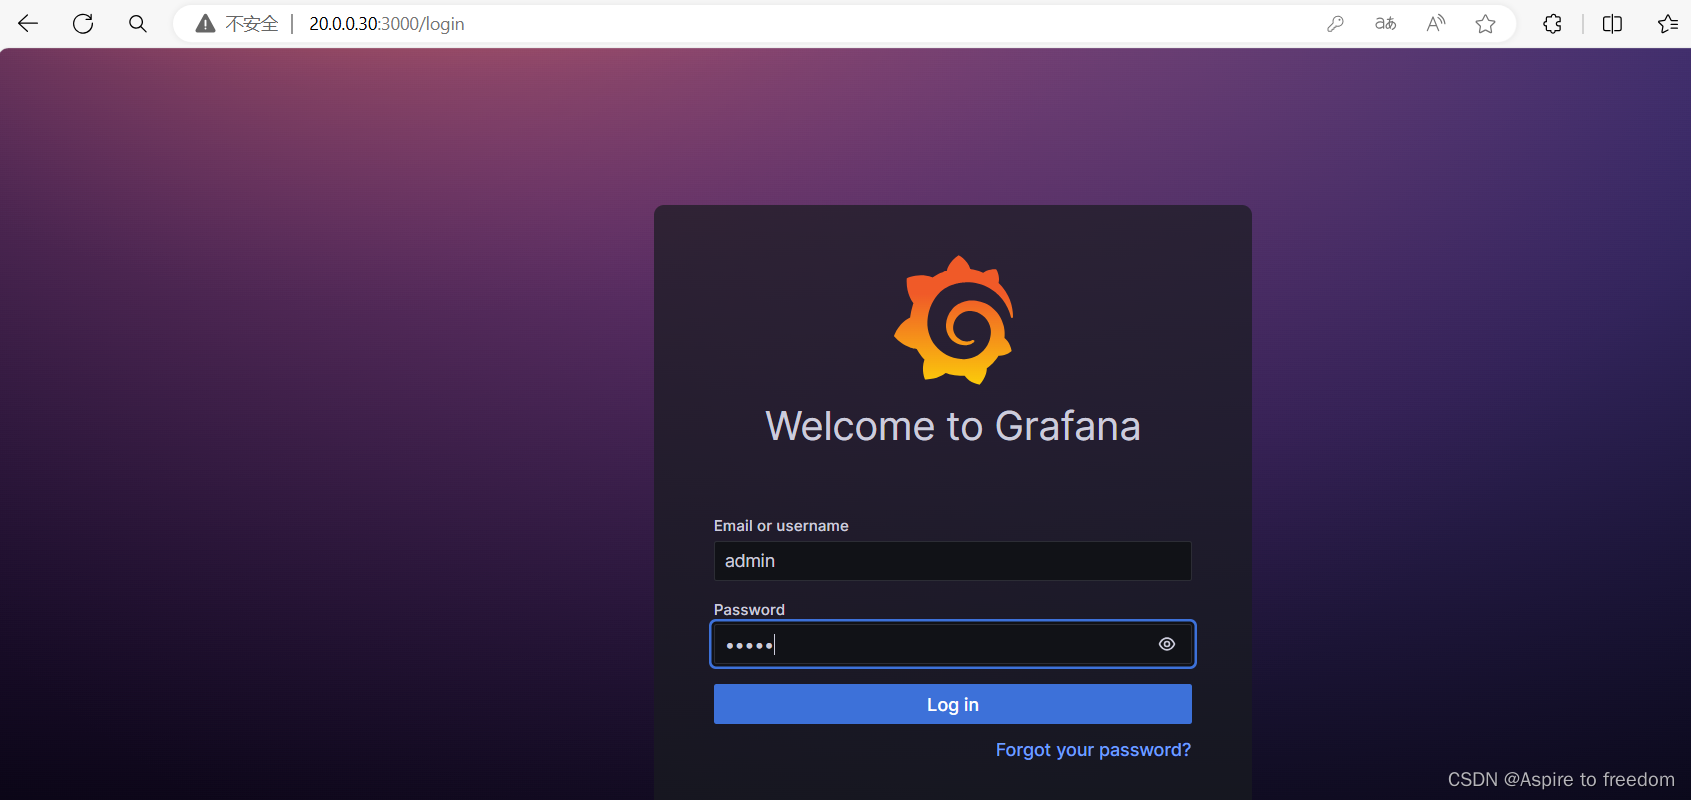
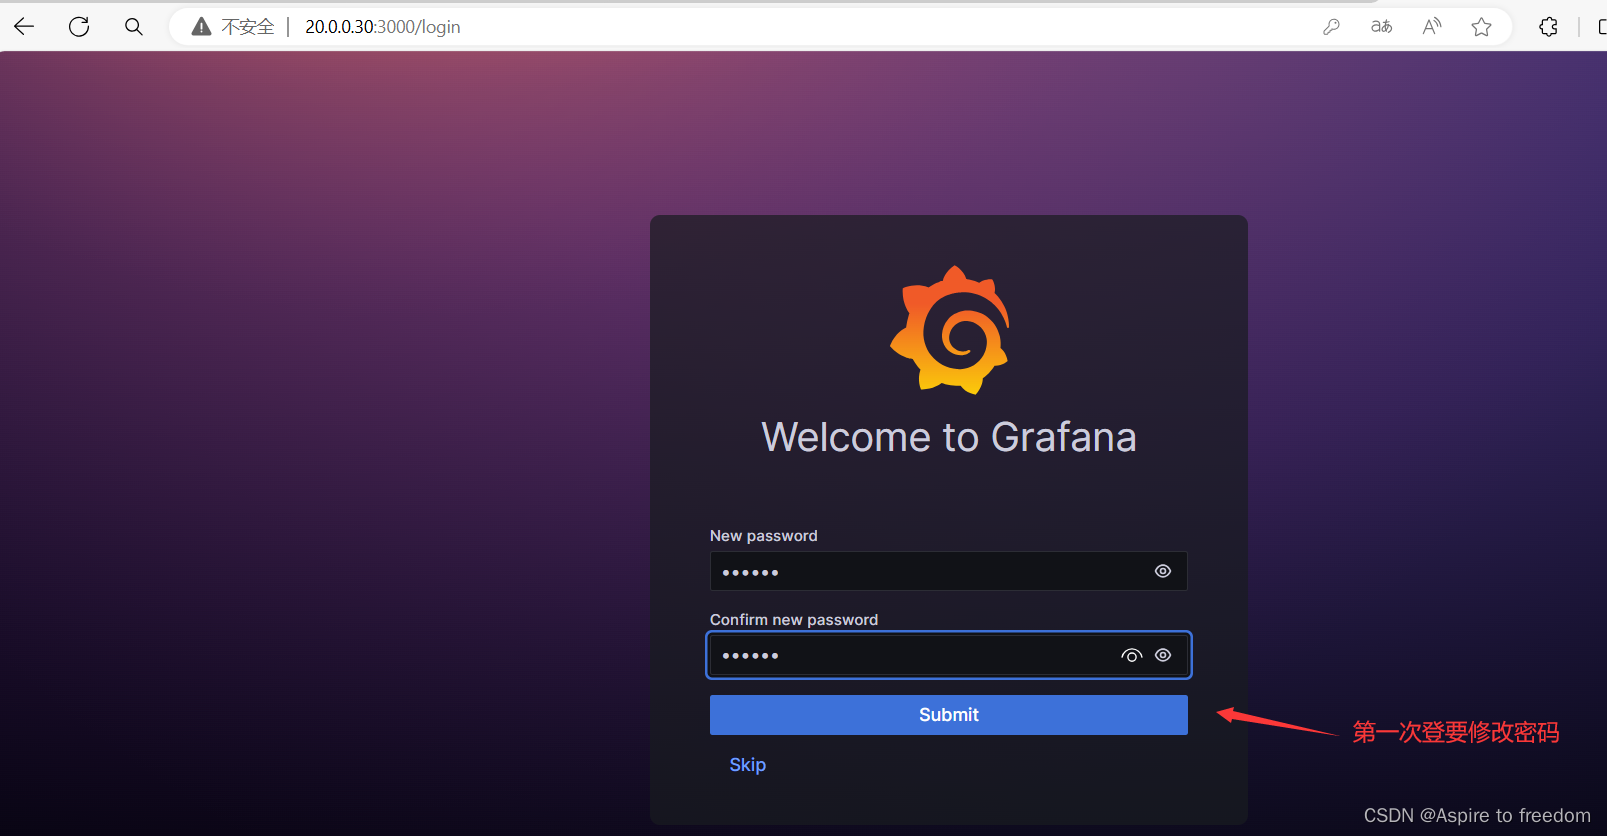
[root@zx3 opt]#2、浏览器访问
账号/密码:admin / admin
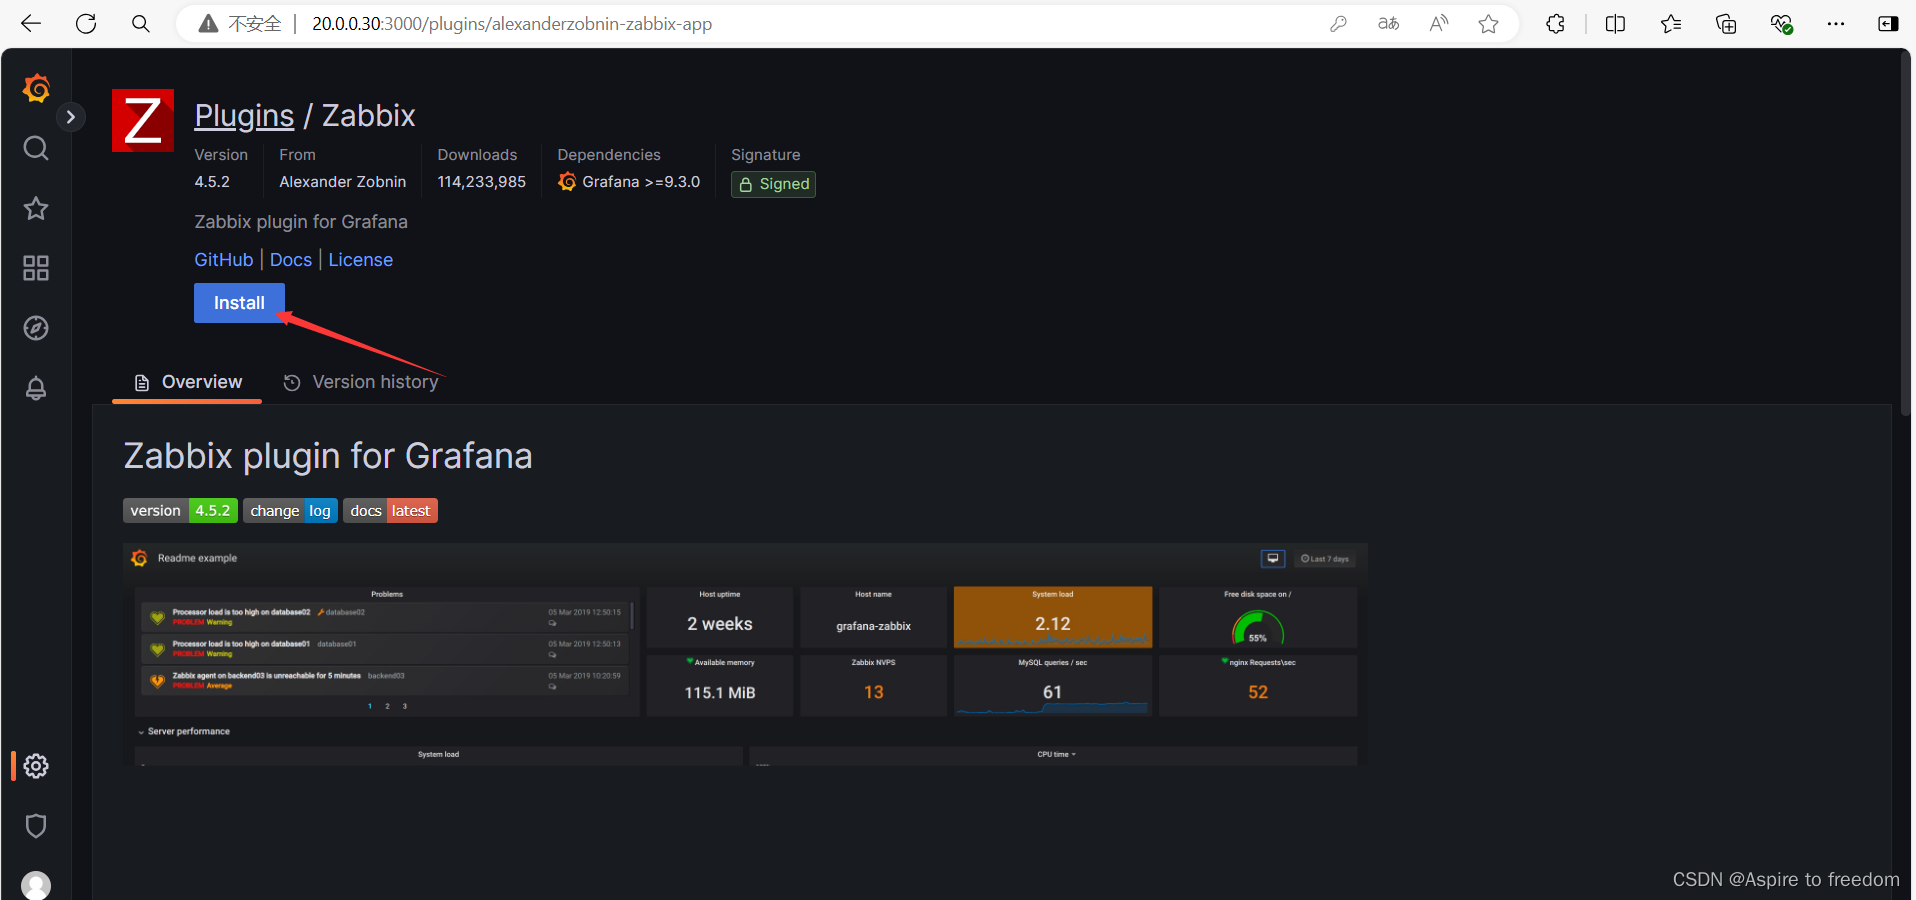
安装启动zabbix
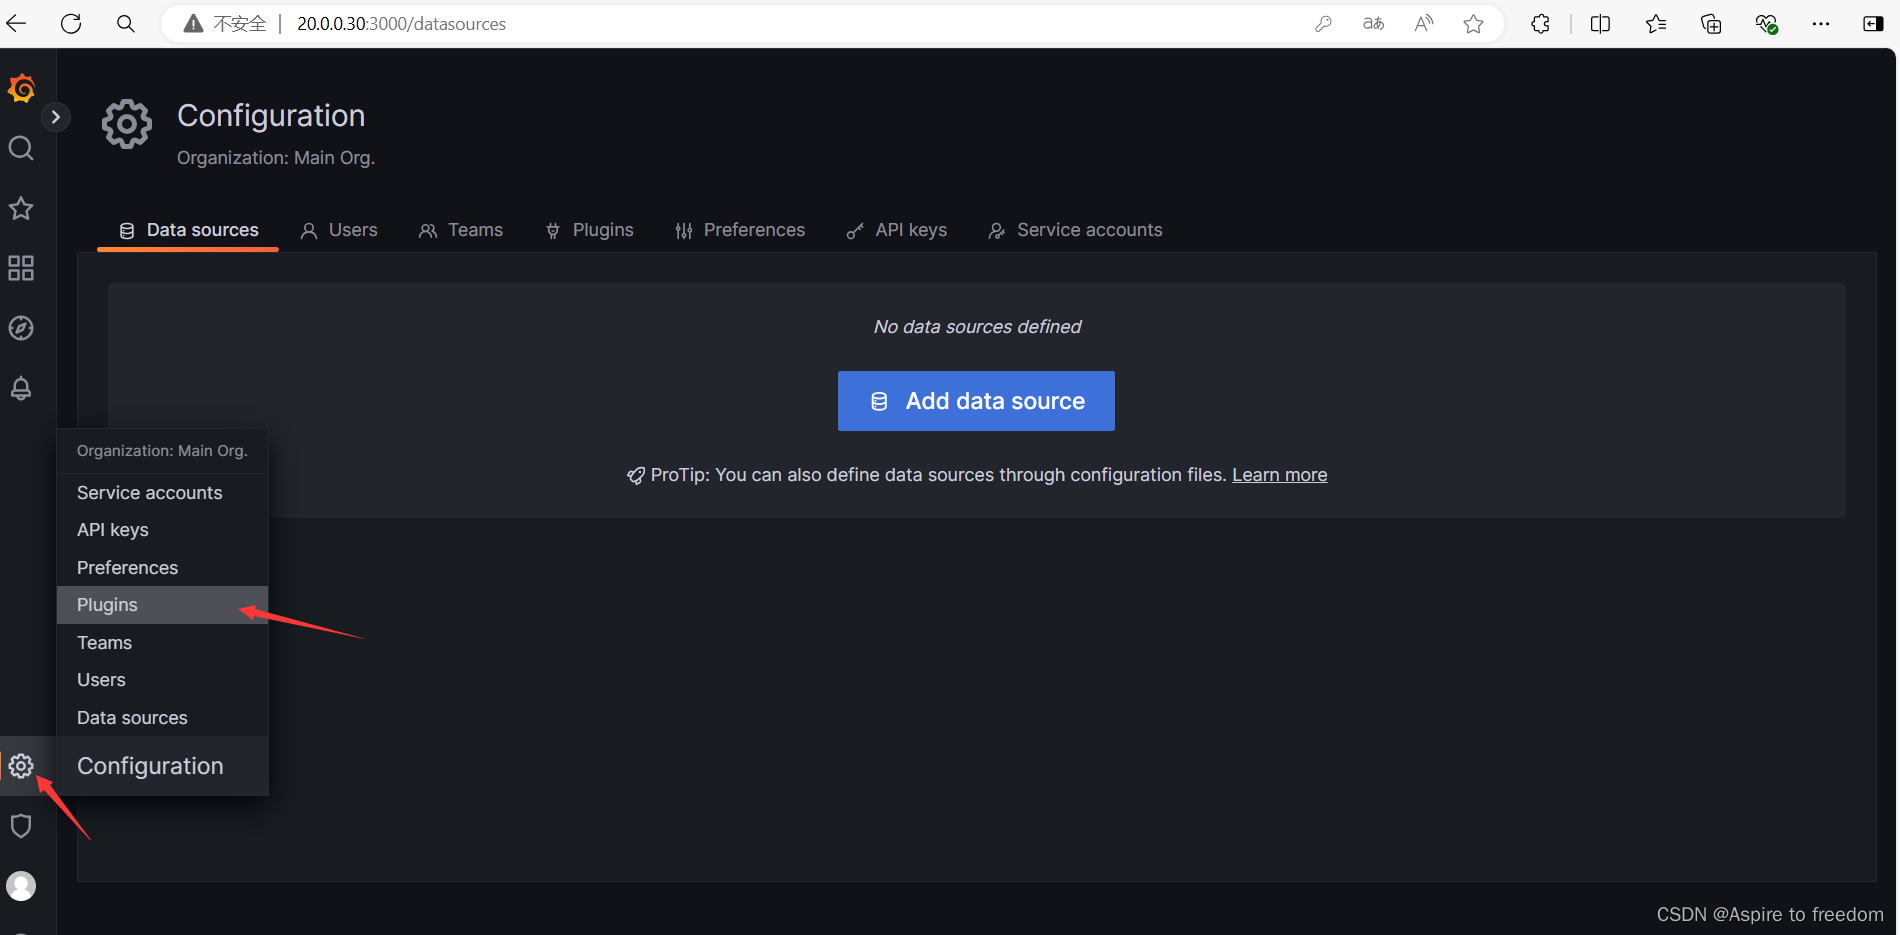
搜索zabbix并进入
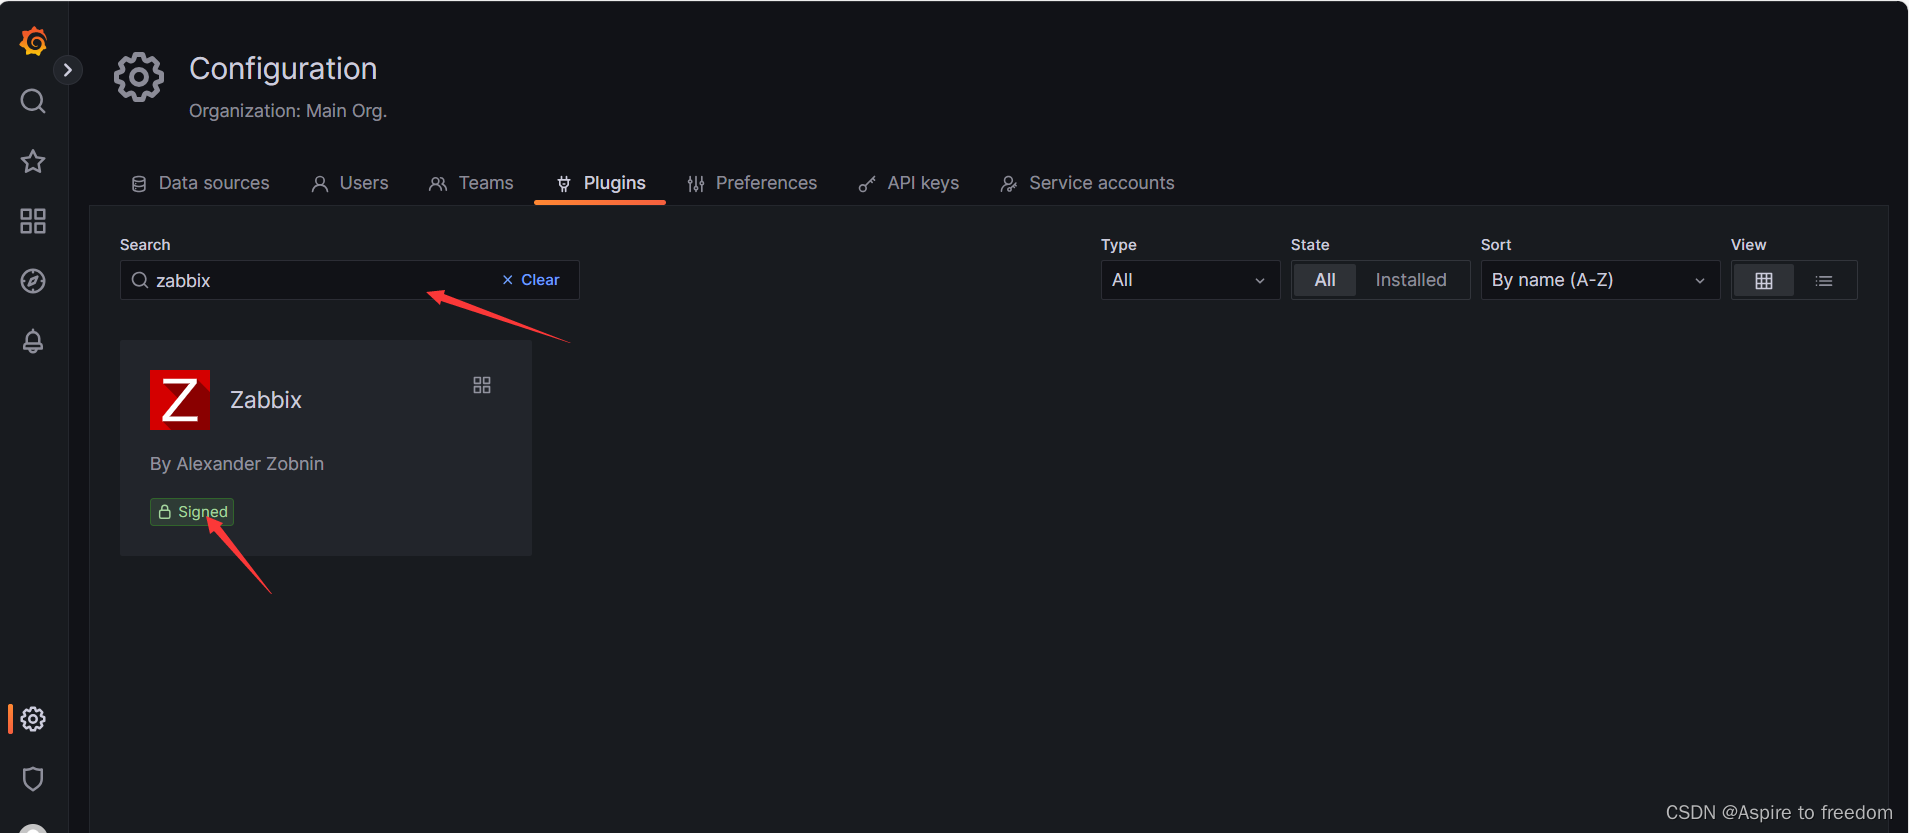
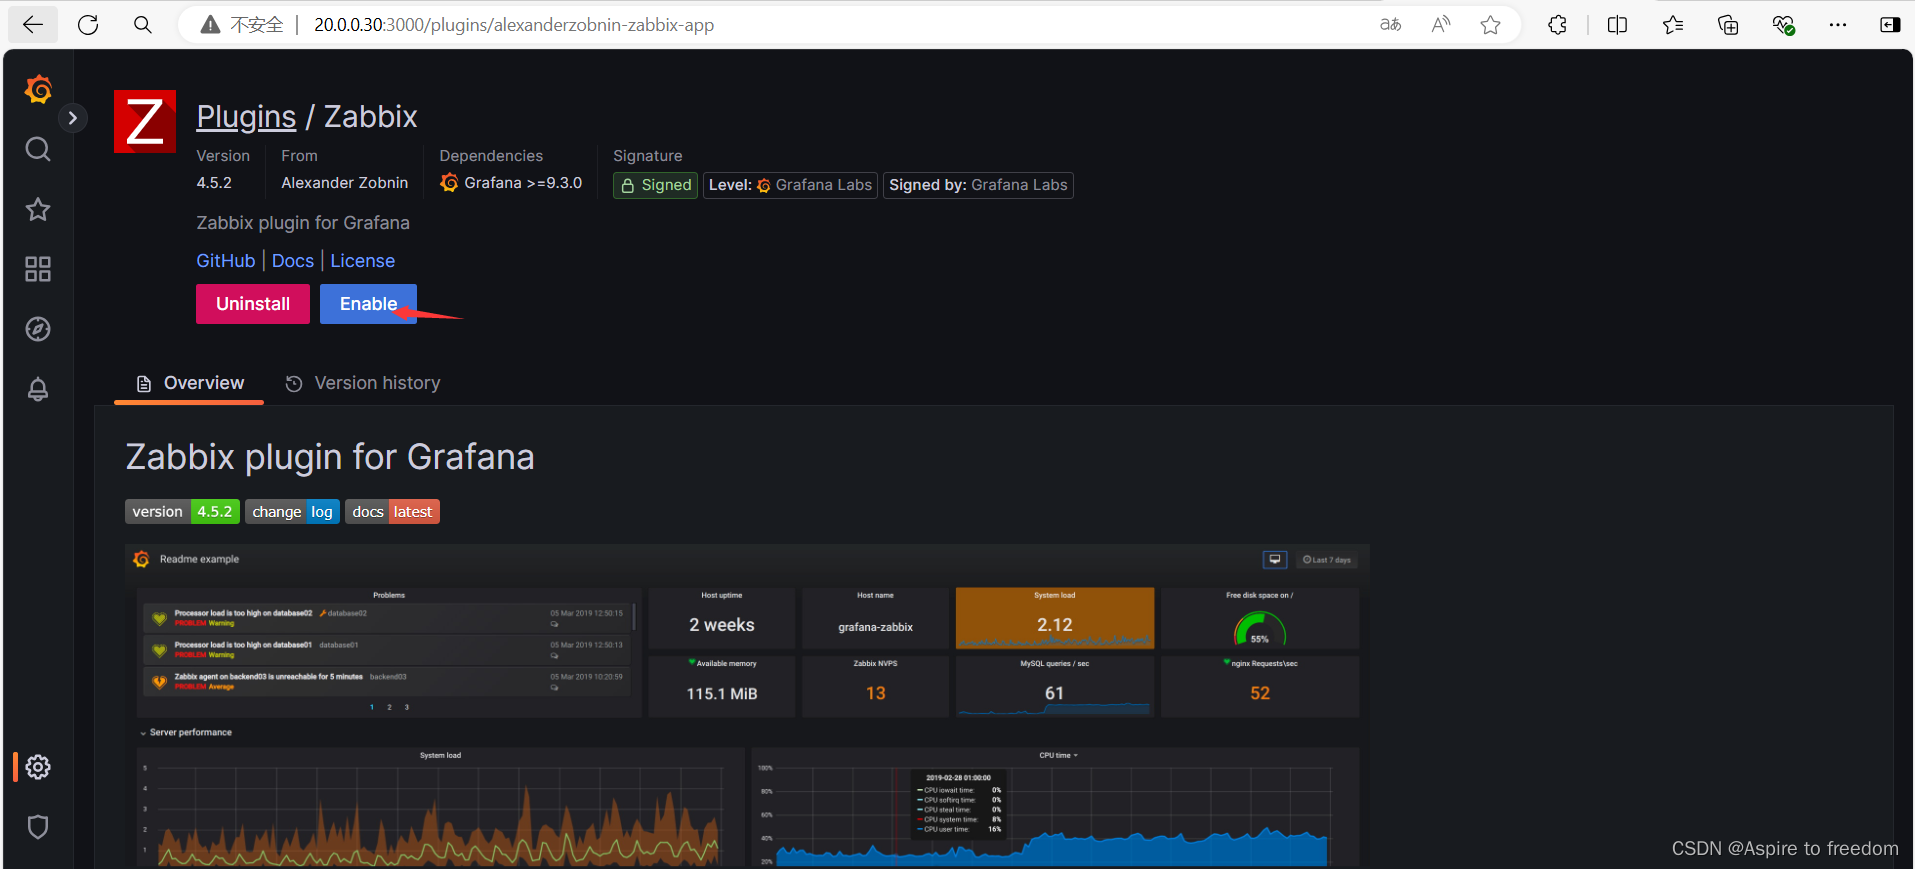
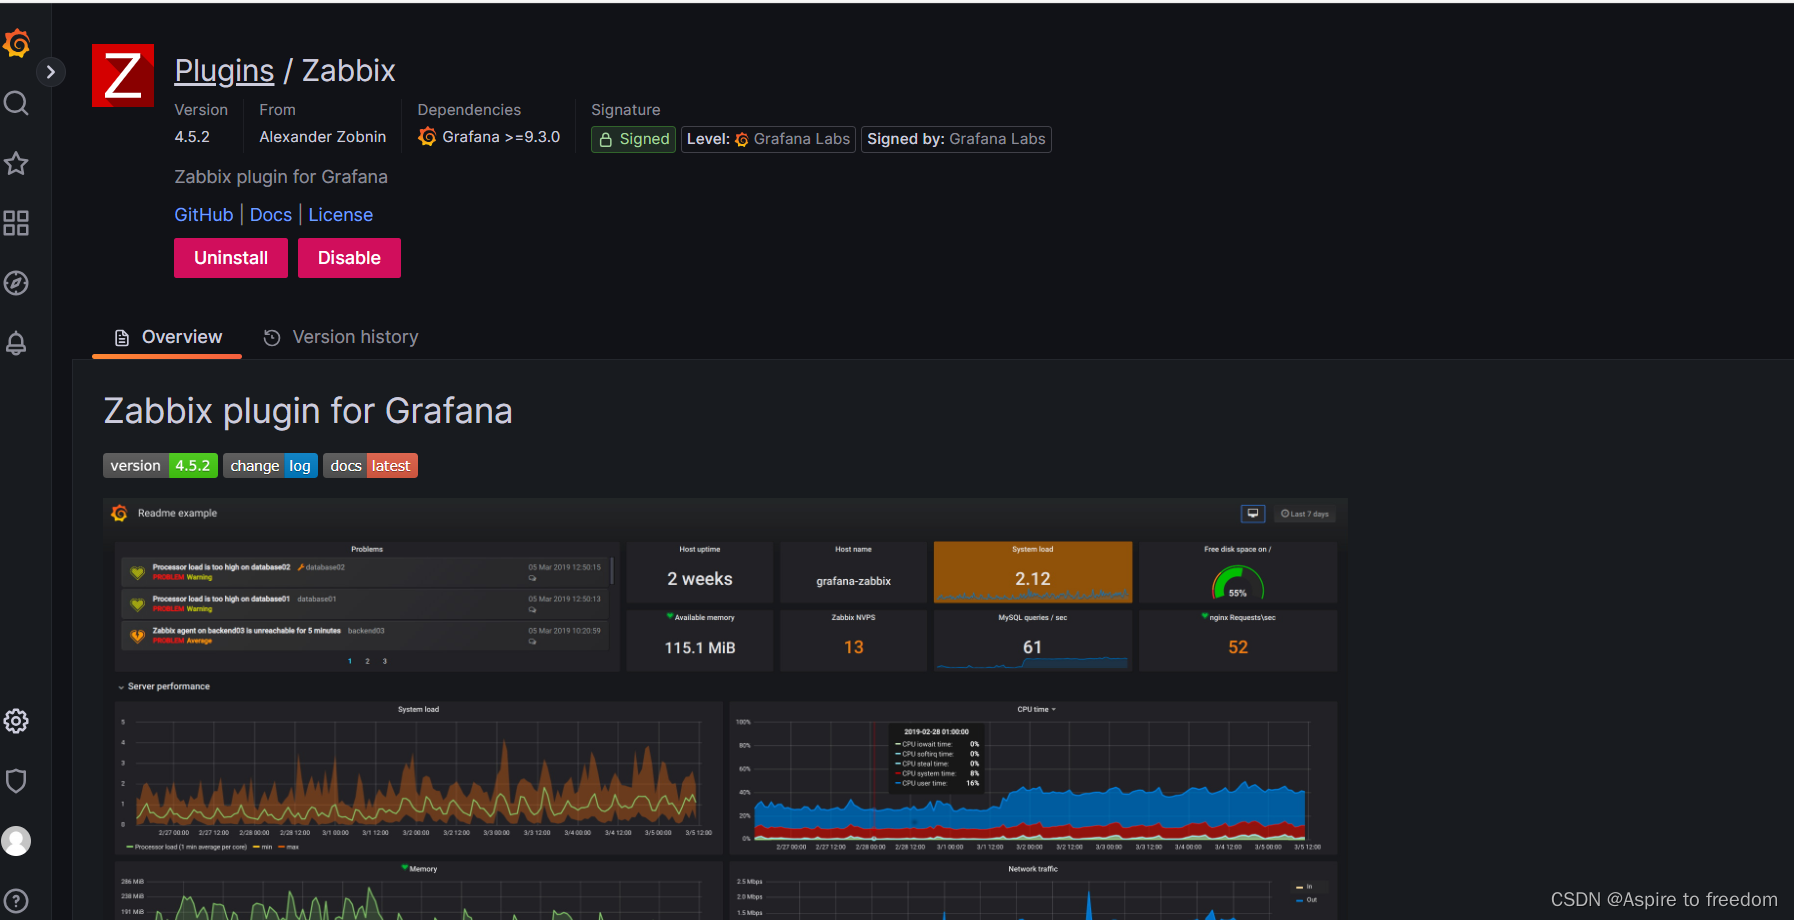
下载完刷新页面,点击enable开启
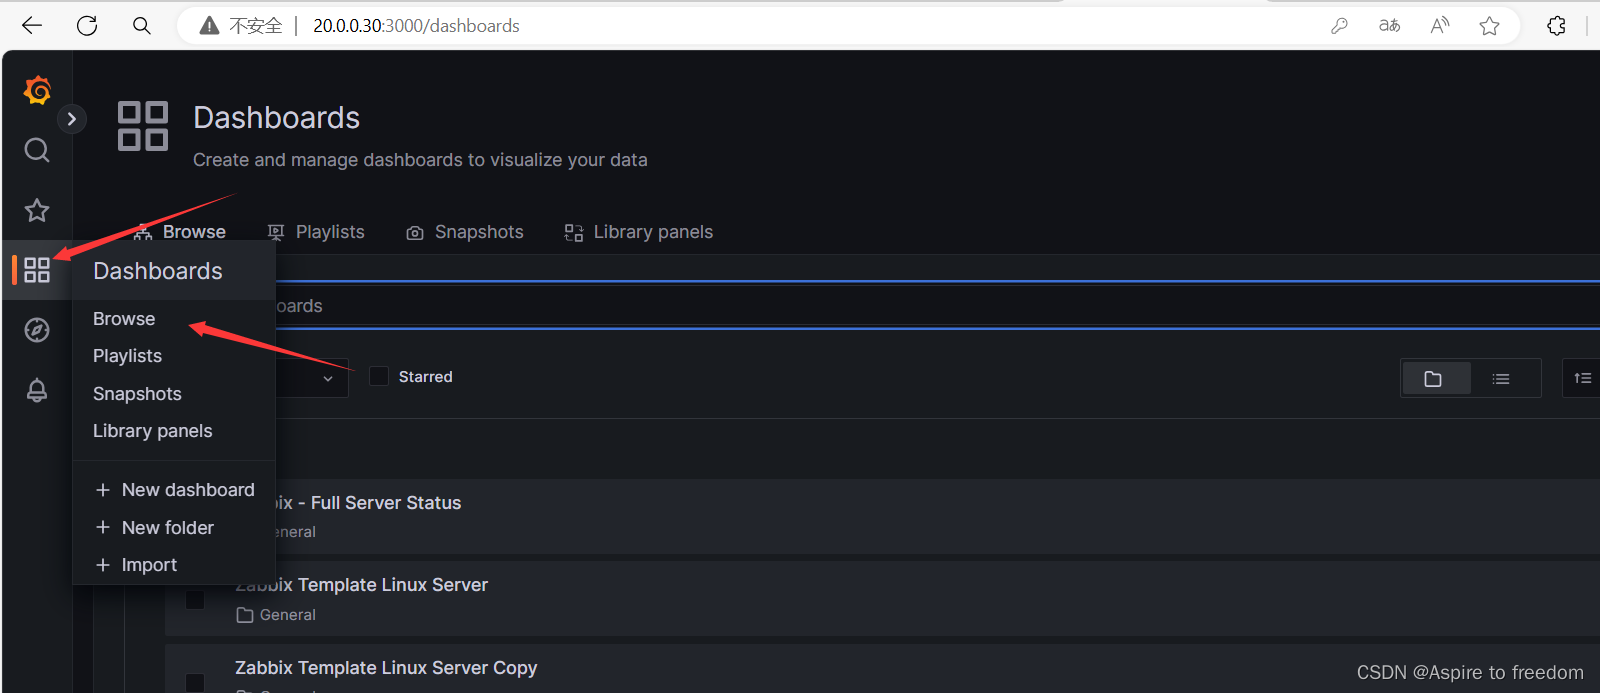
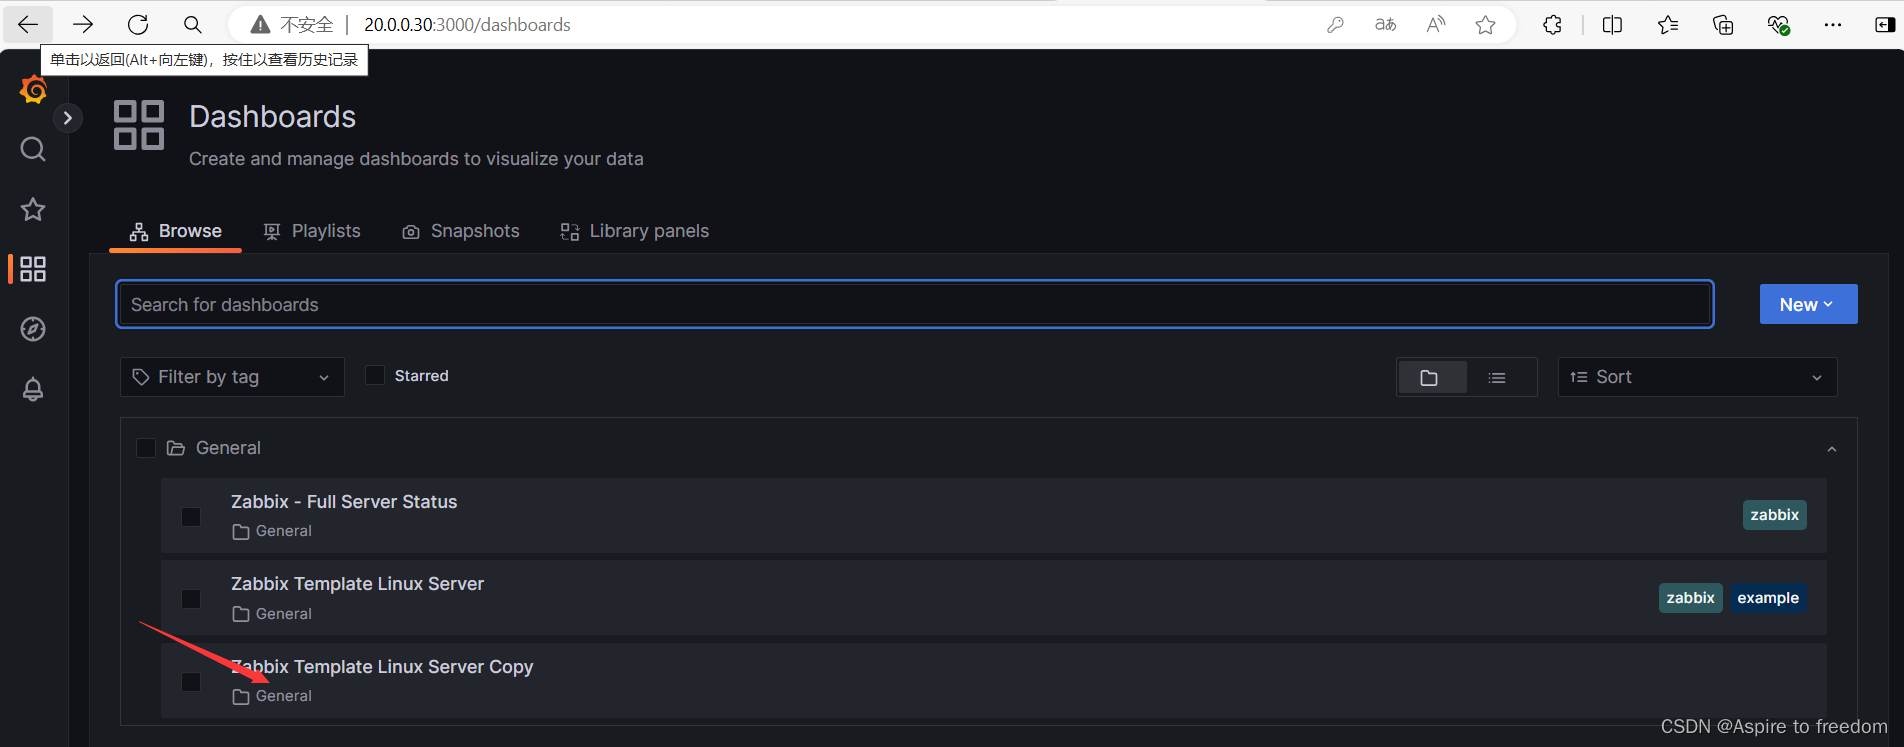
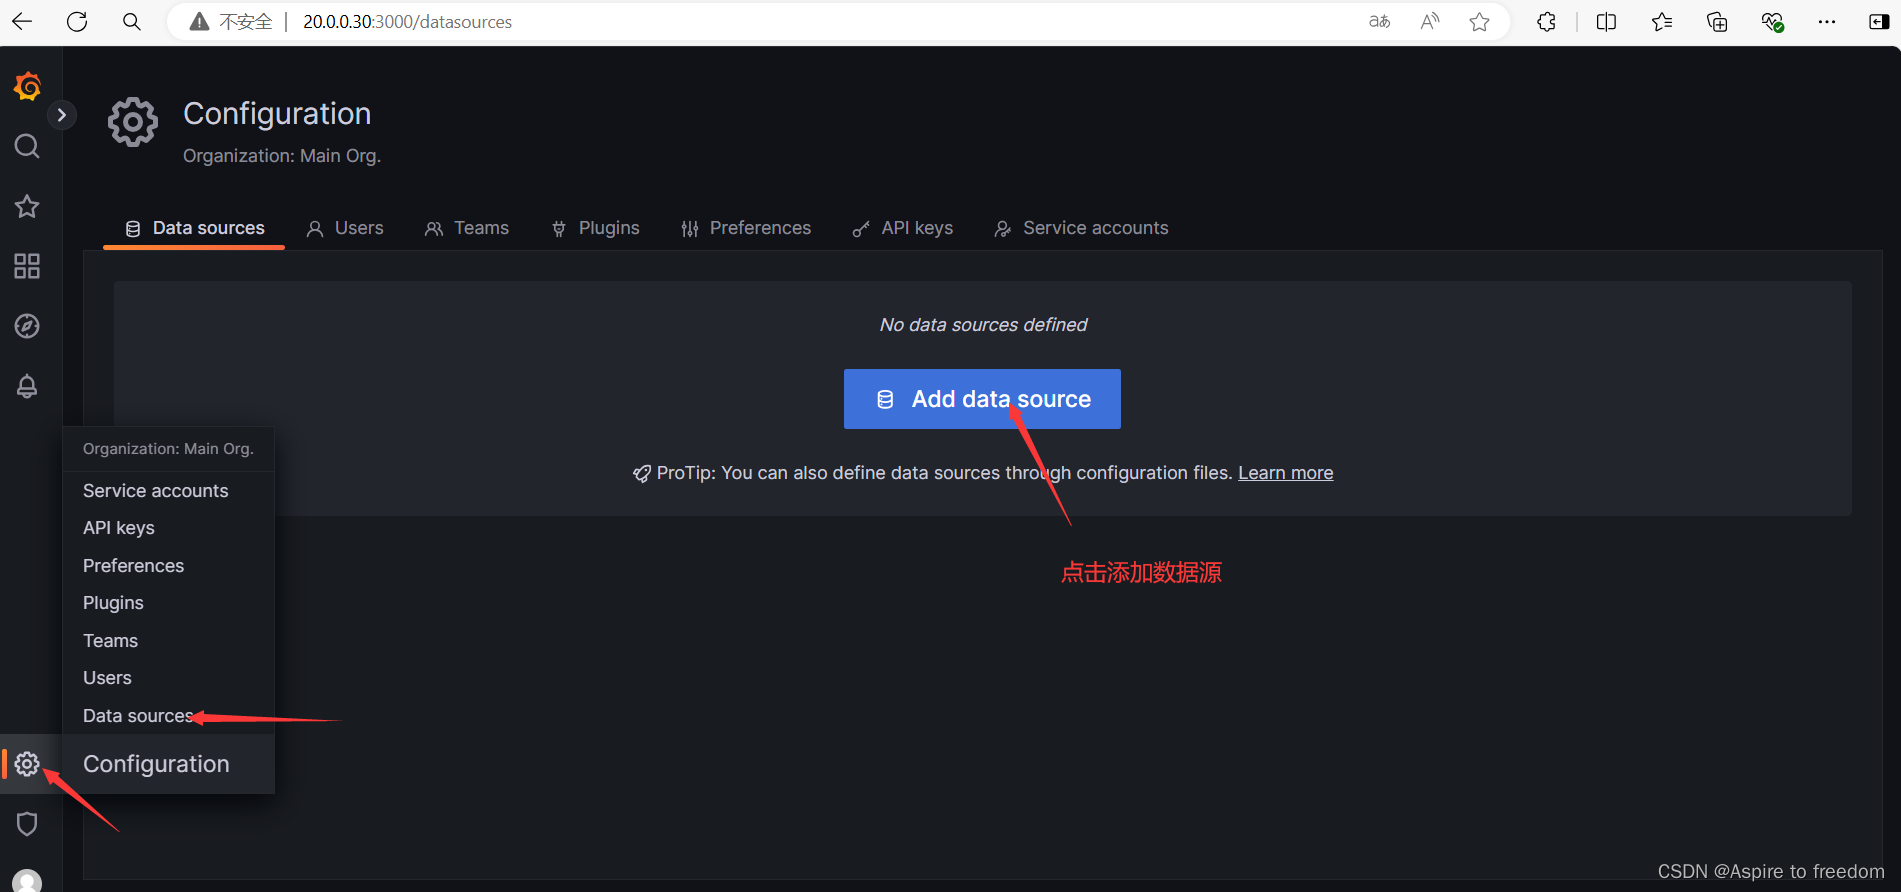
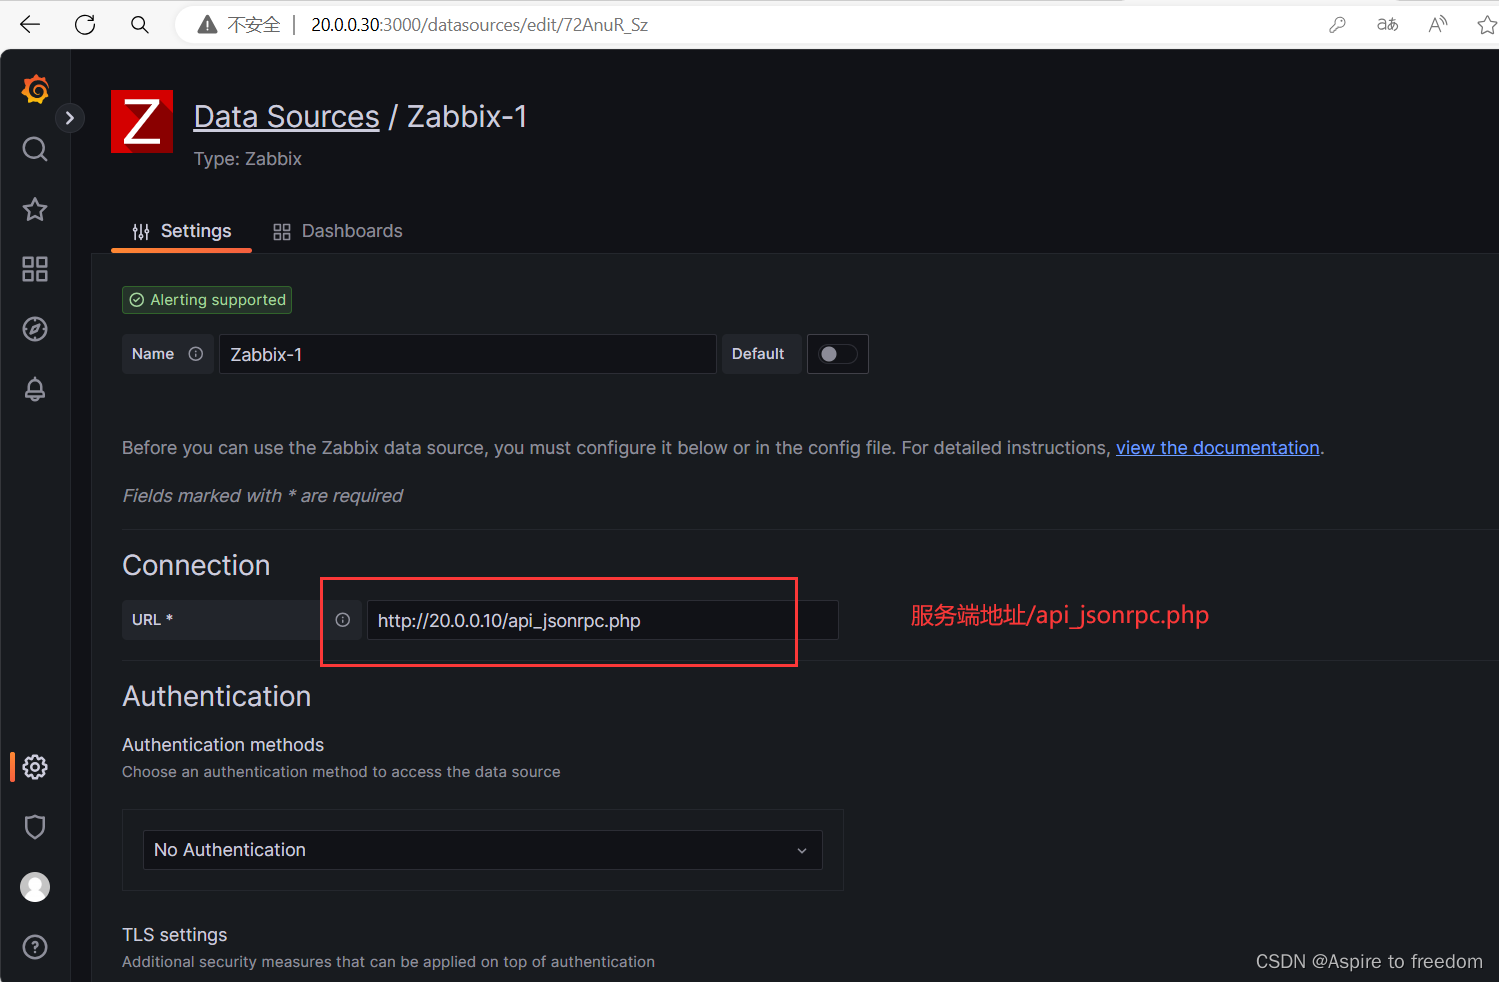
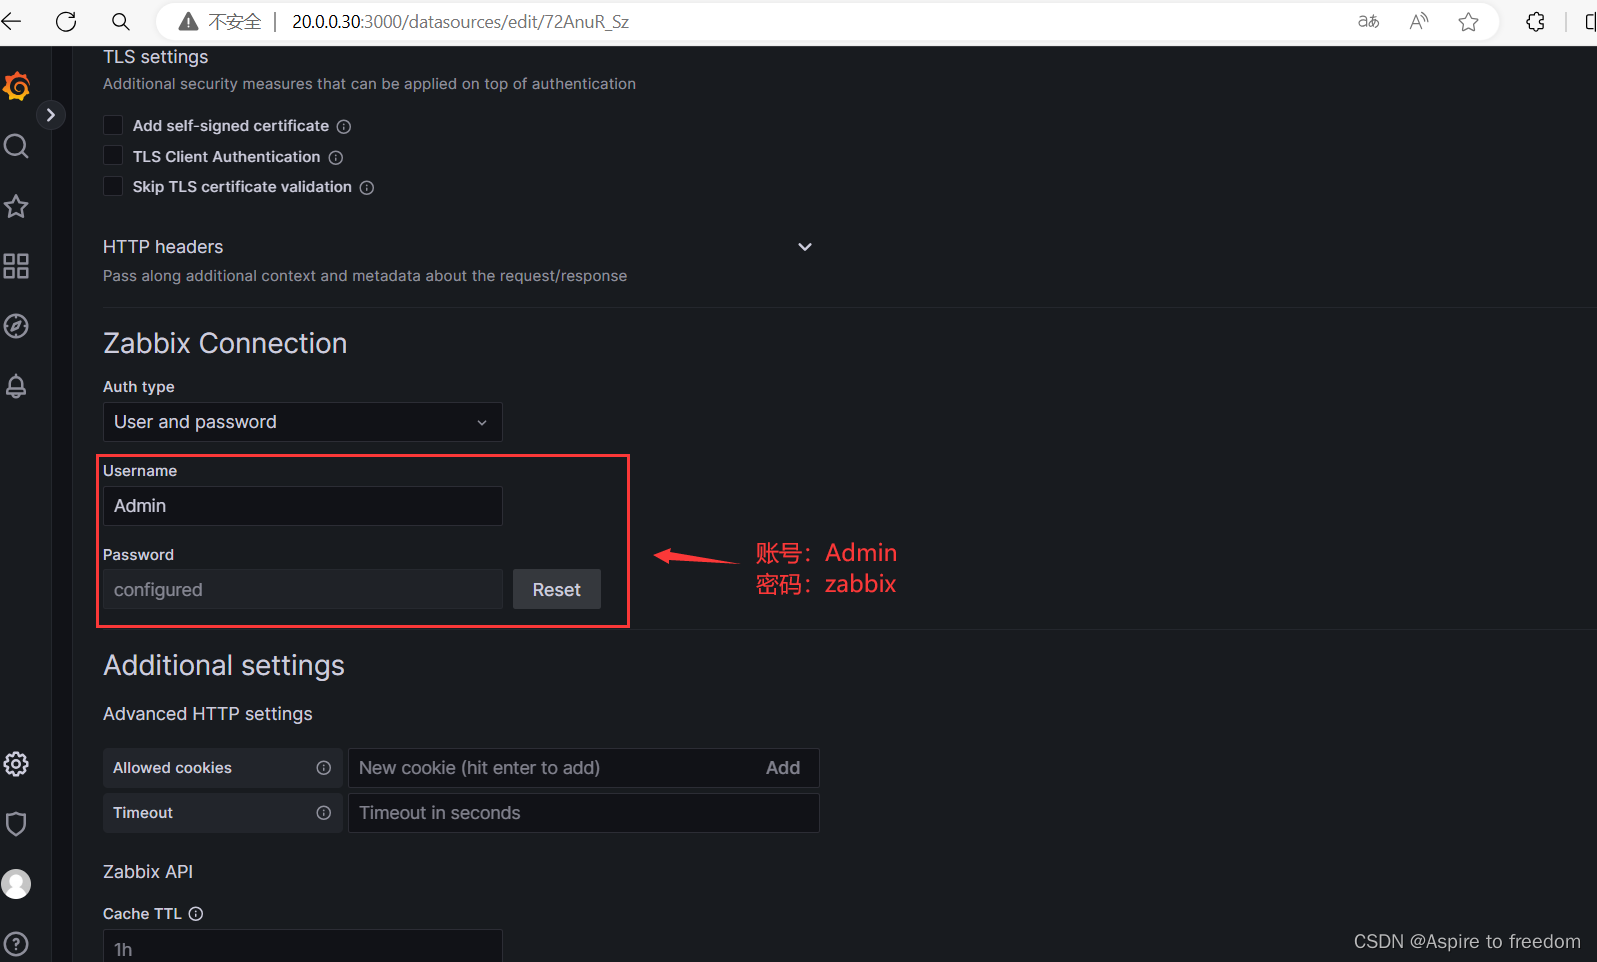
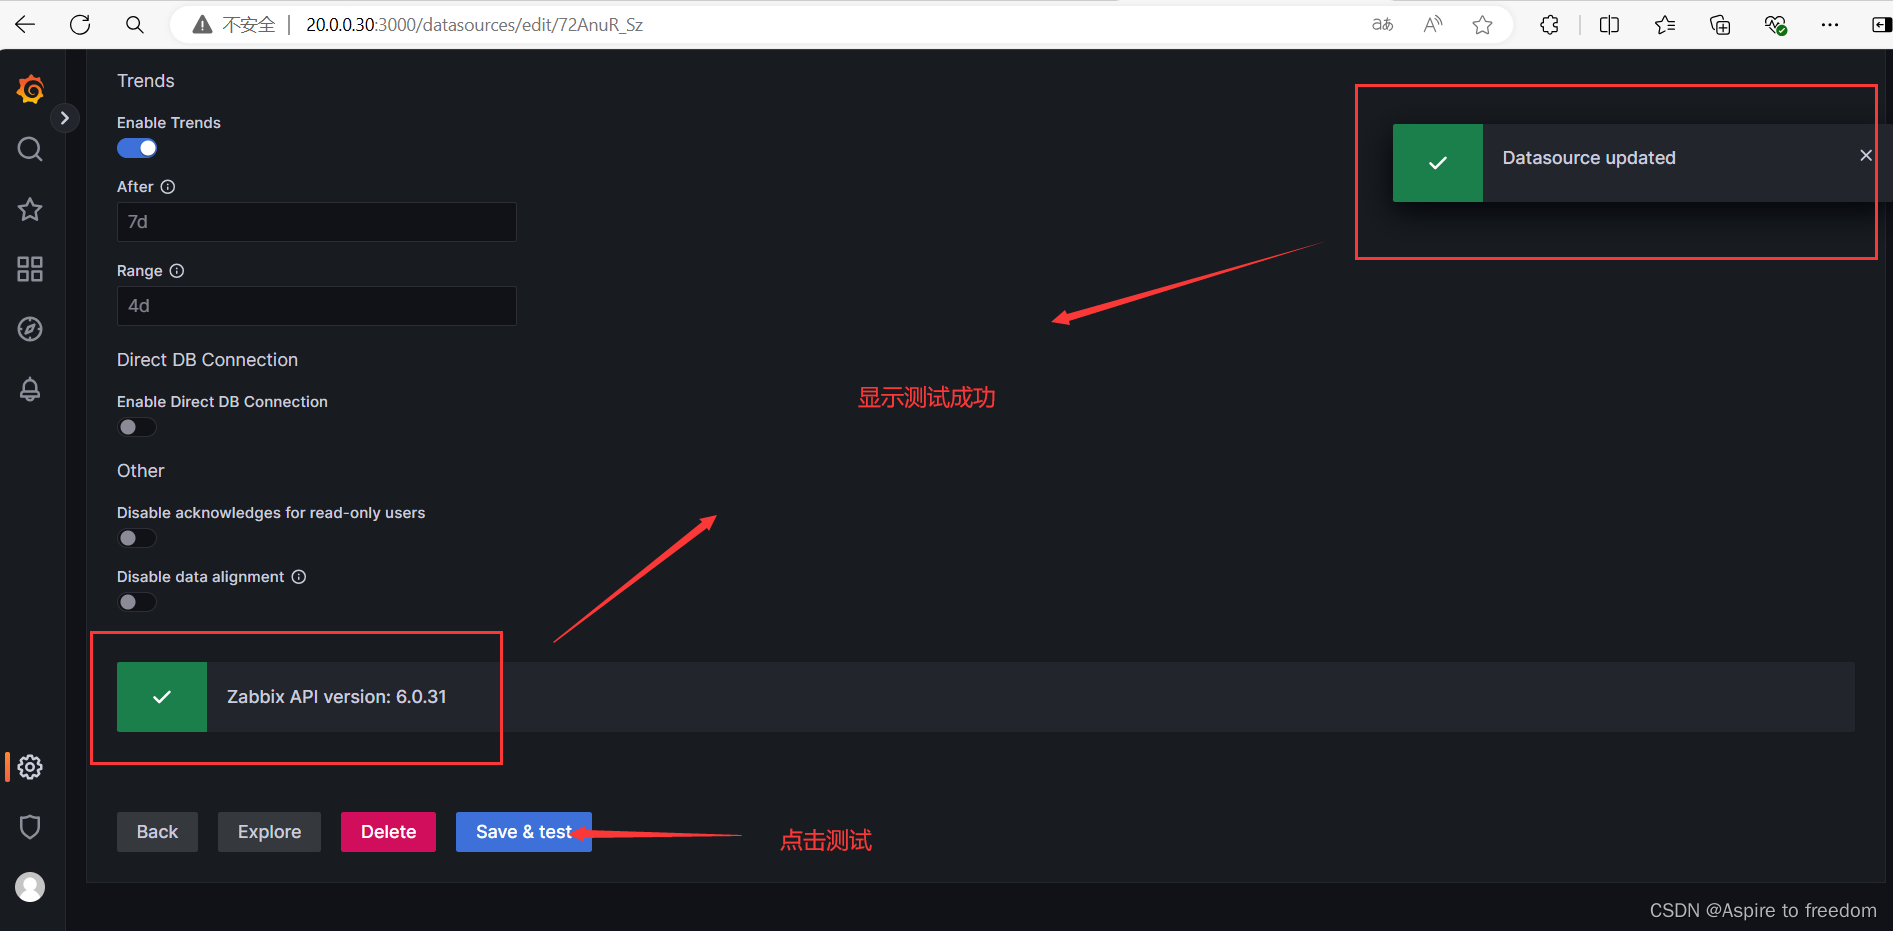
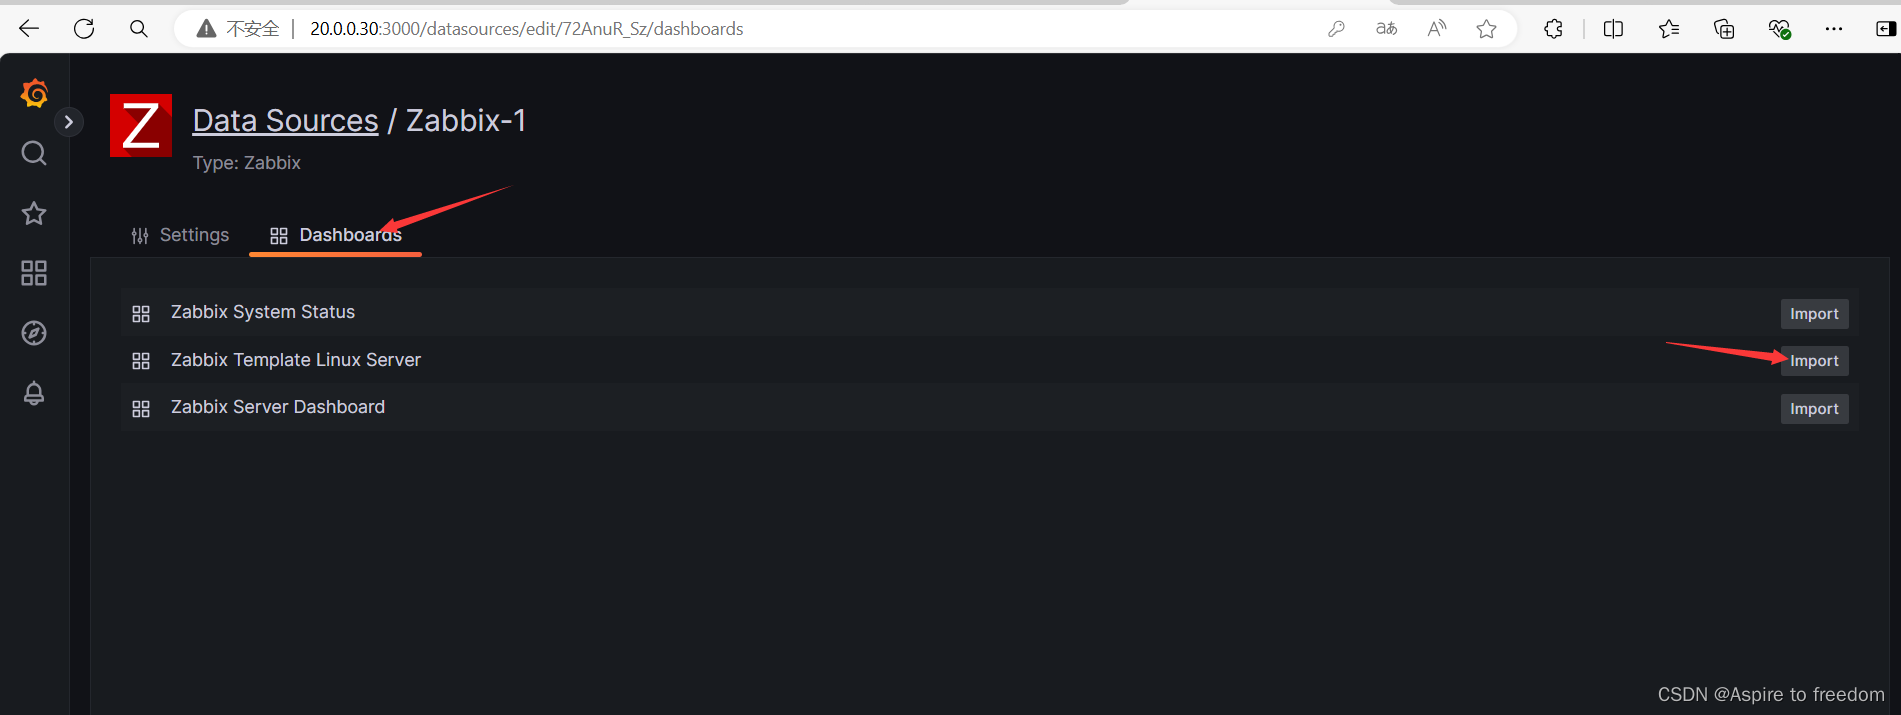
3、导入zabbix数据,对接grafana
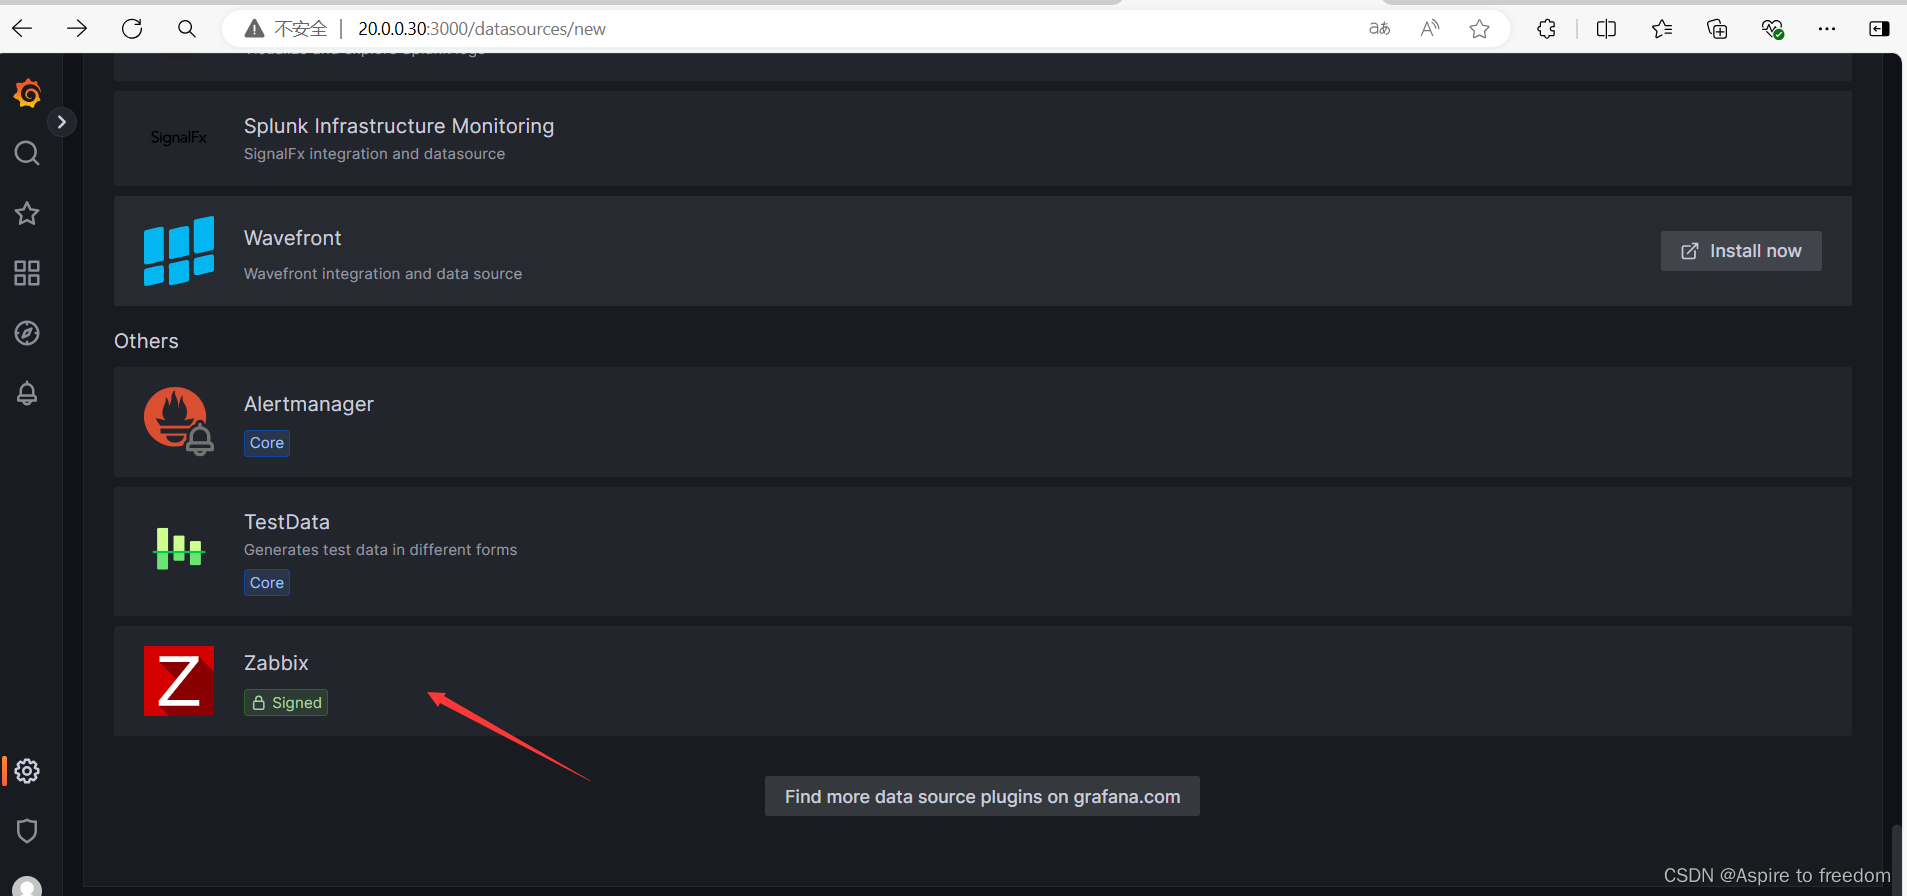
往下翻找到zabbix点击进入
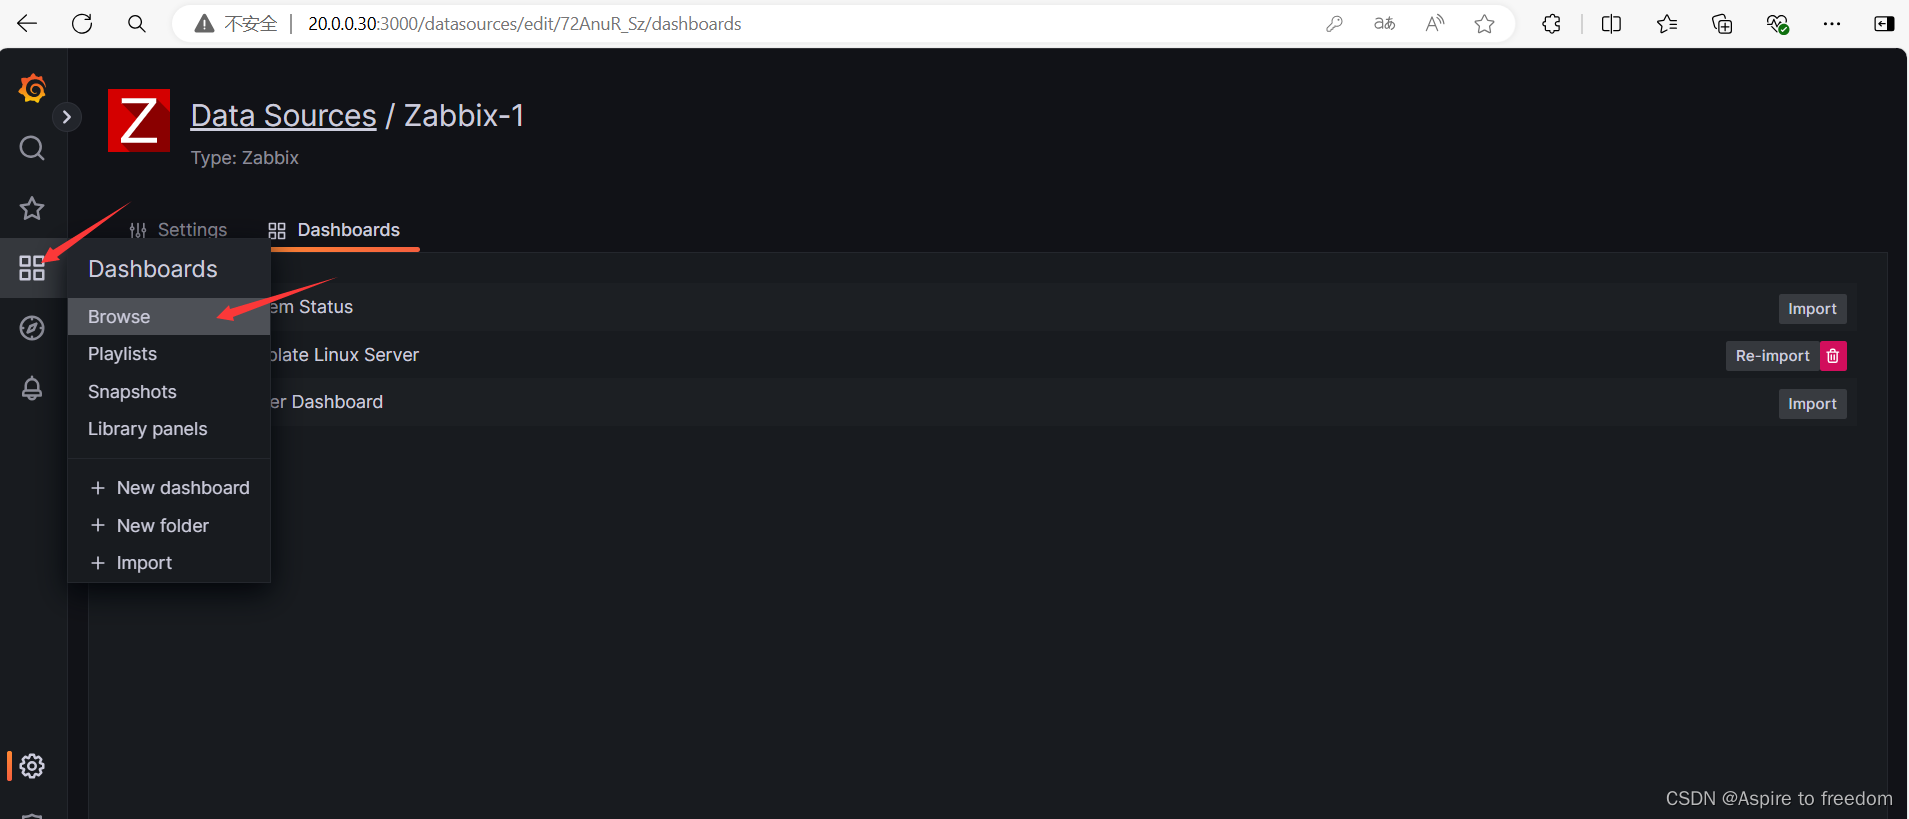
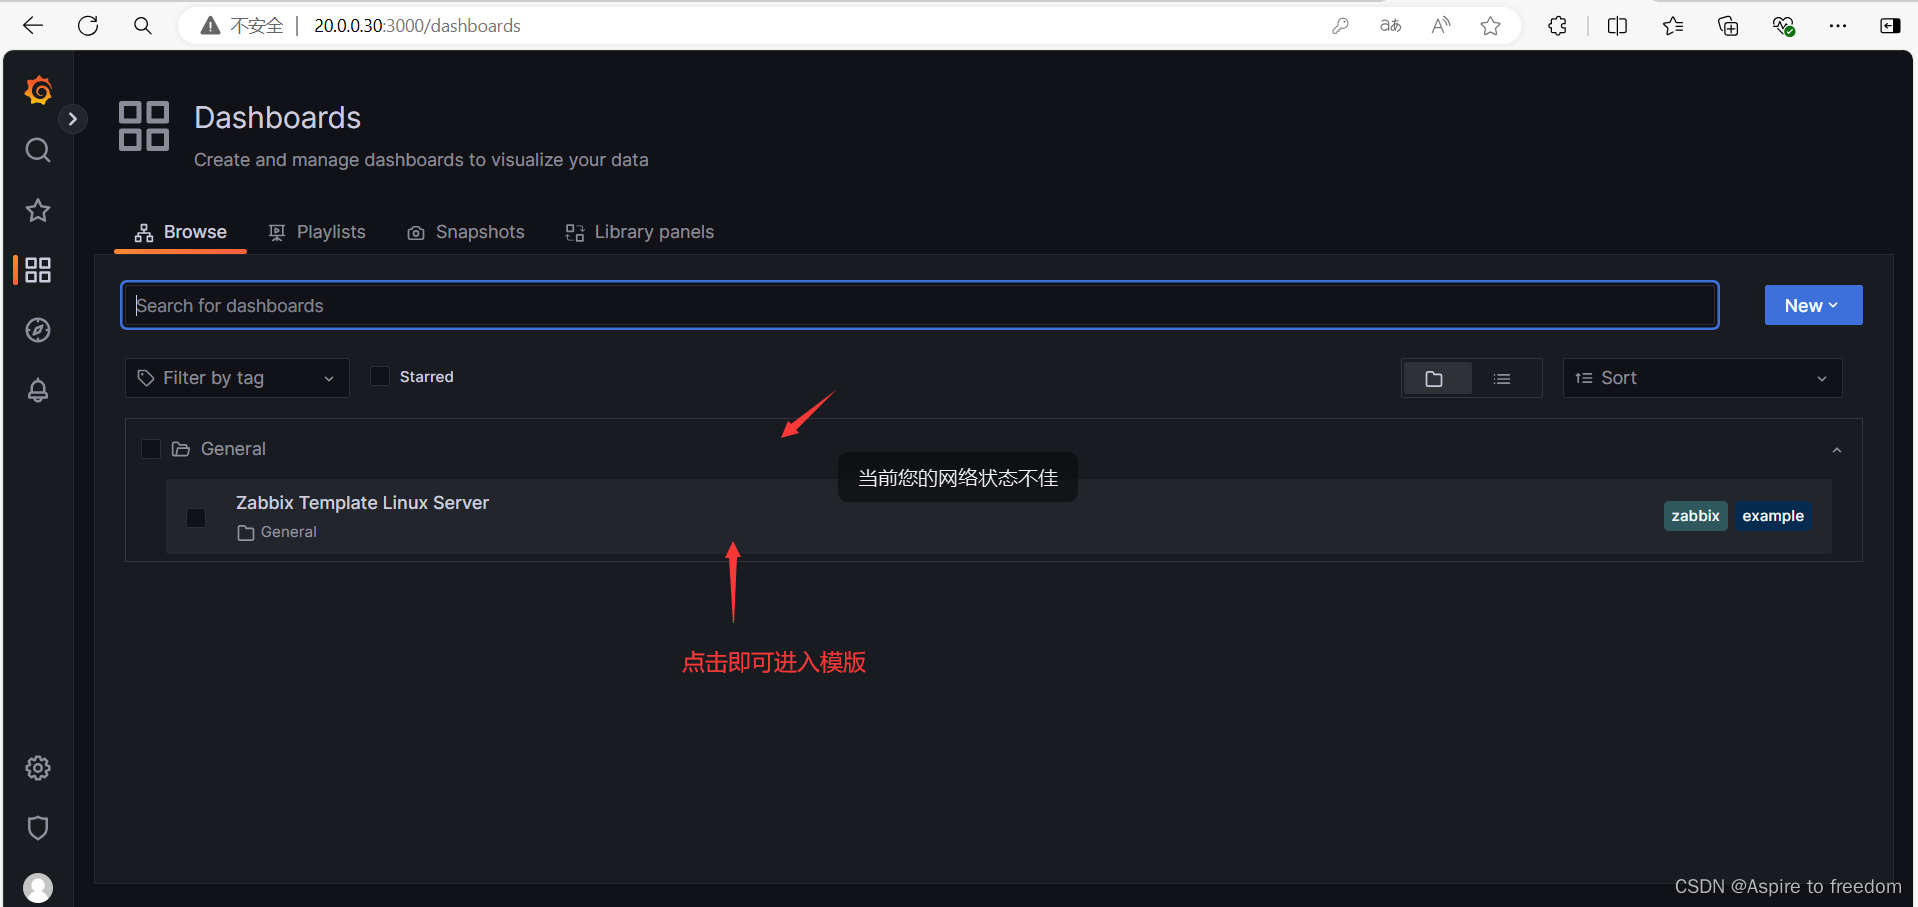
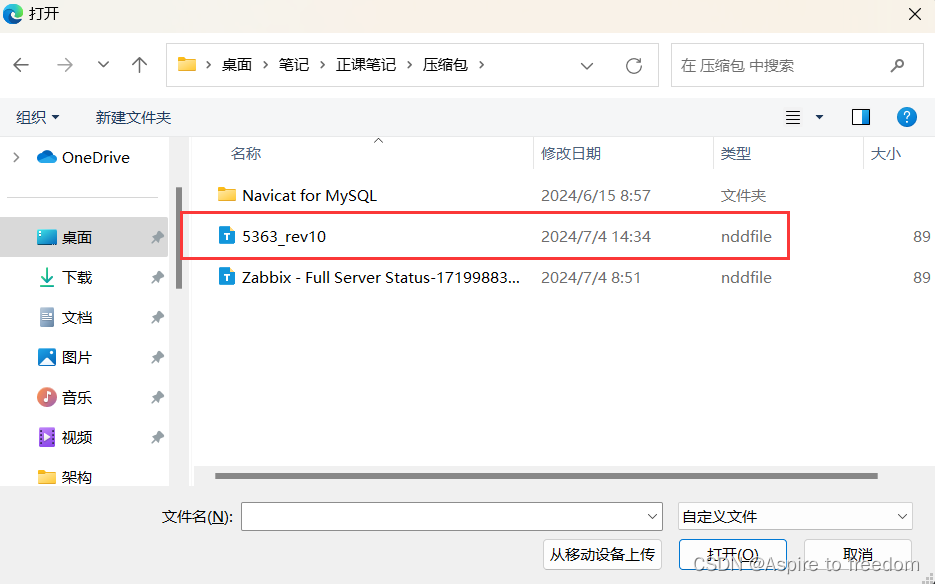
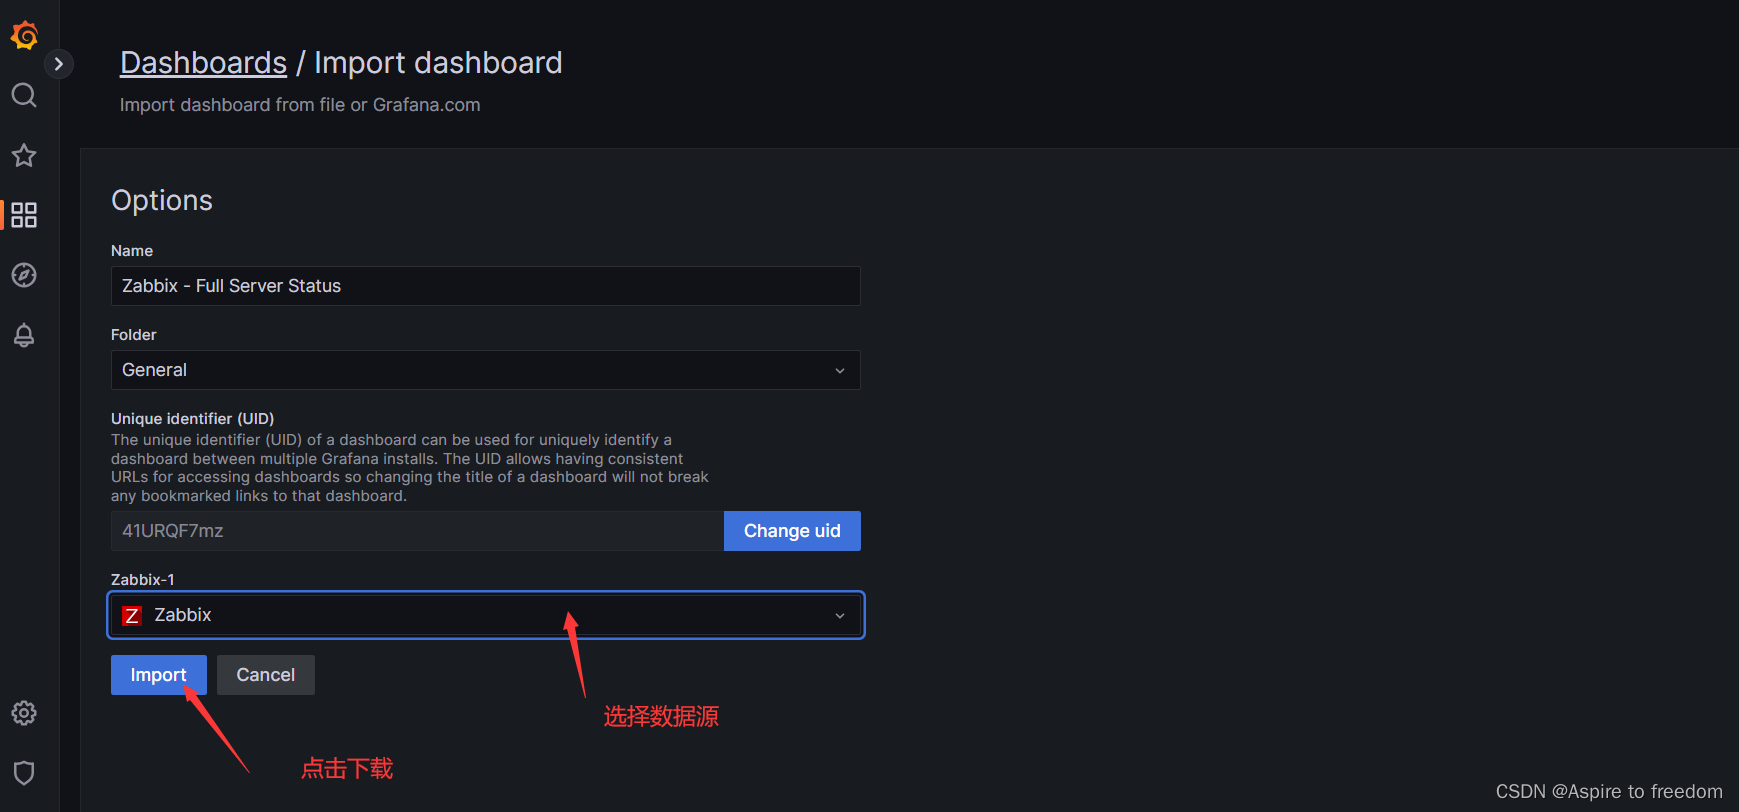
导入模版

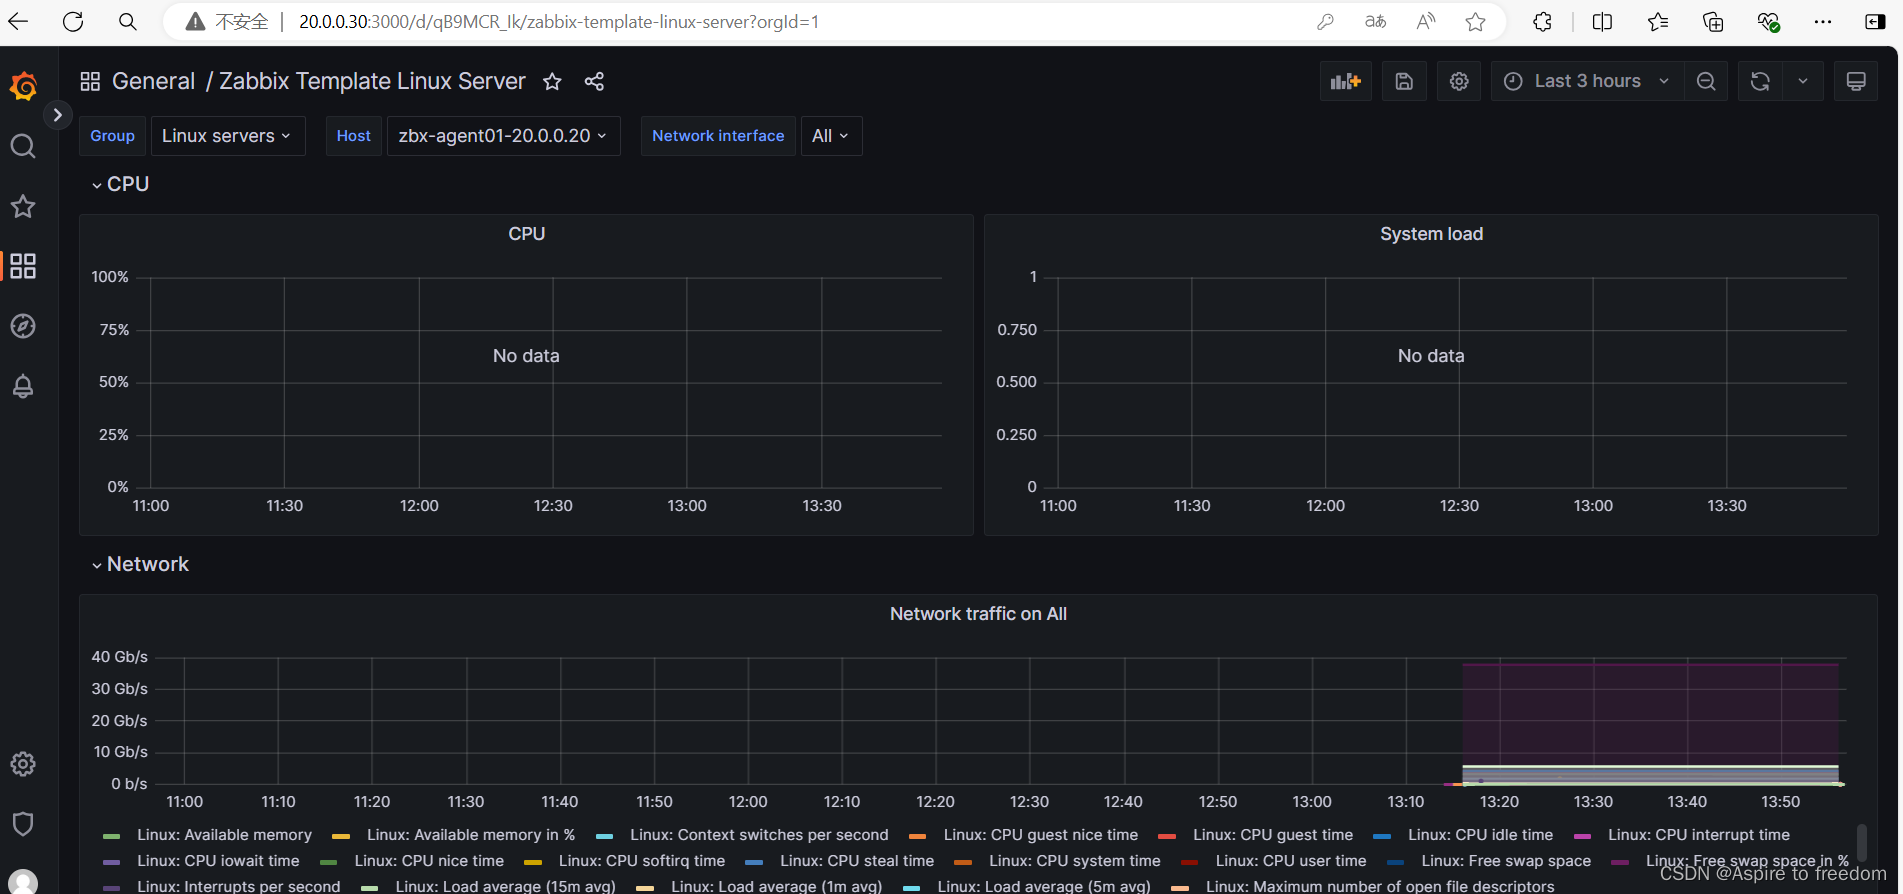
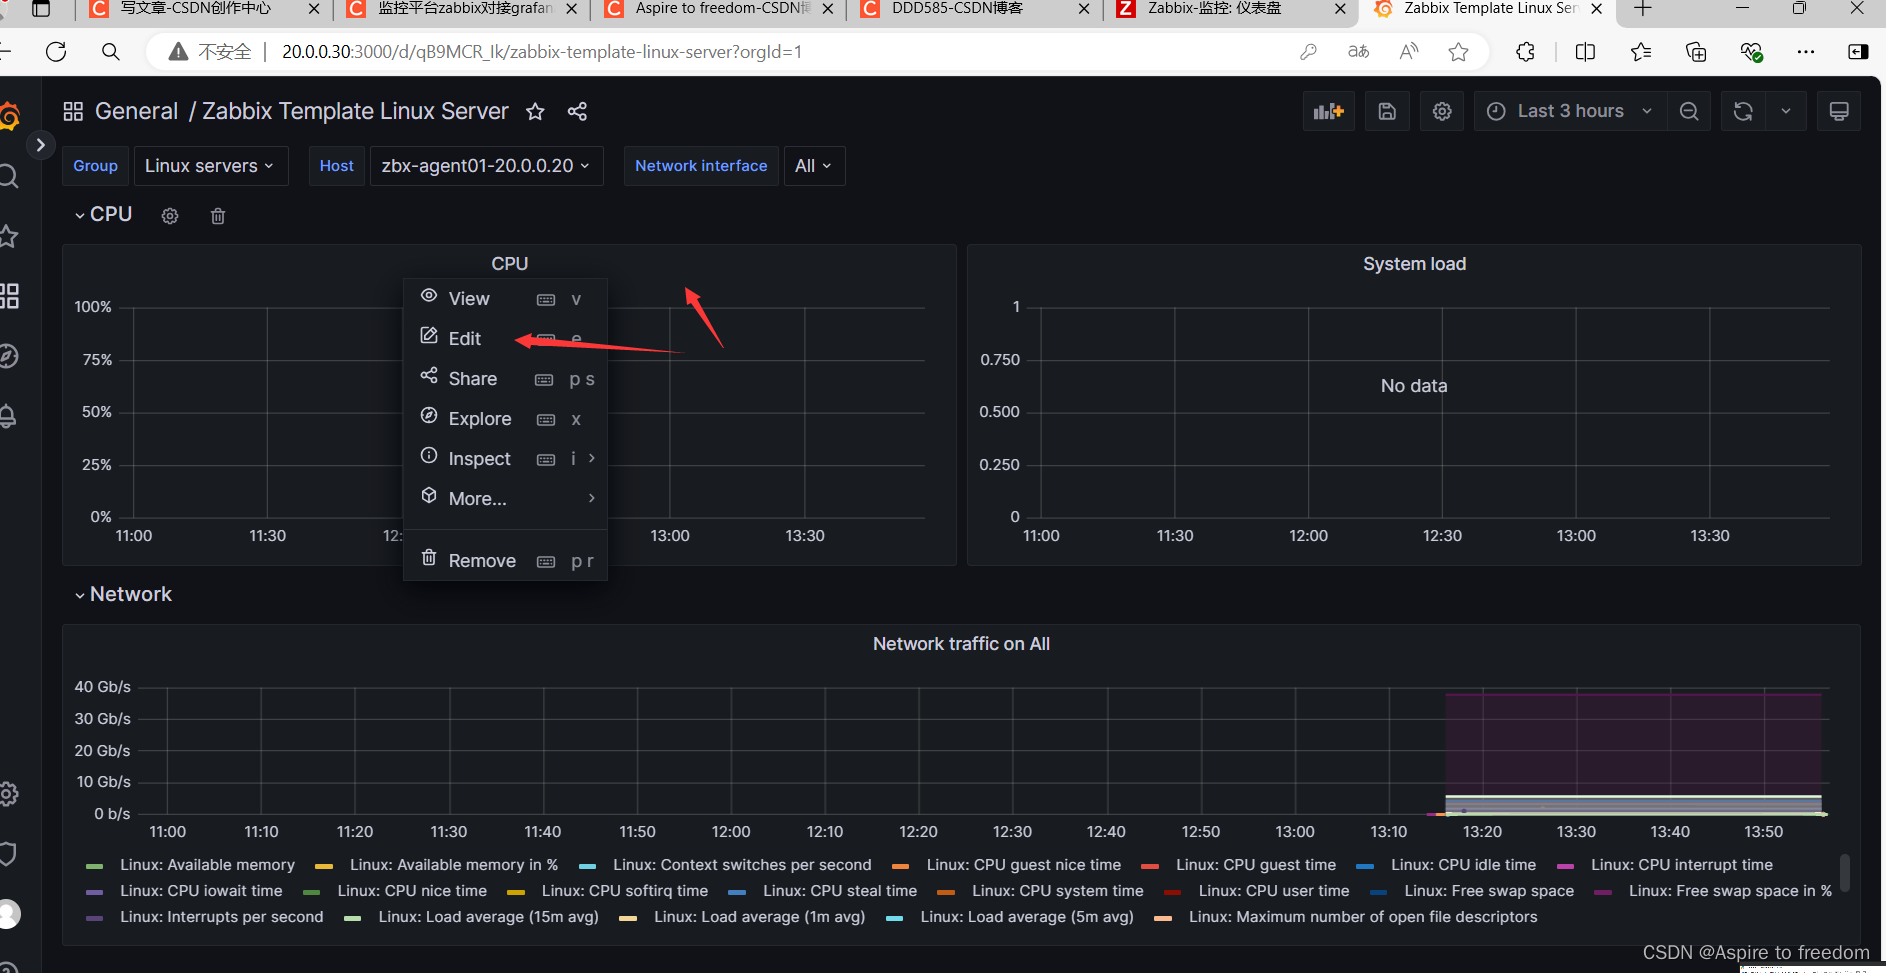
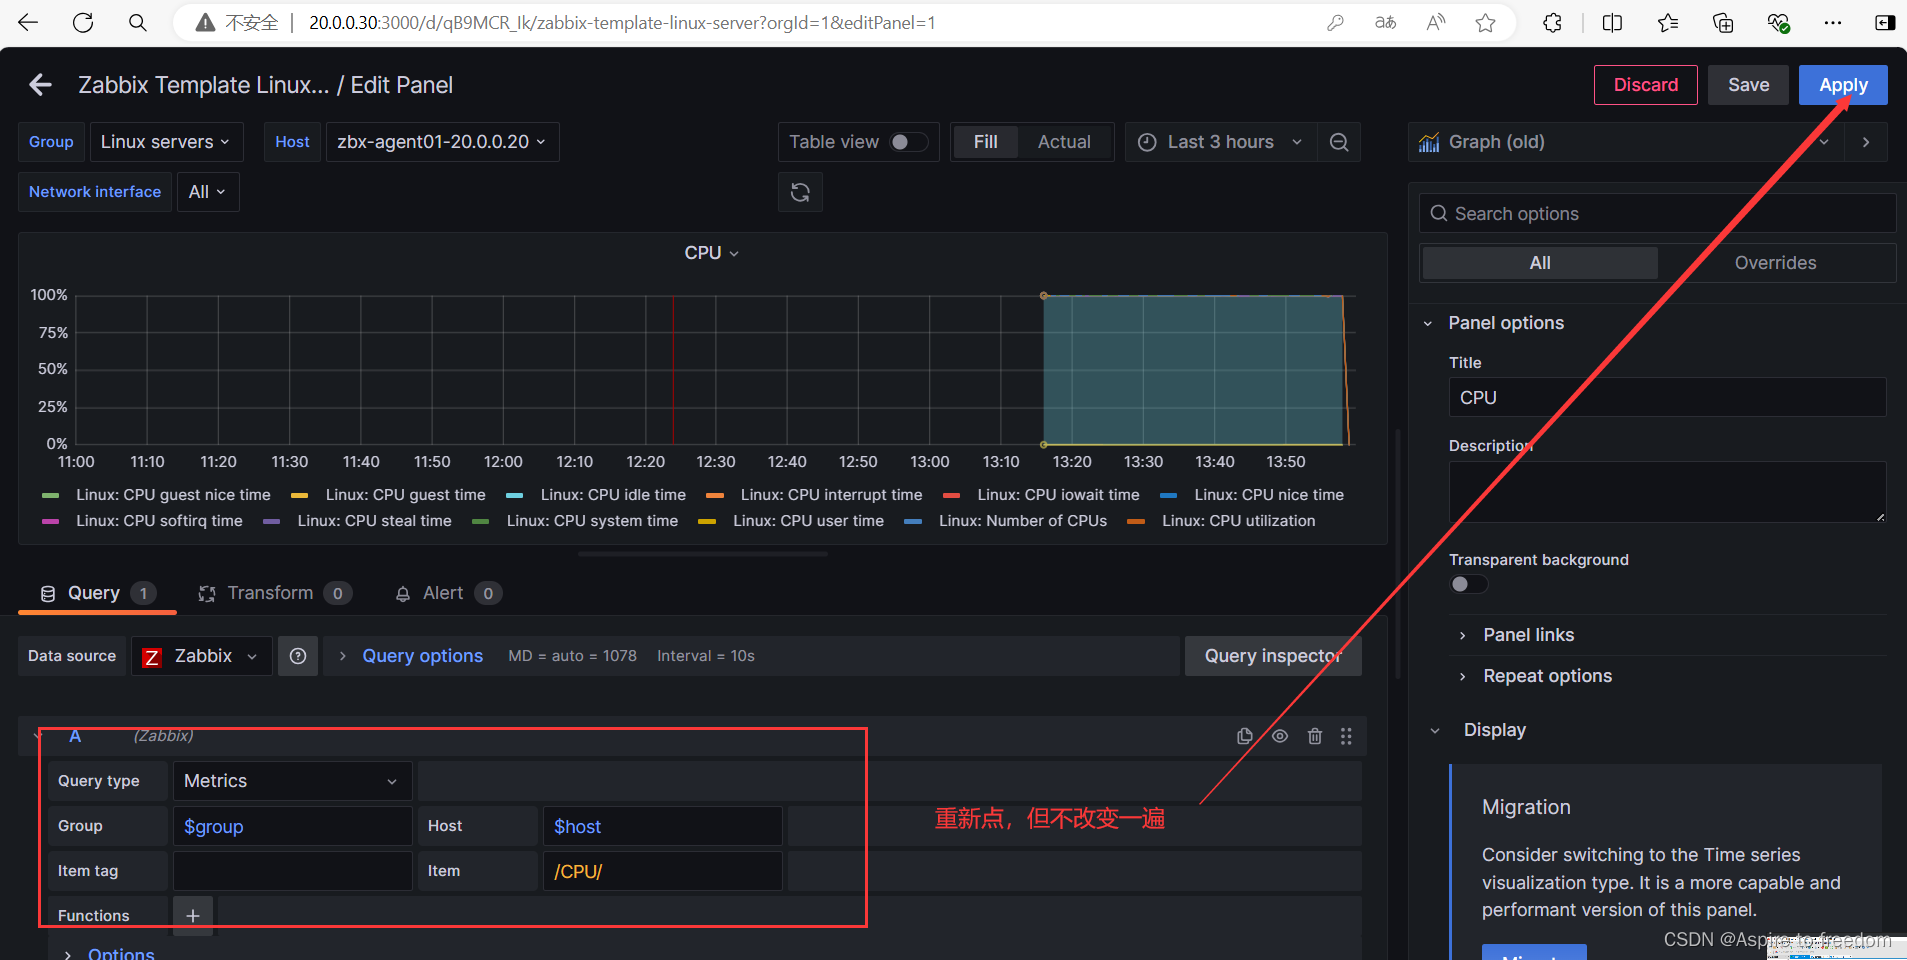
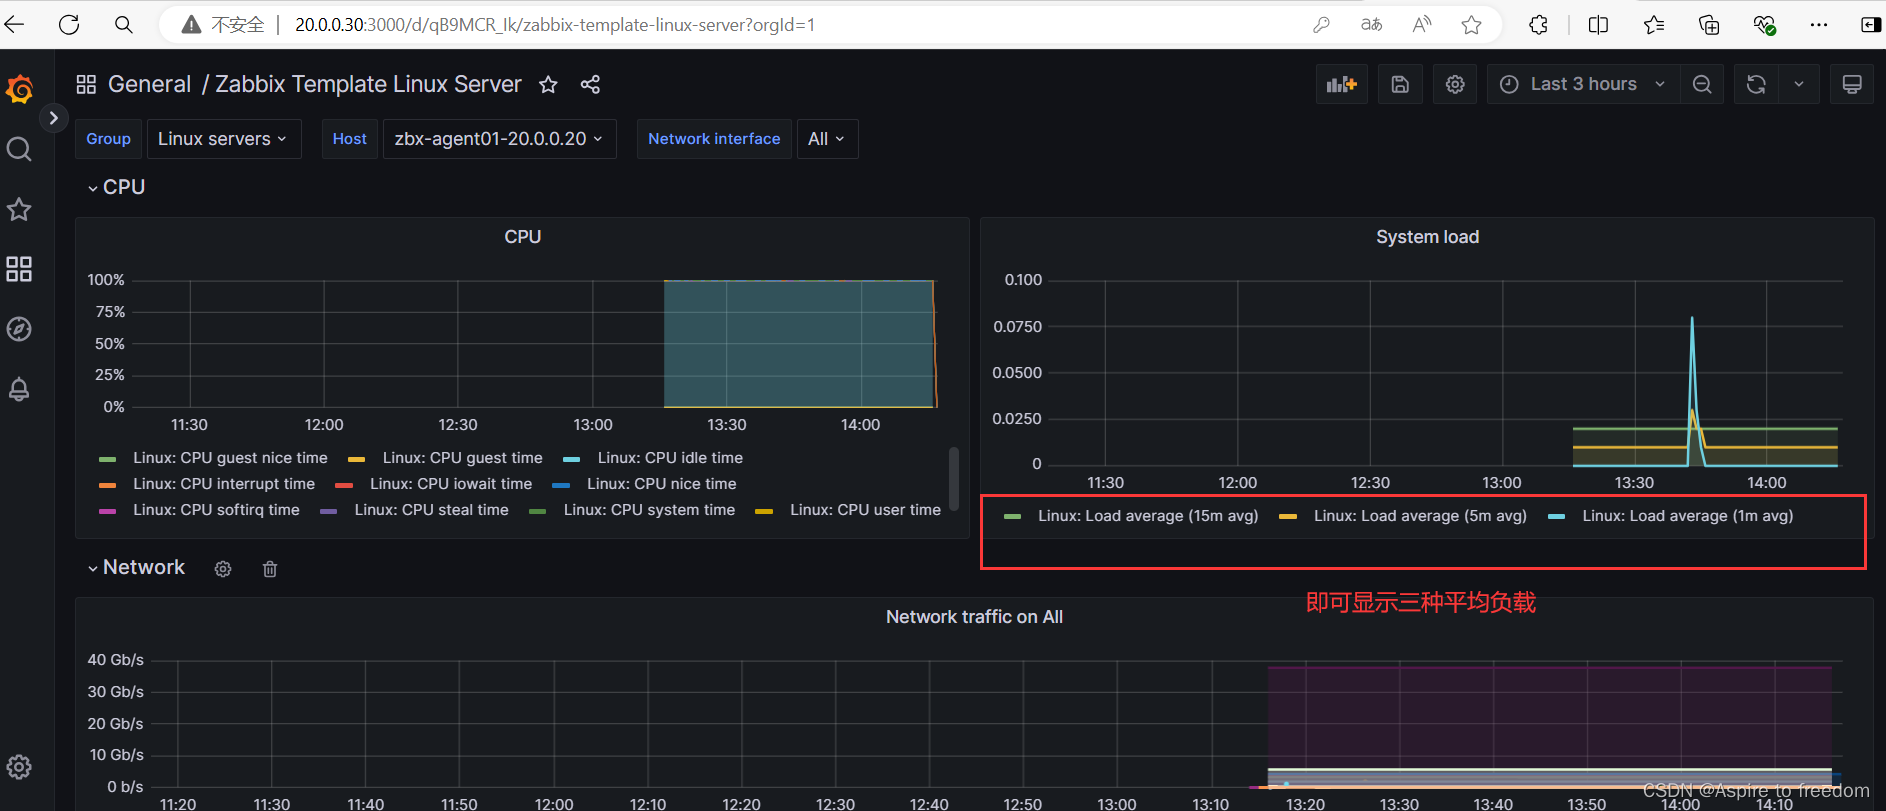
调试模板
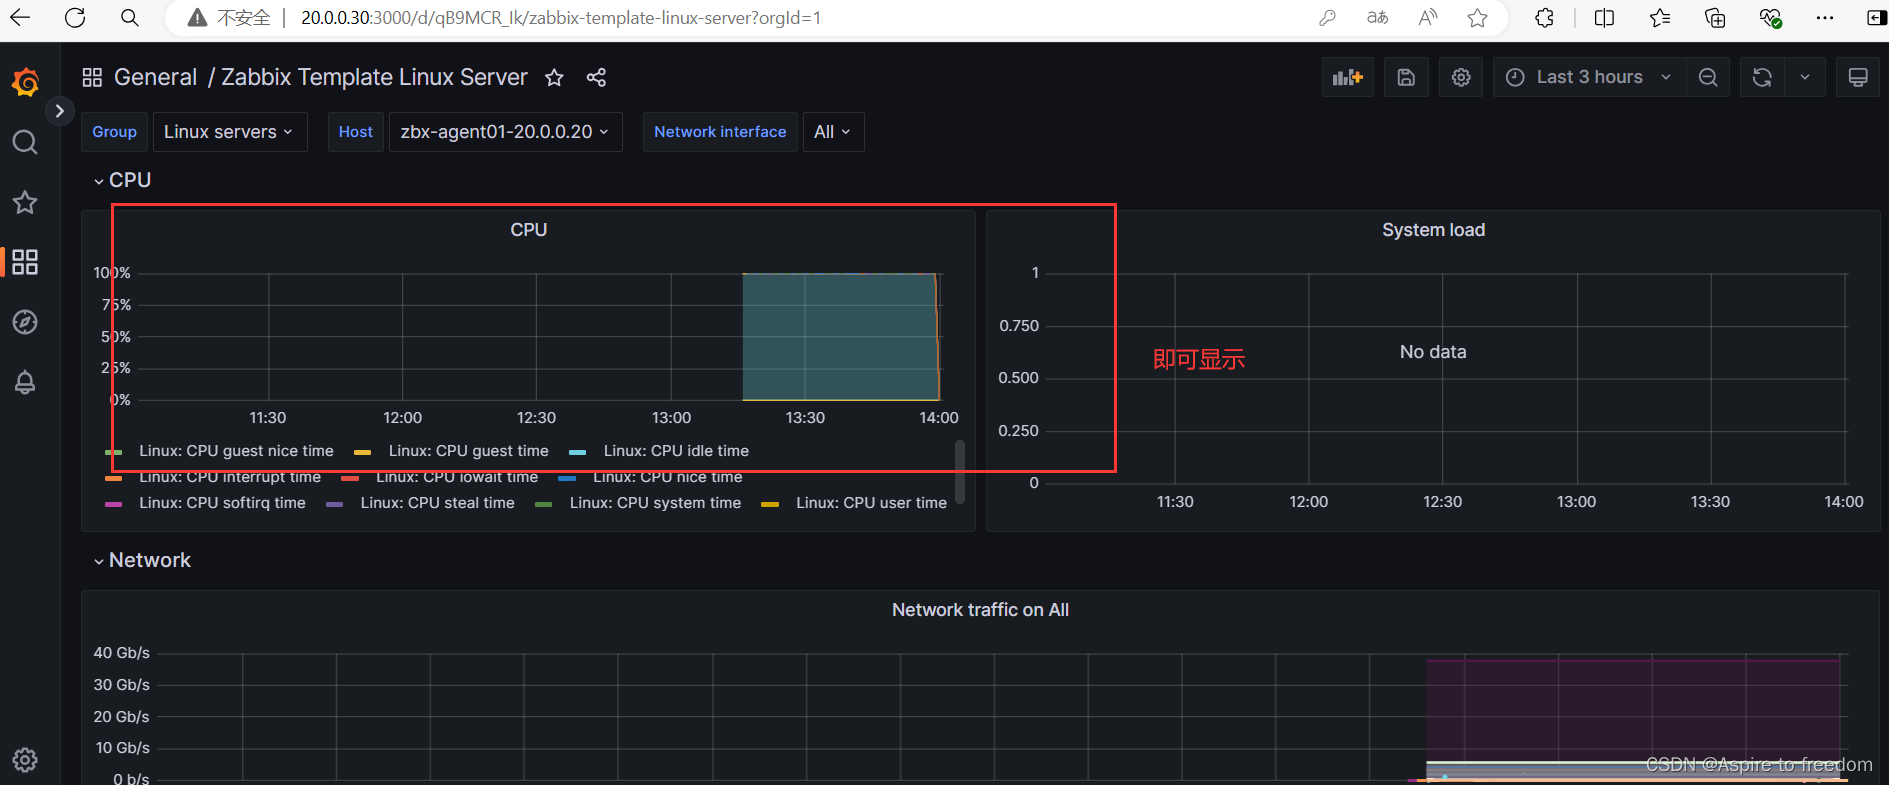
调试CPU
调试平均负载
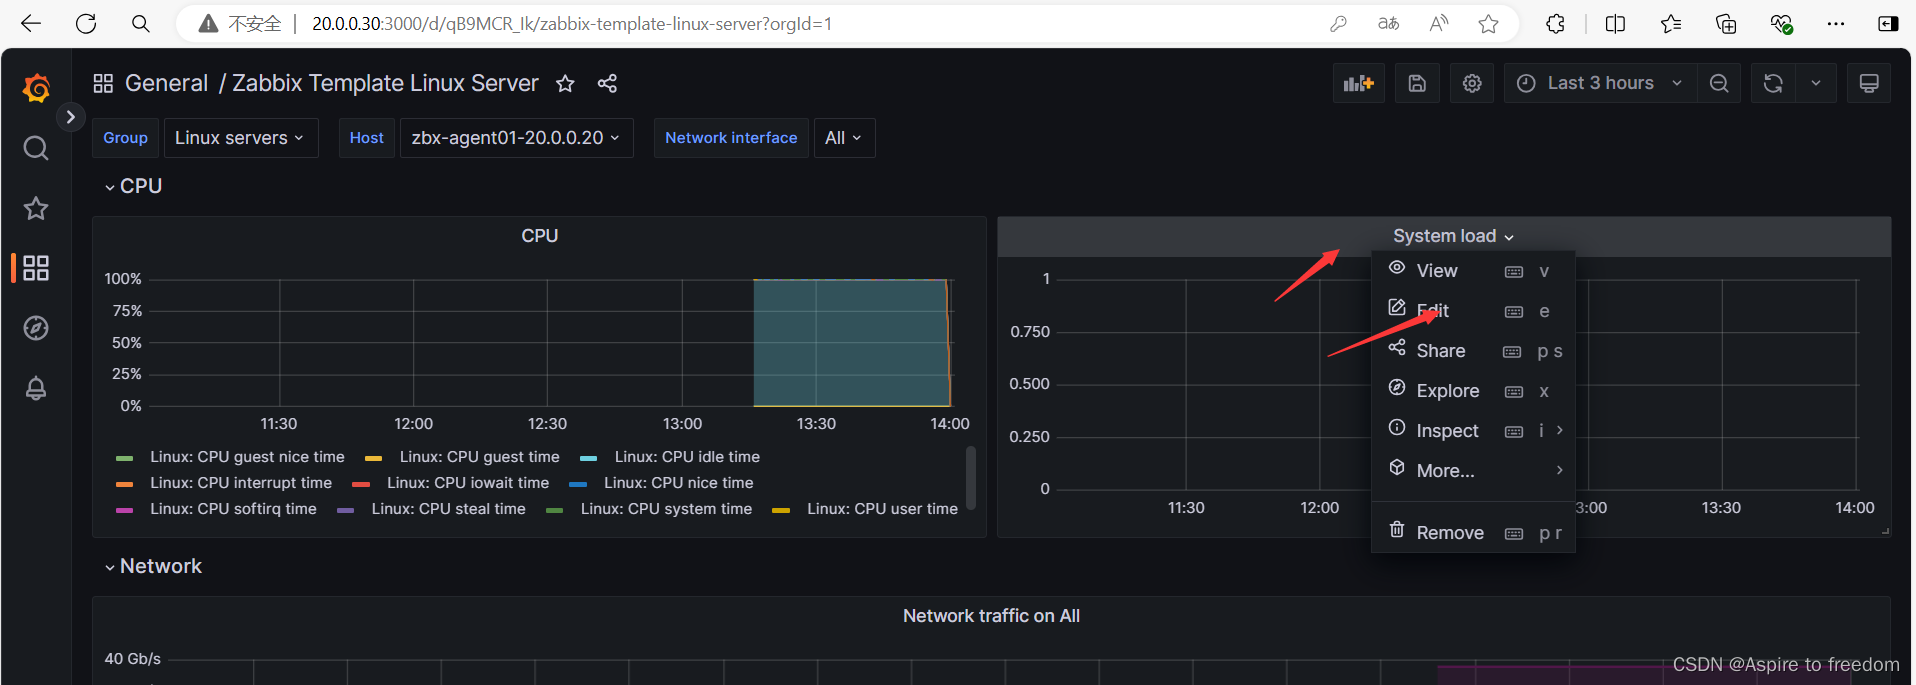
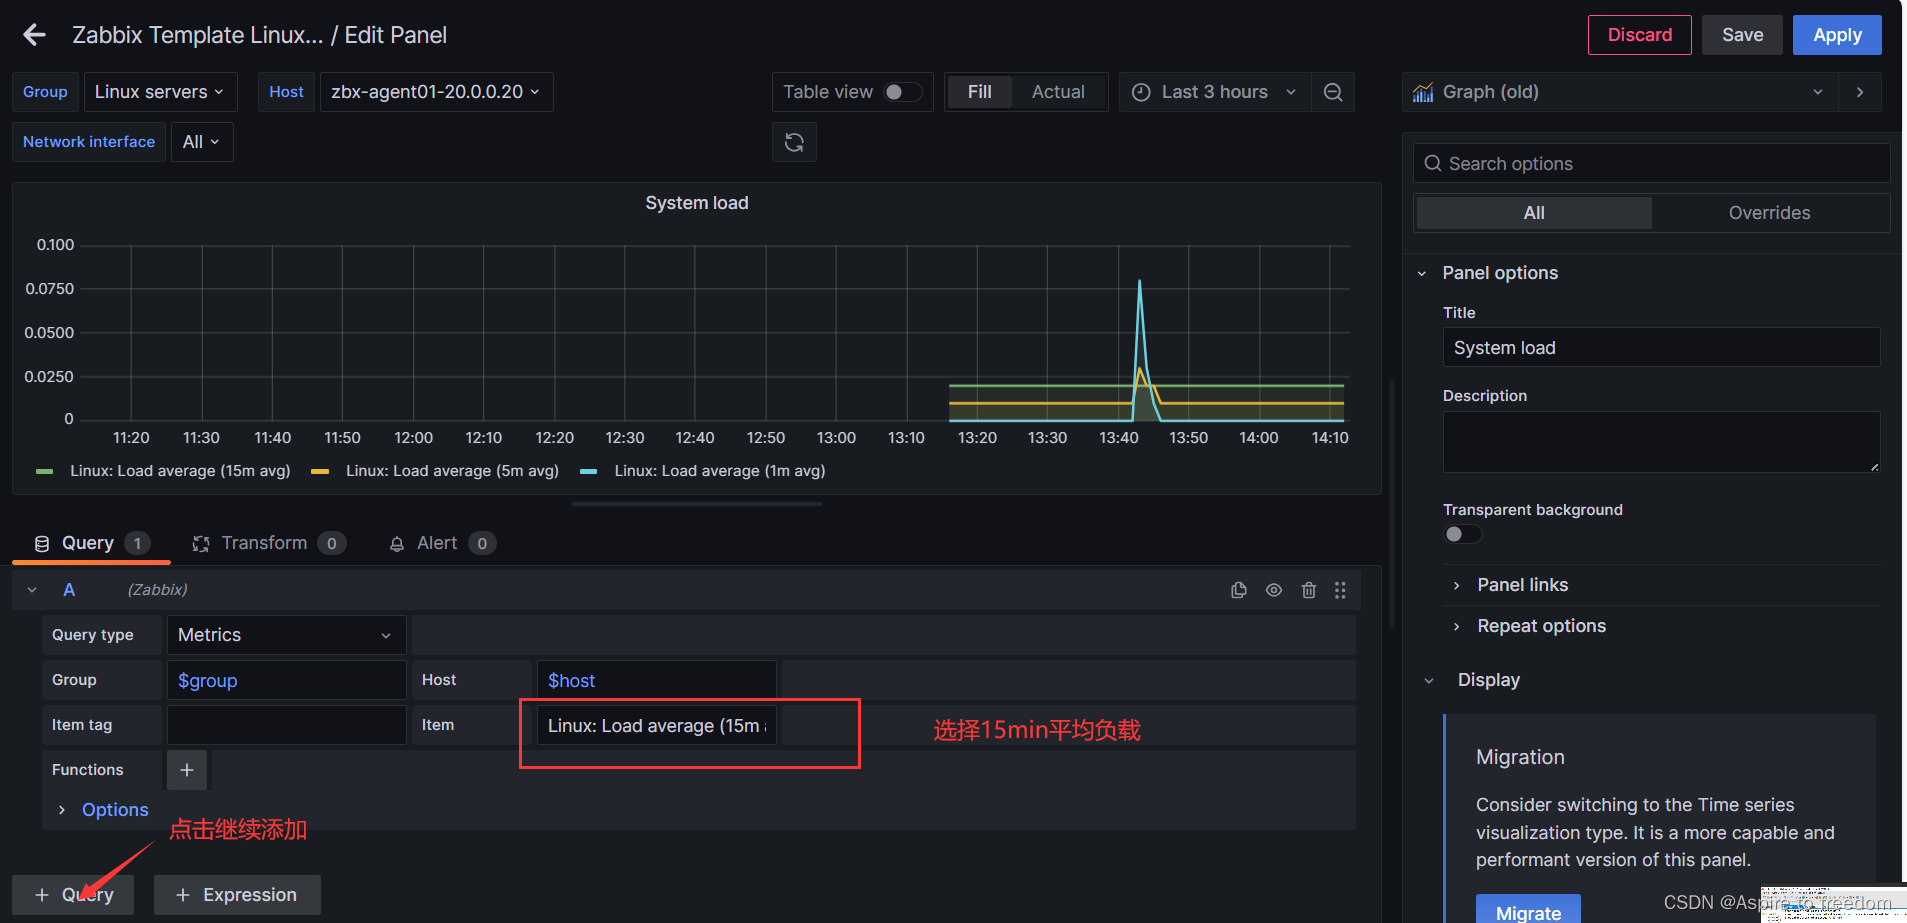
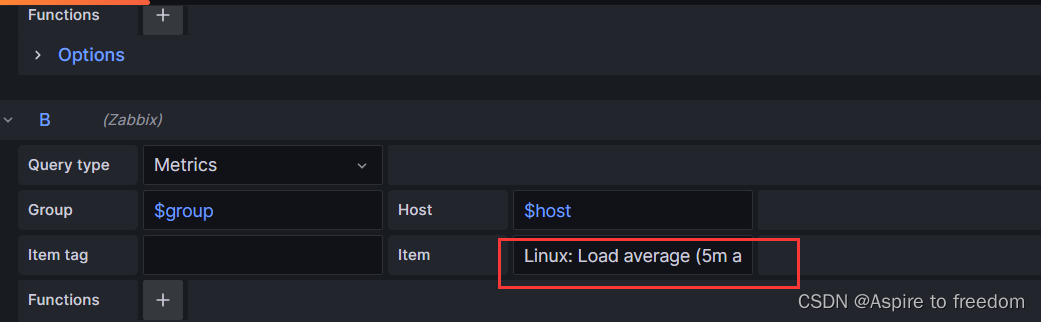
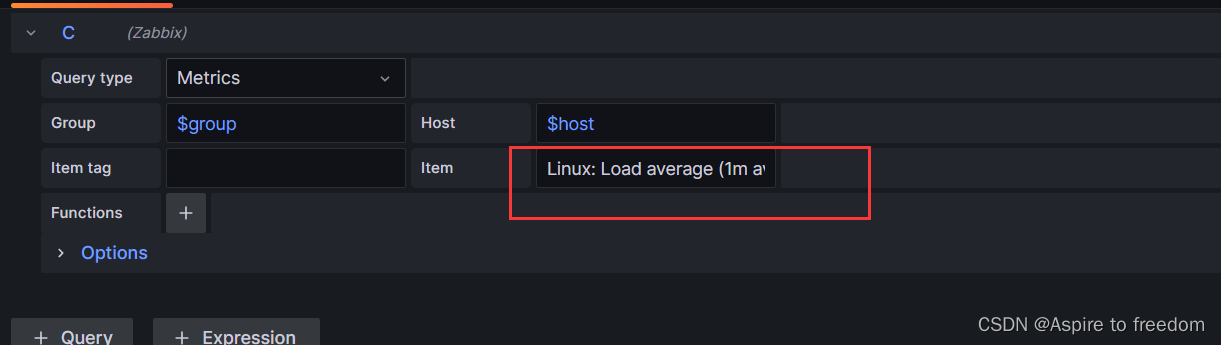
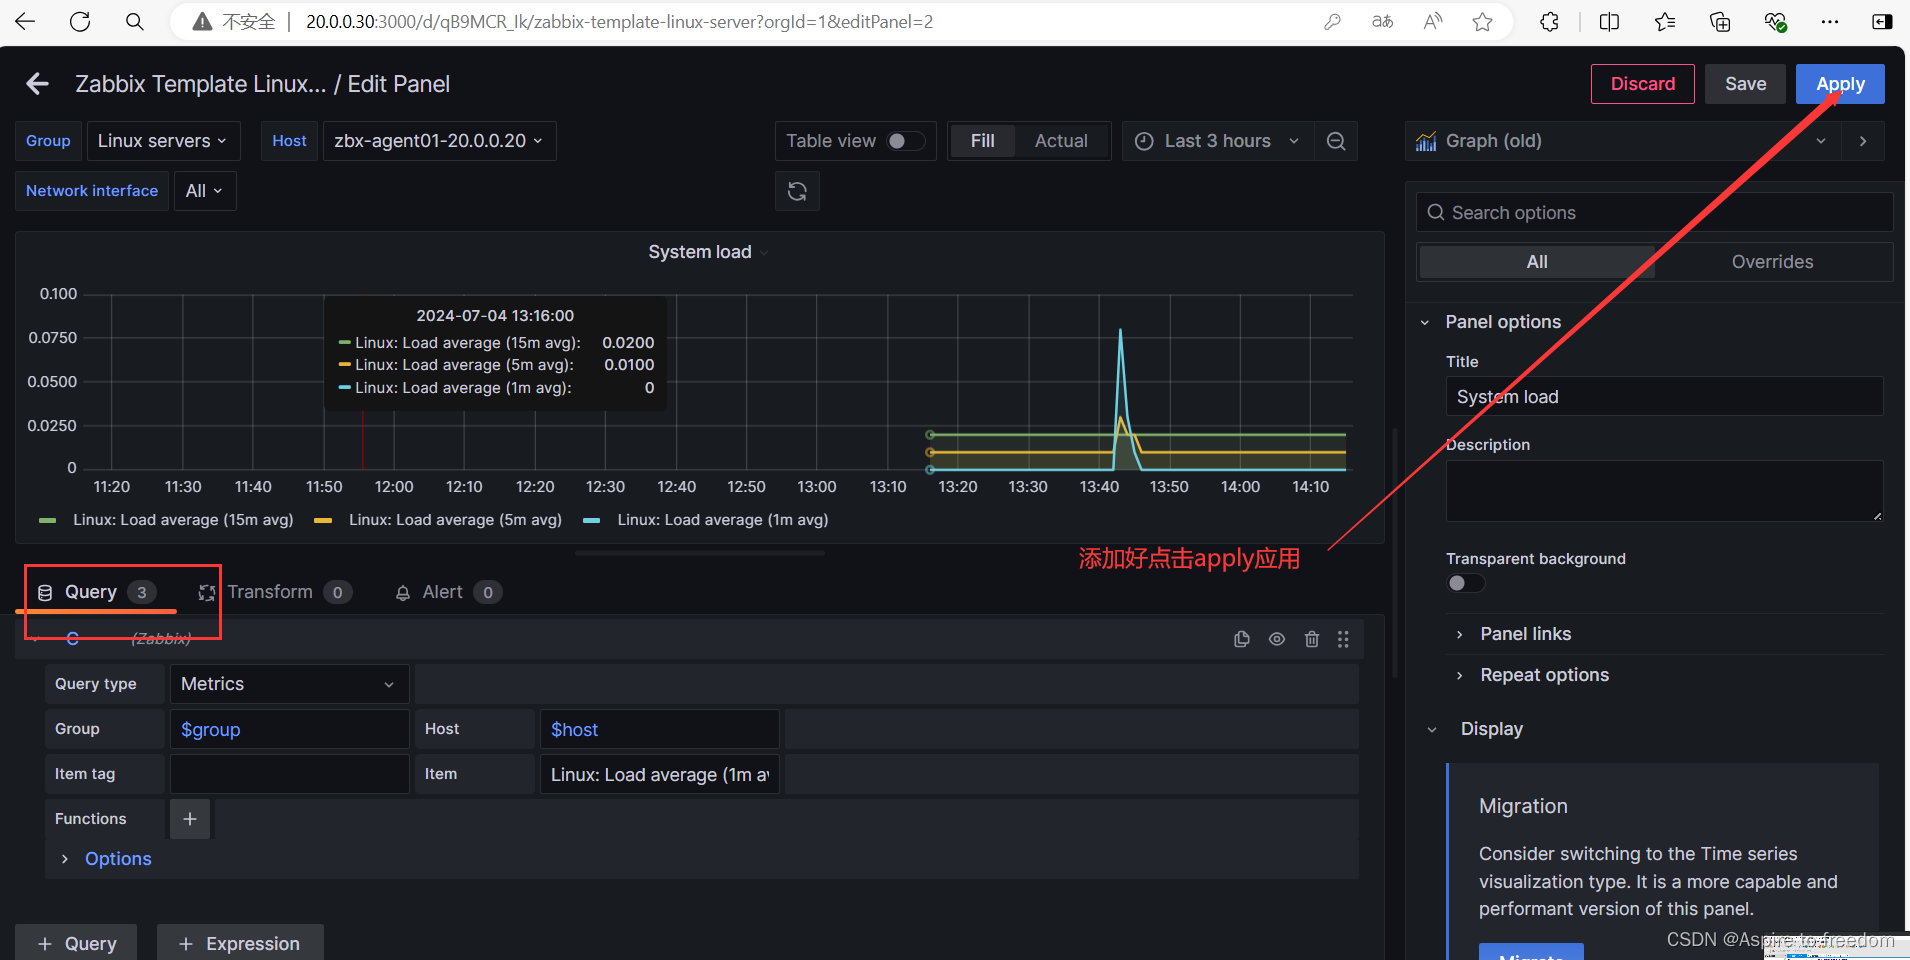
添加两个,一个5min平均负载,一个1min平均负载
4、如何导入模板
https://grafana.com/dashboards 可登录该网站进行
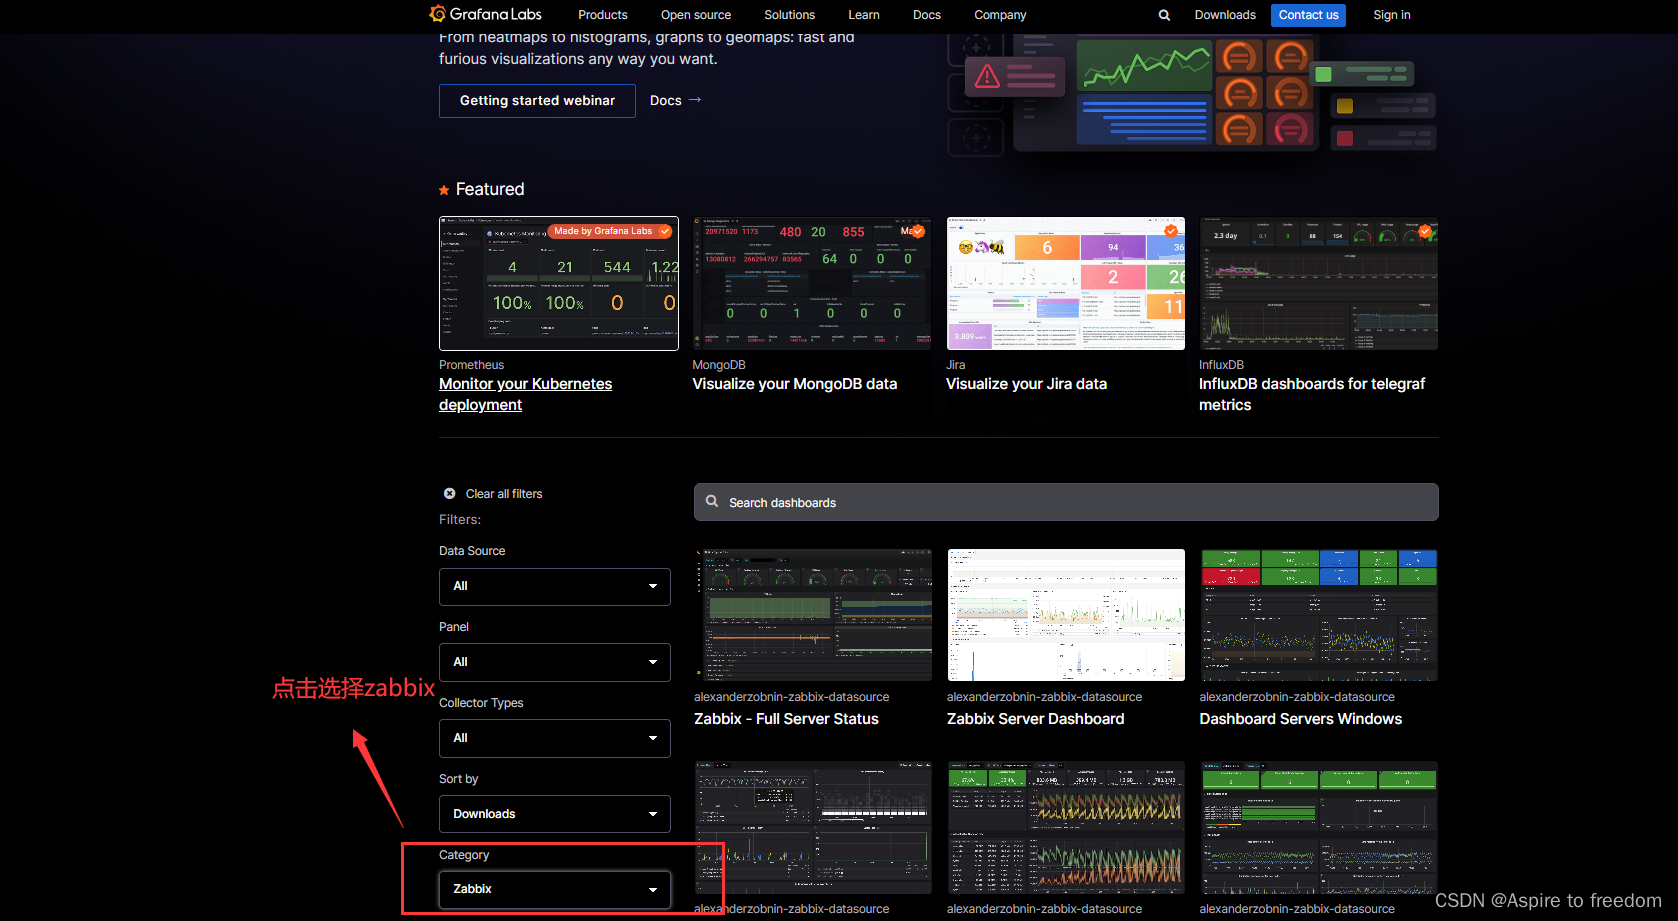
导入模板操作(上面网站不用关)
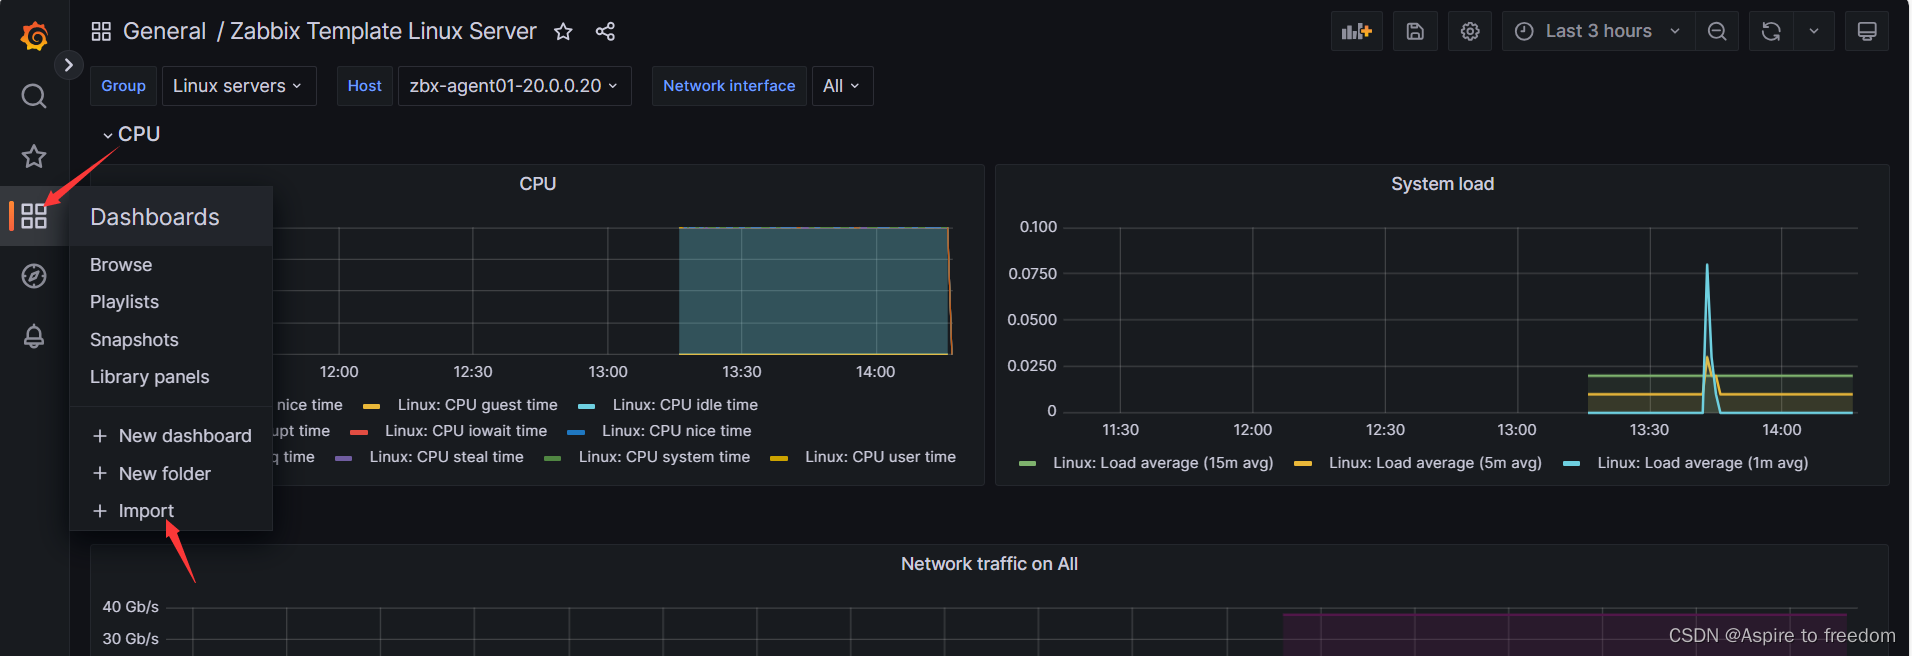
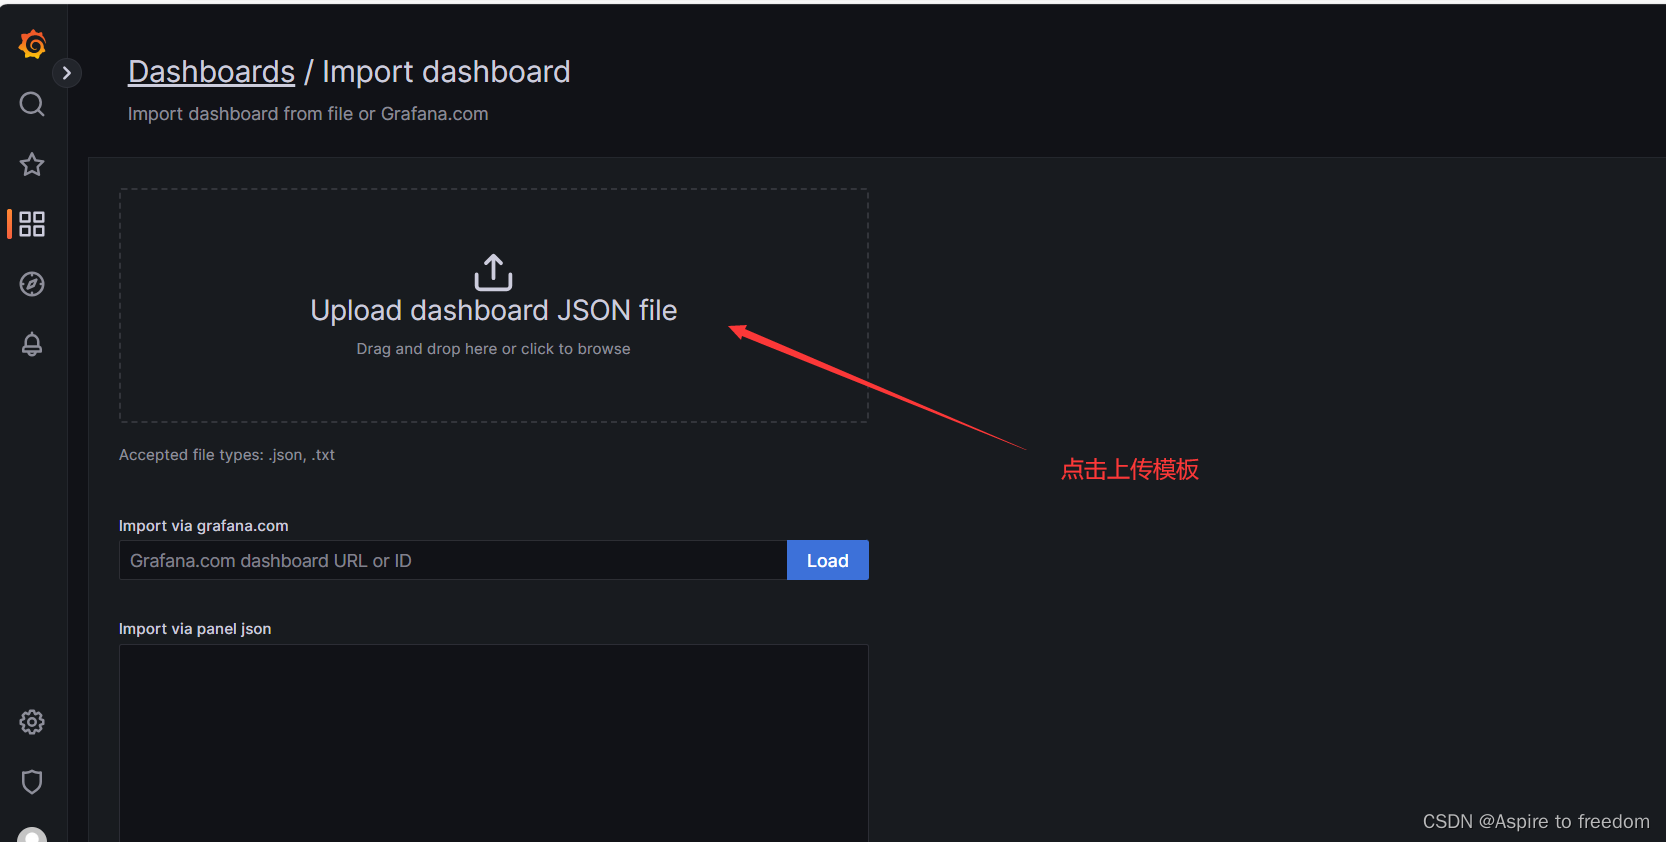
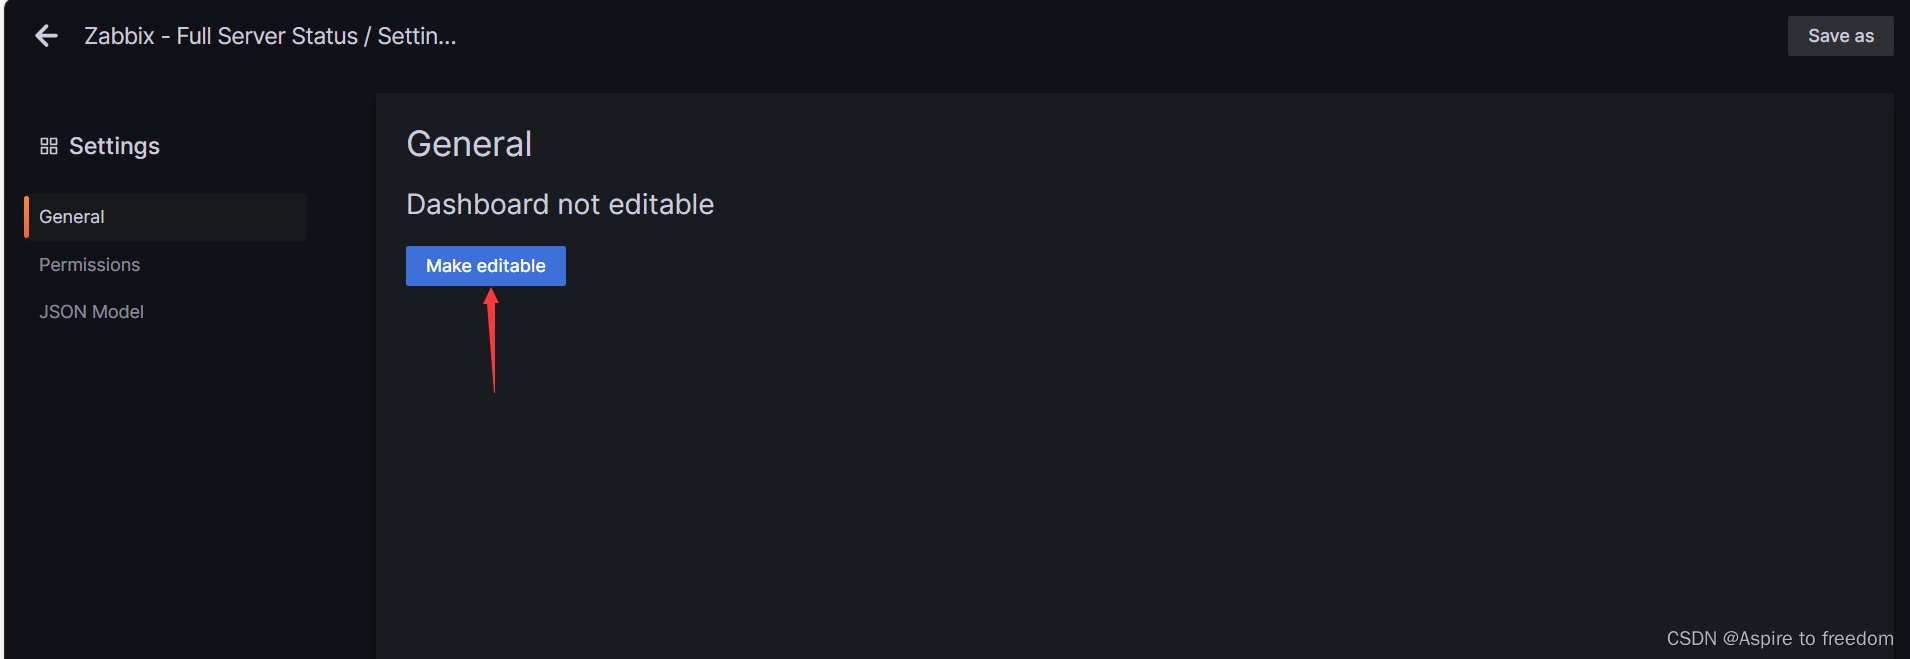
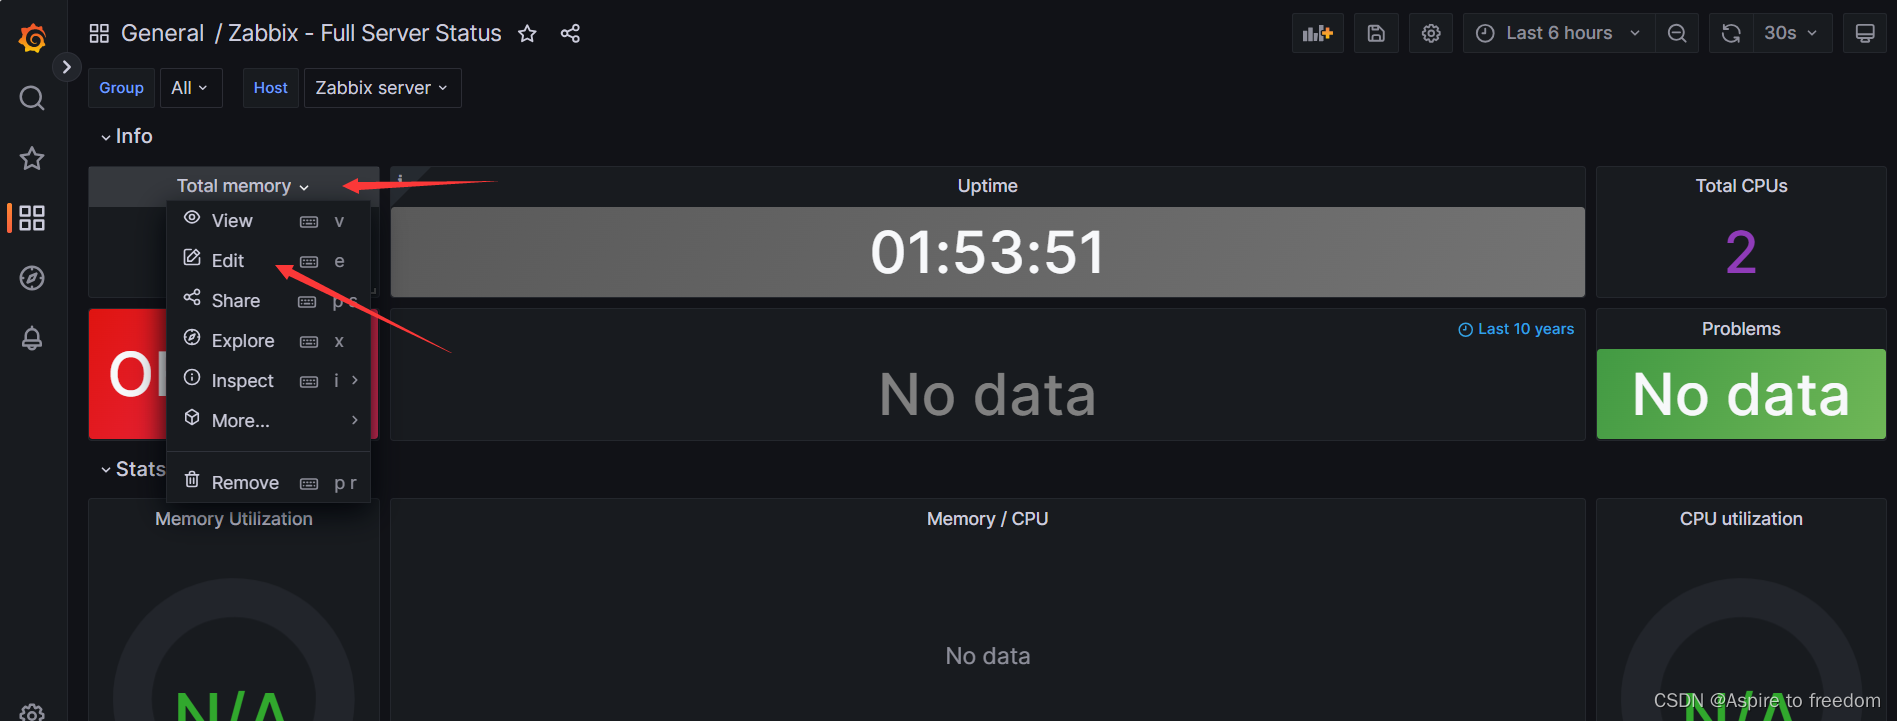
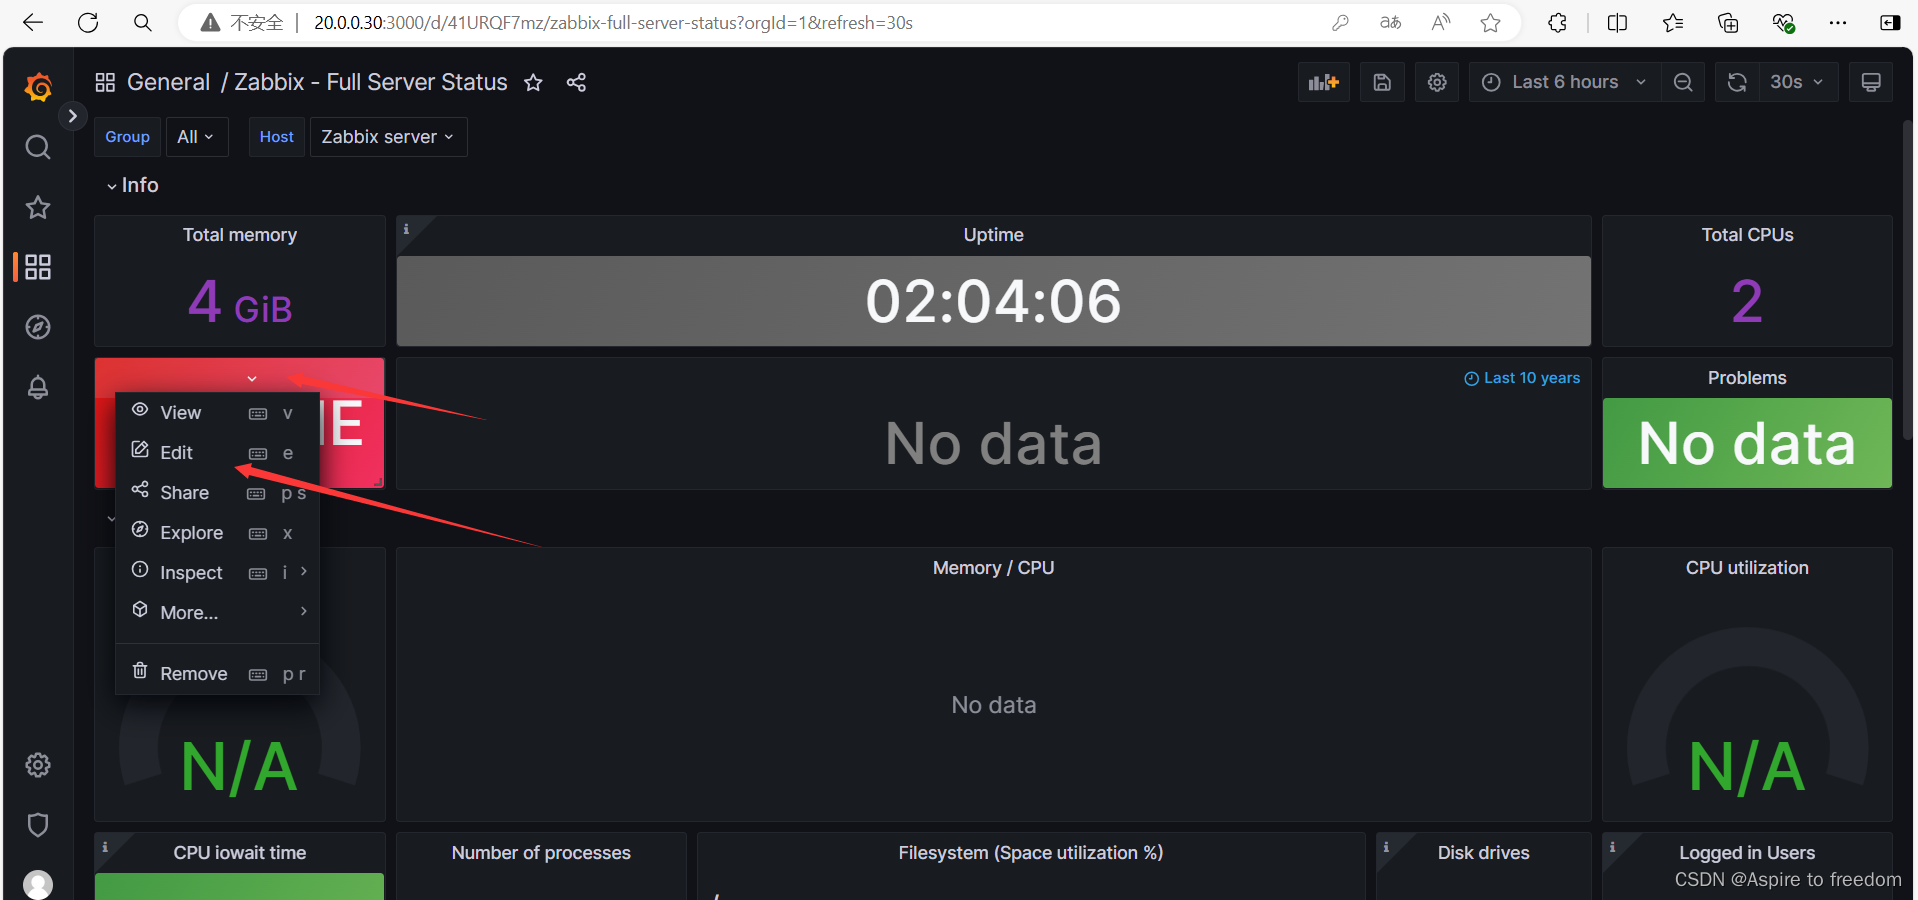
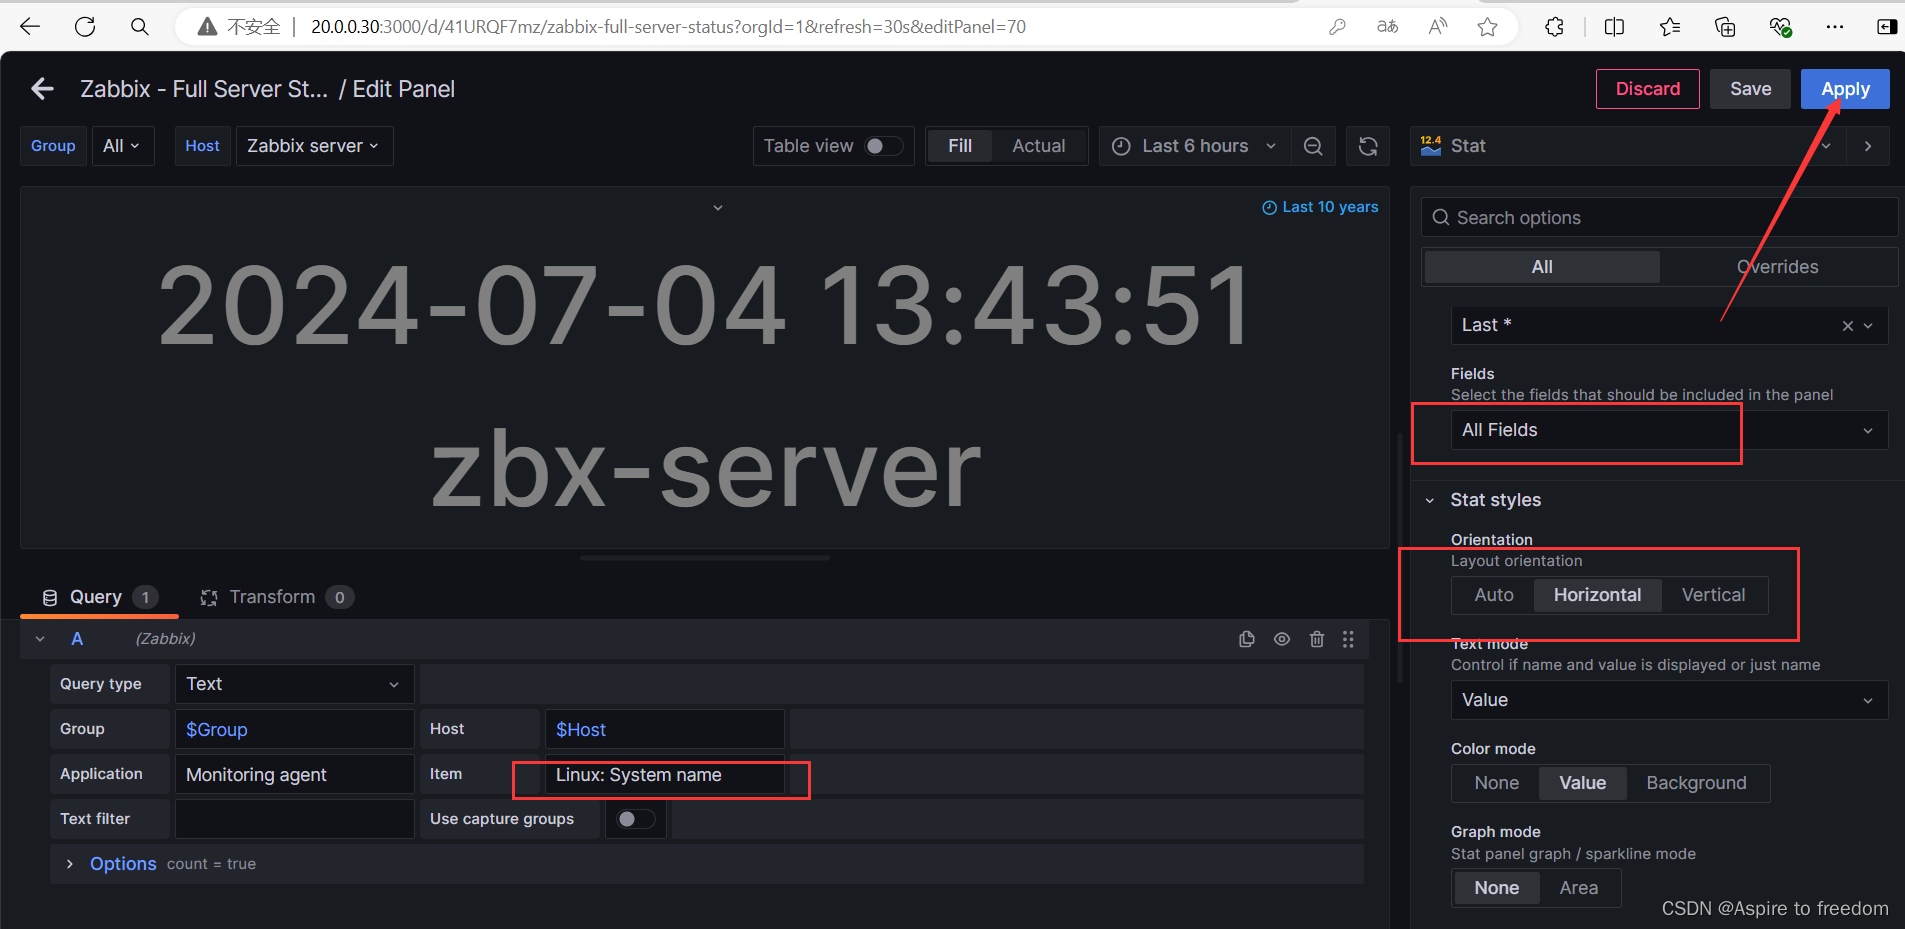
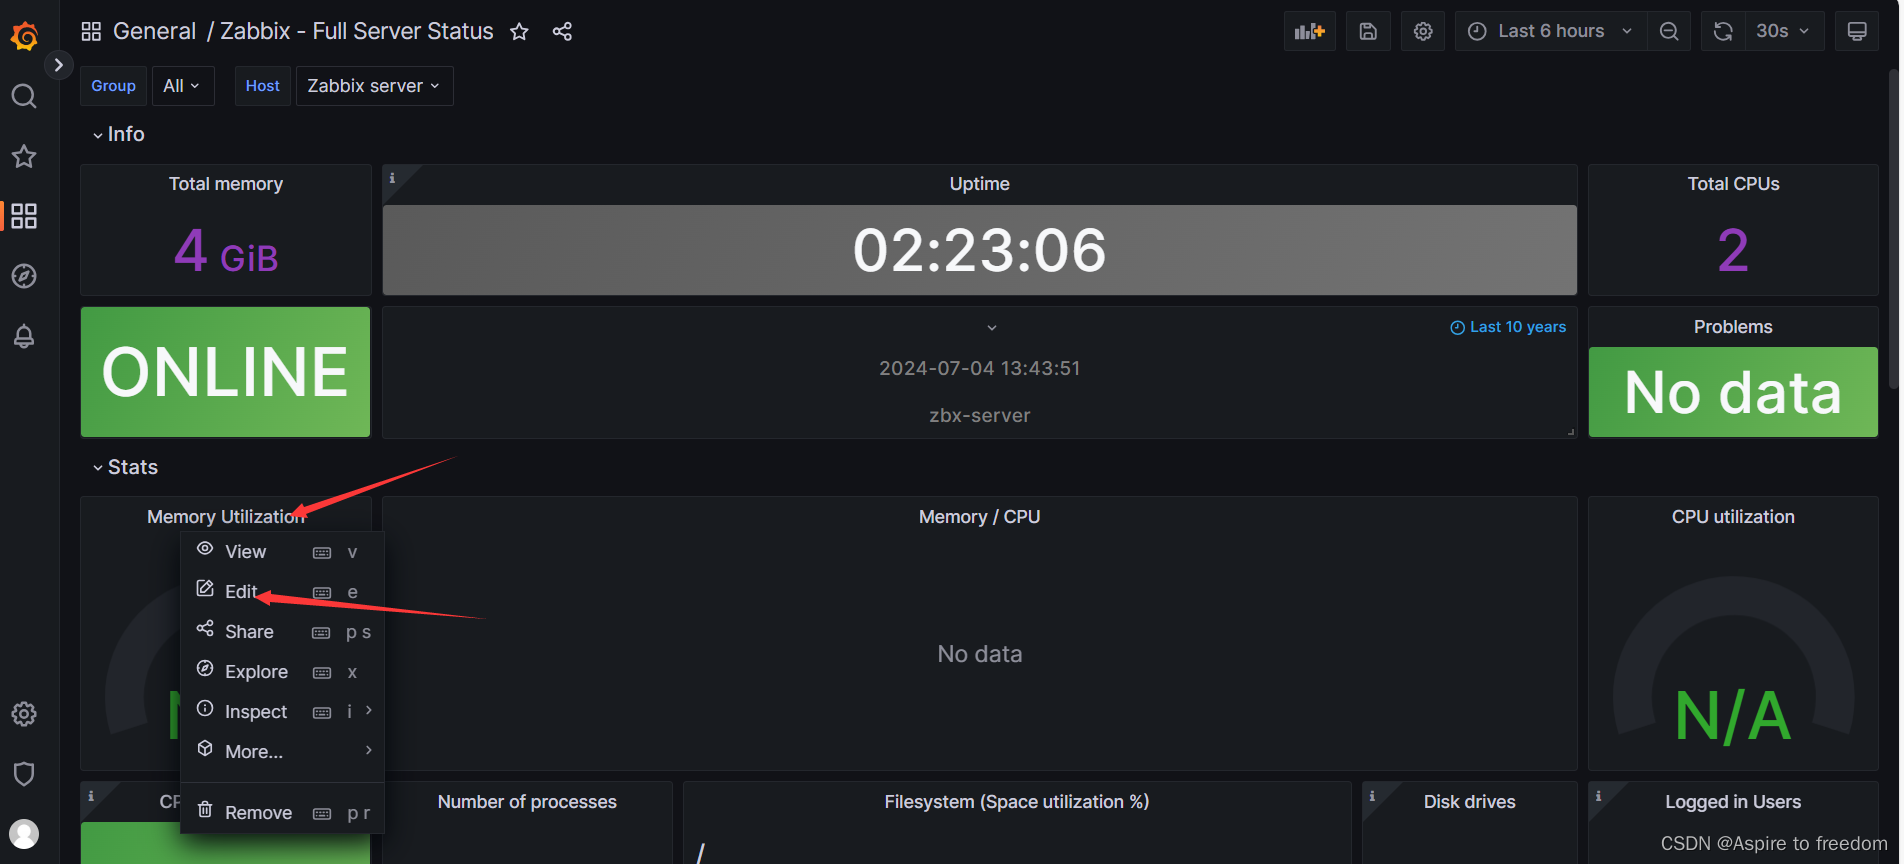
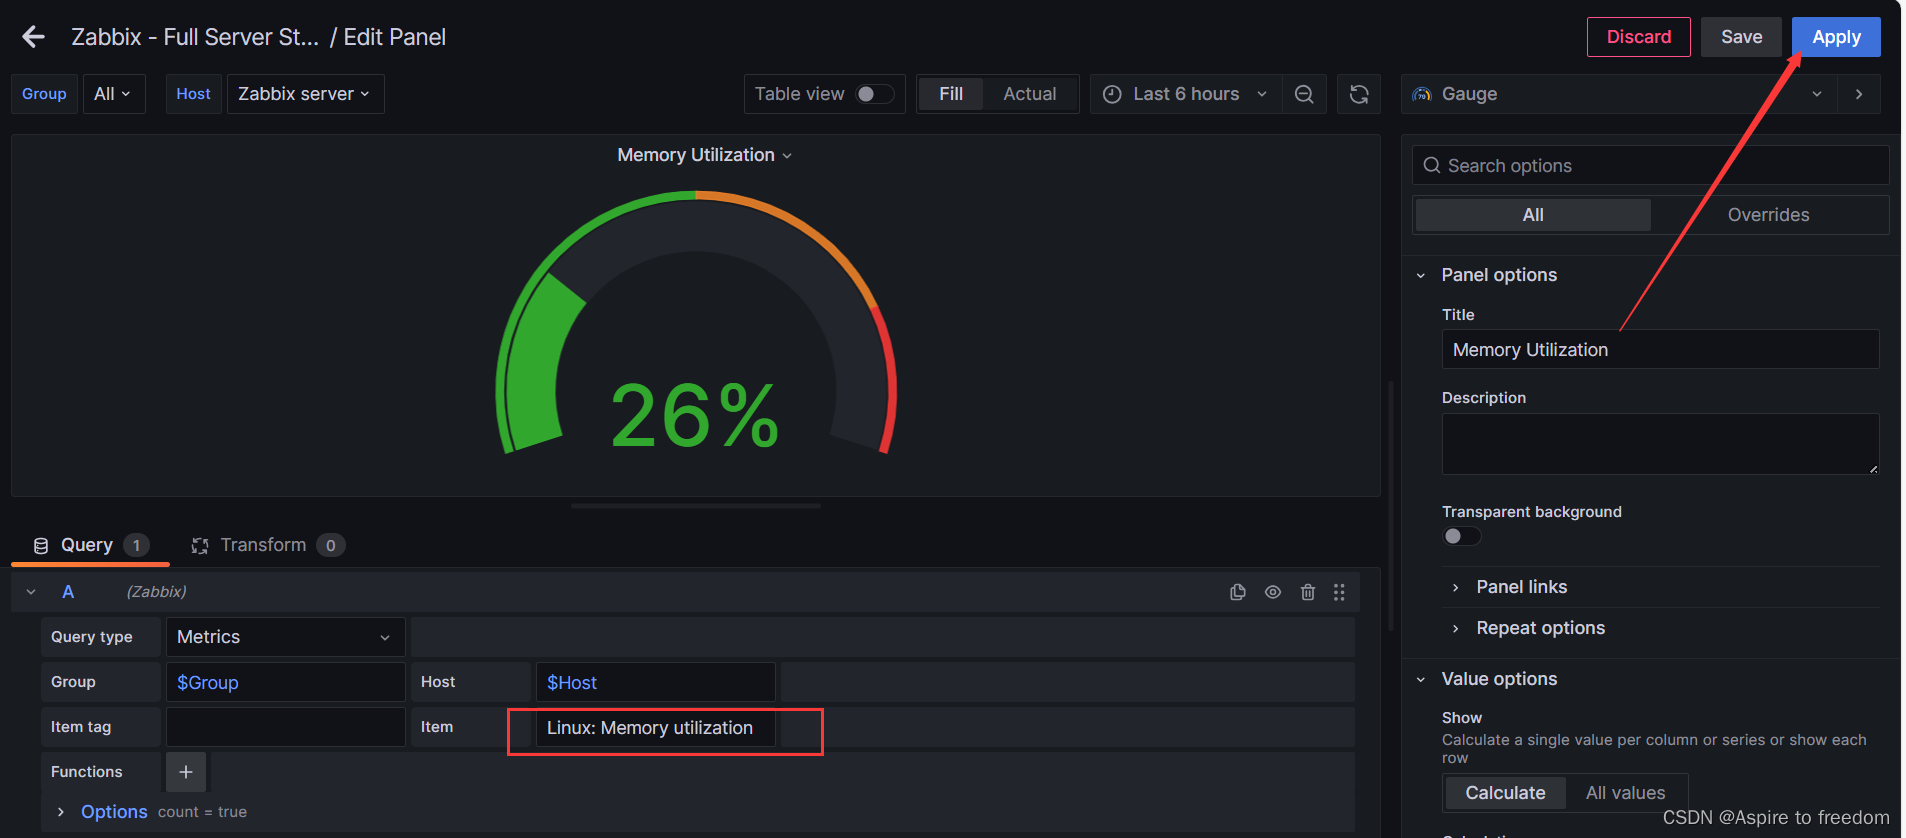
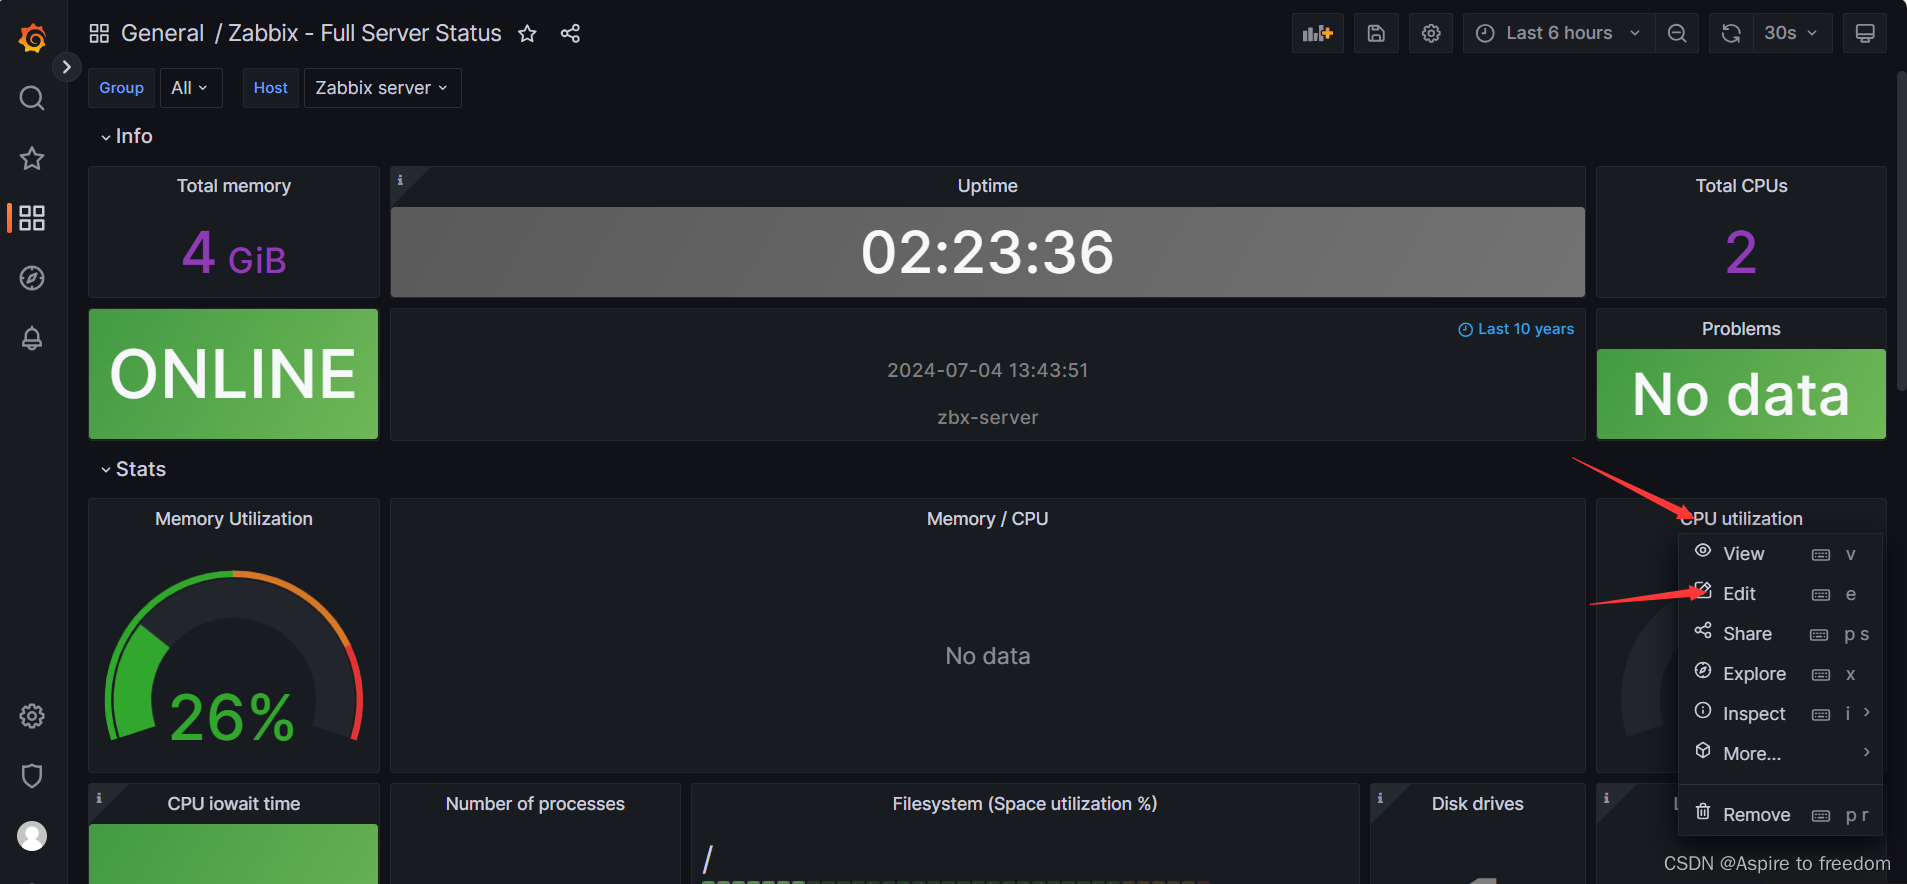
模板调试的步骤
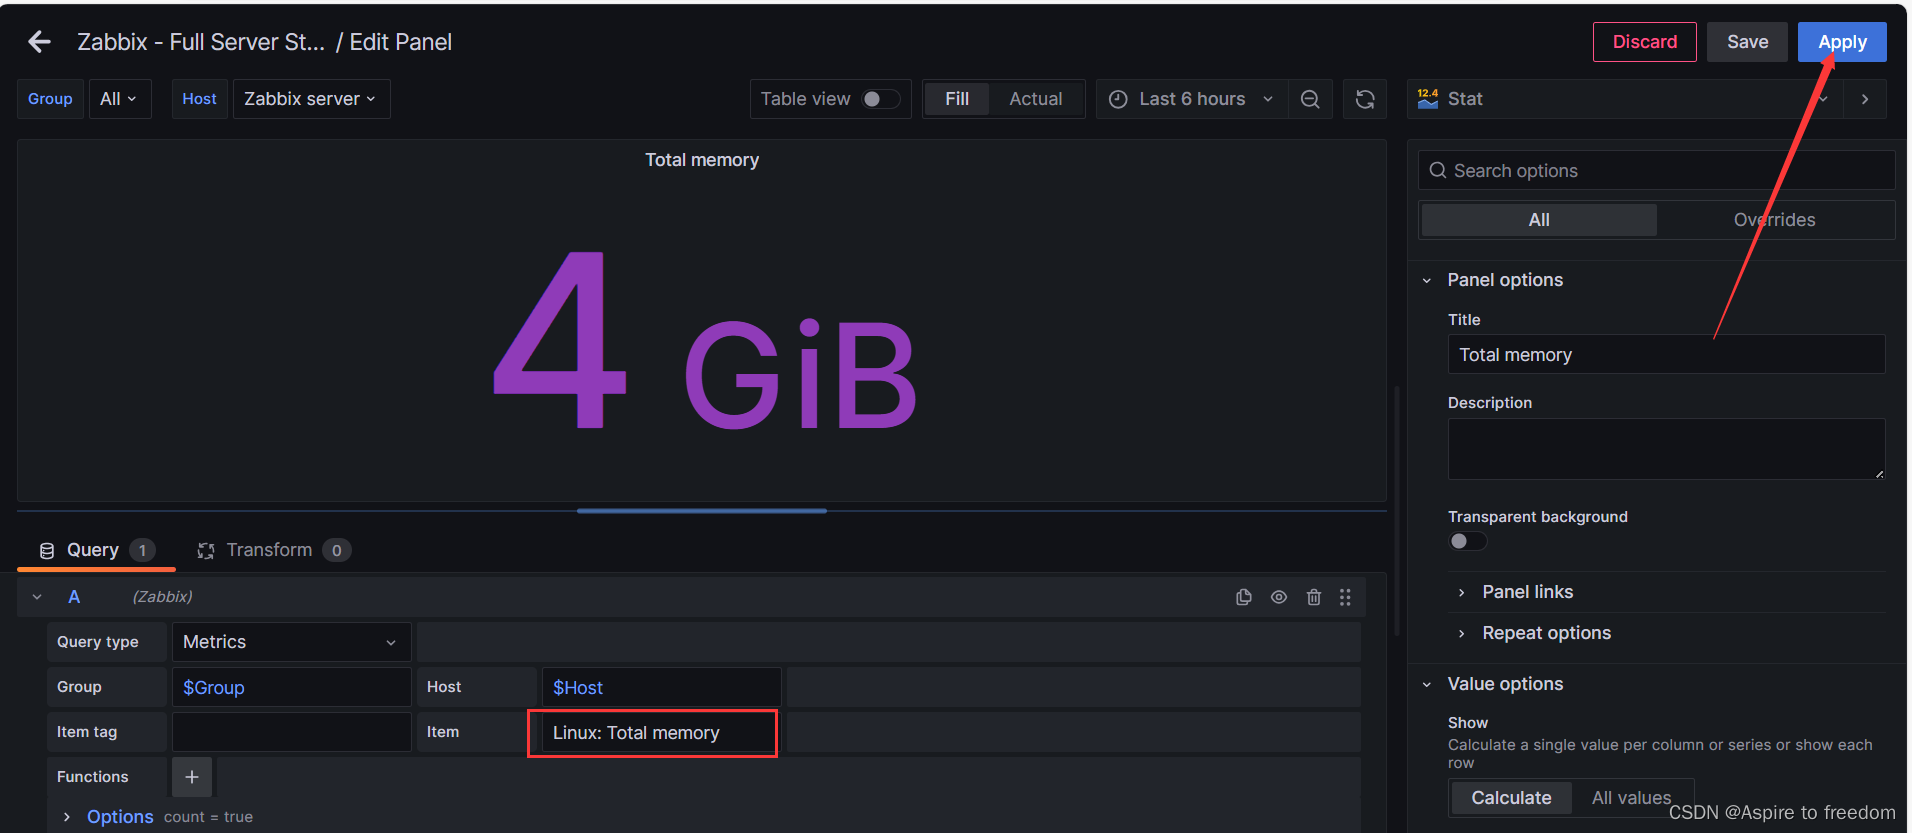
导入模板后有些数据无法显示需要我们手动调试
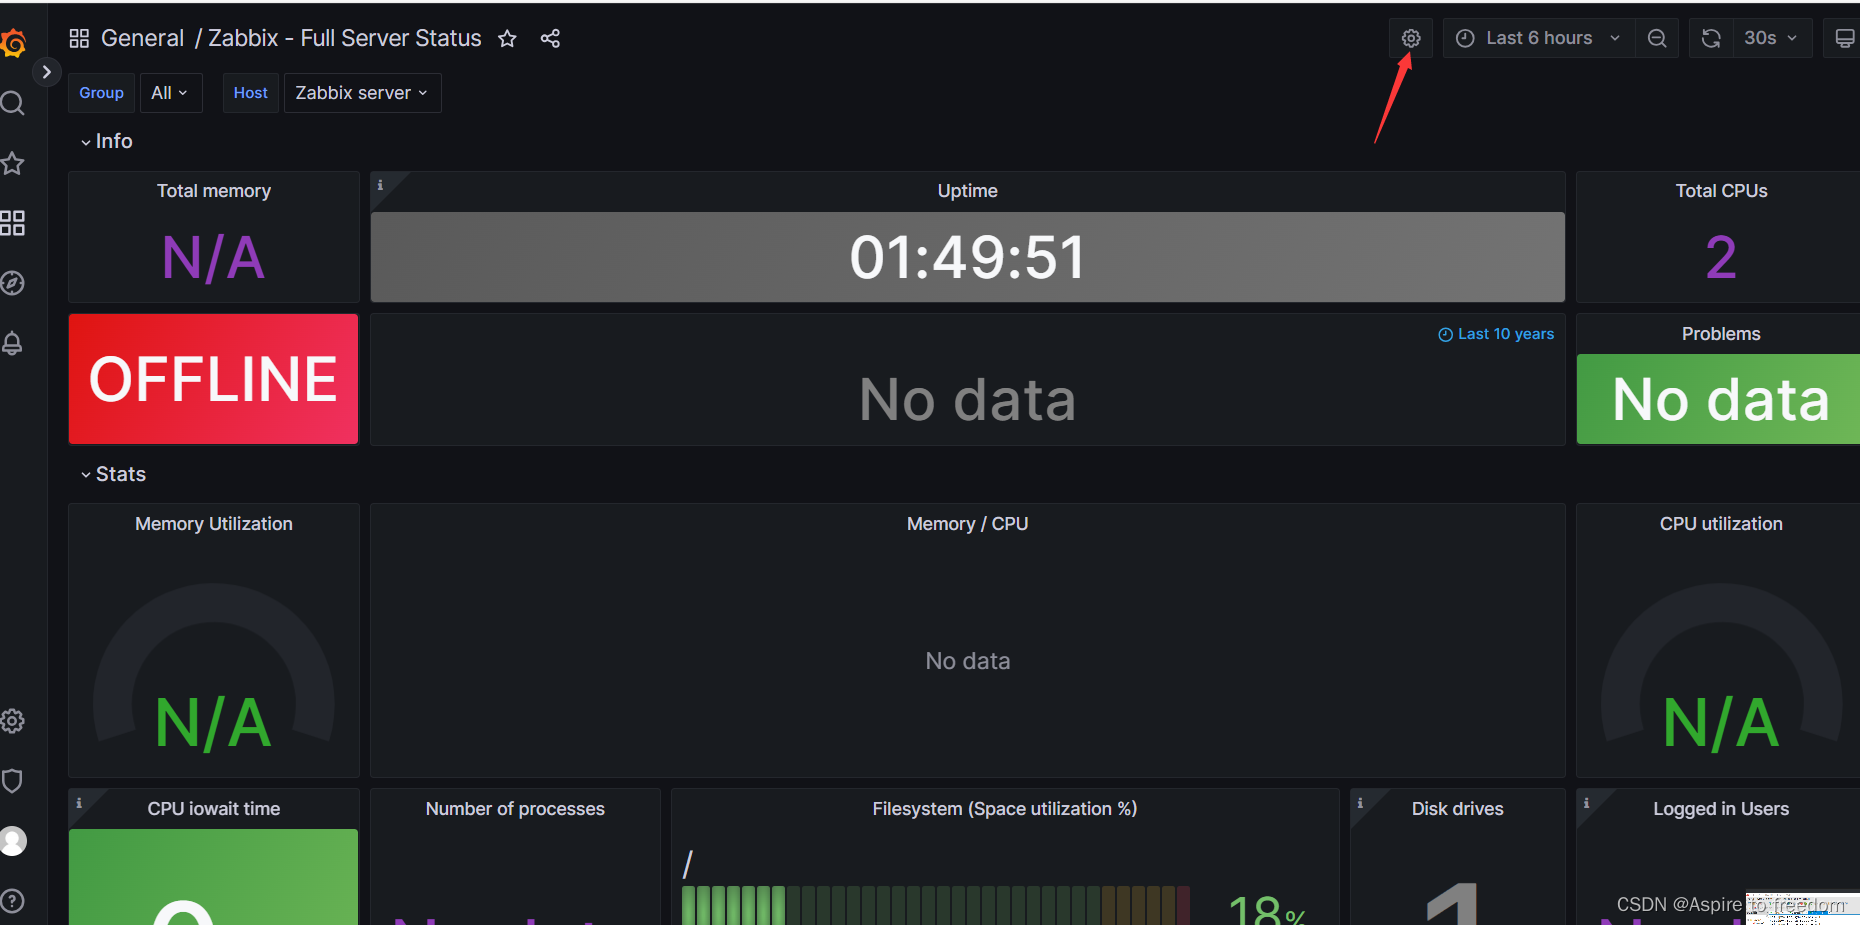
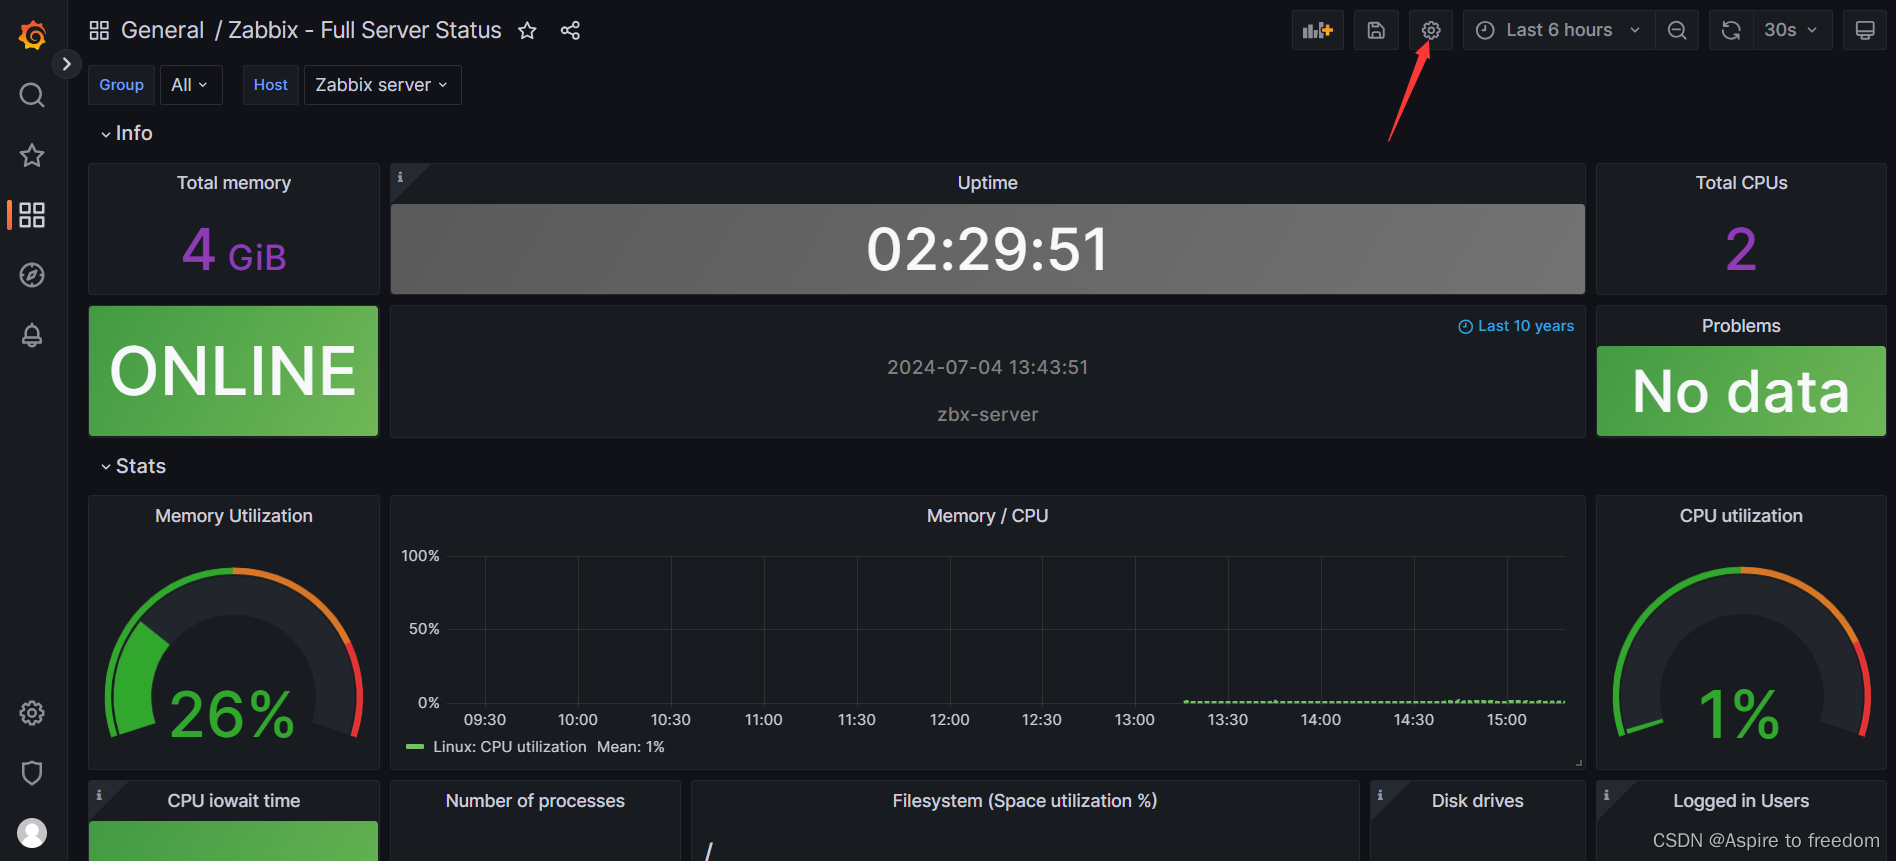
total memory
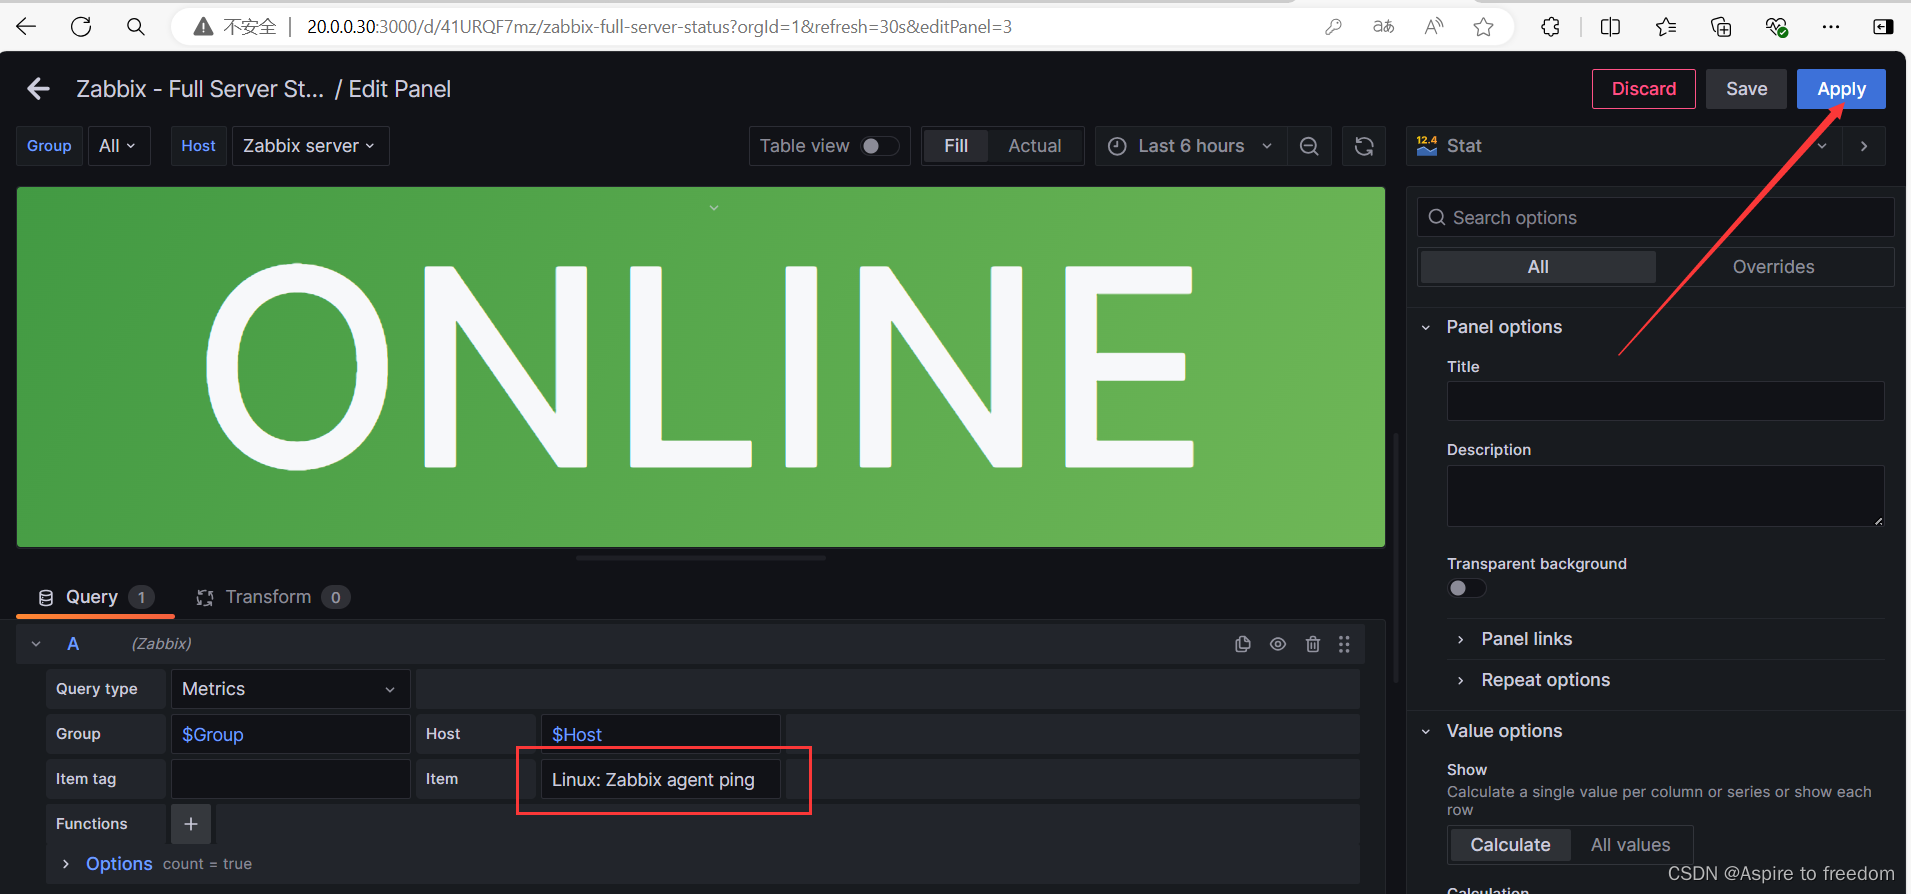
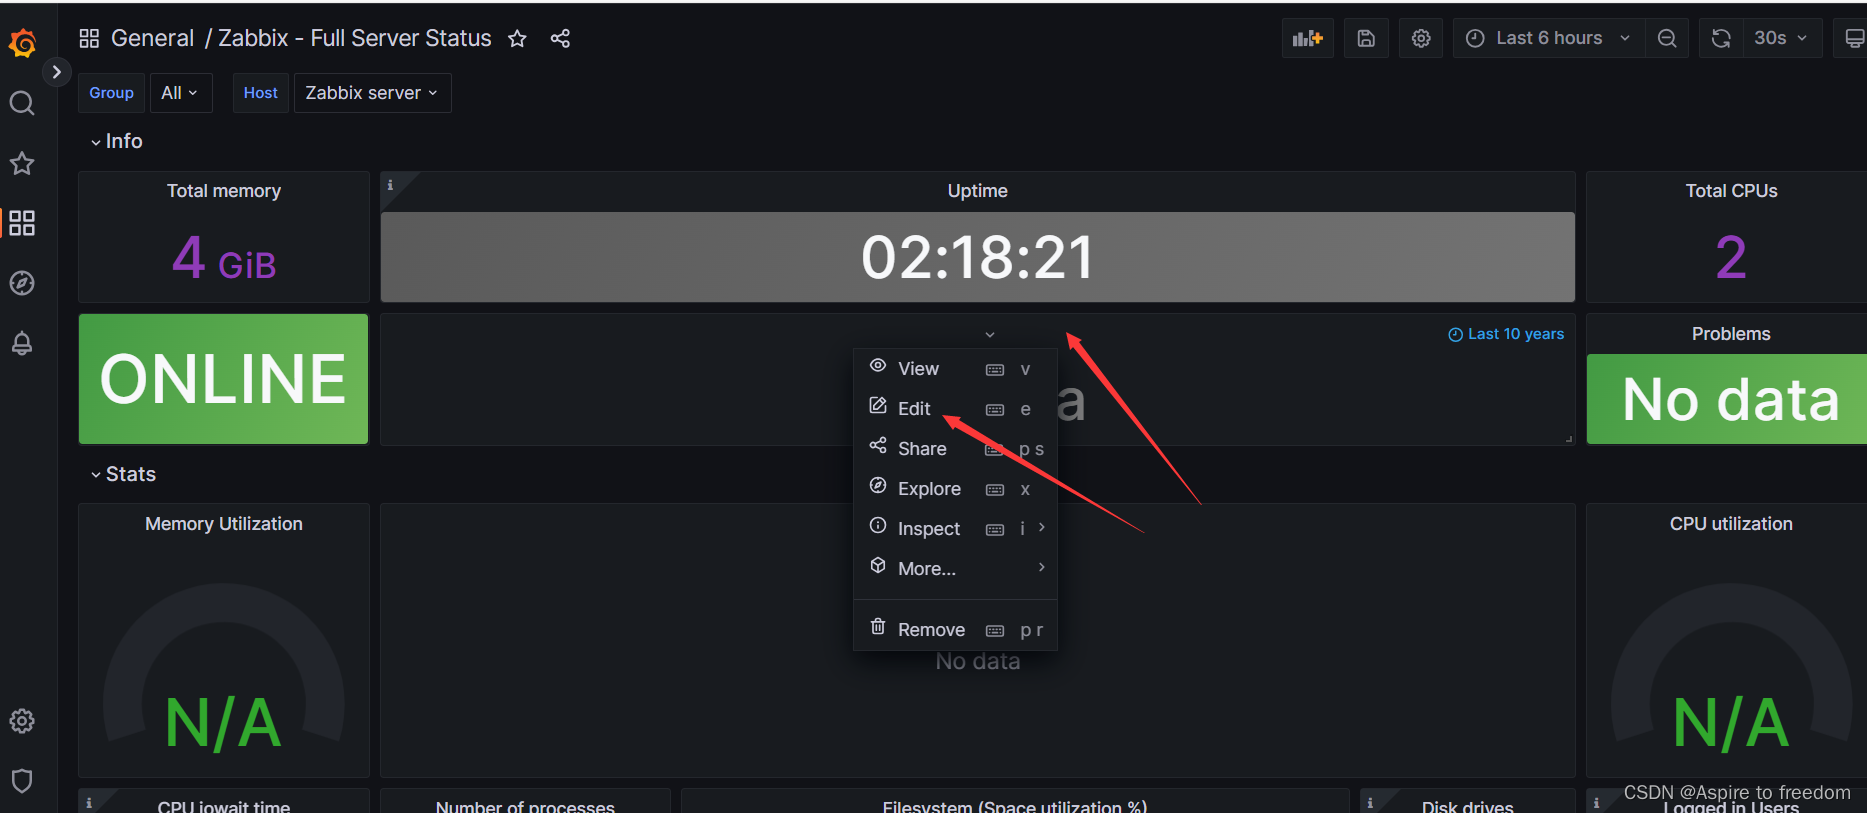
ping
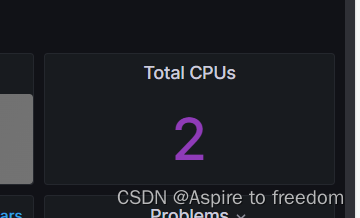
total cpus
host name
Memory Utilization
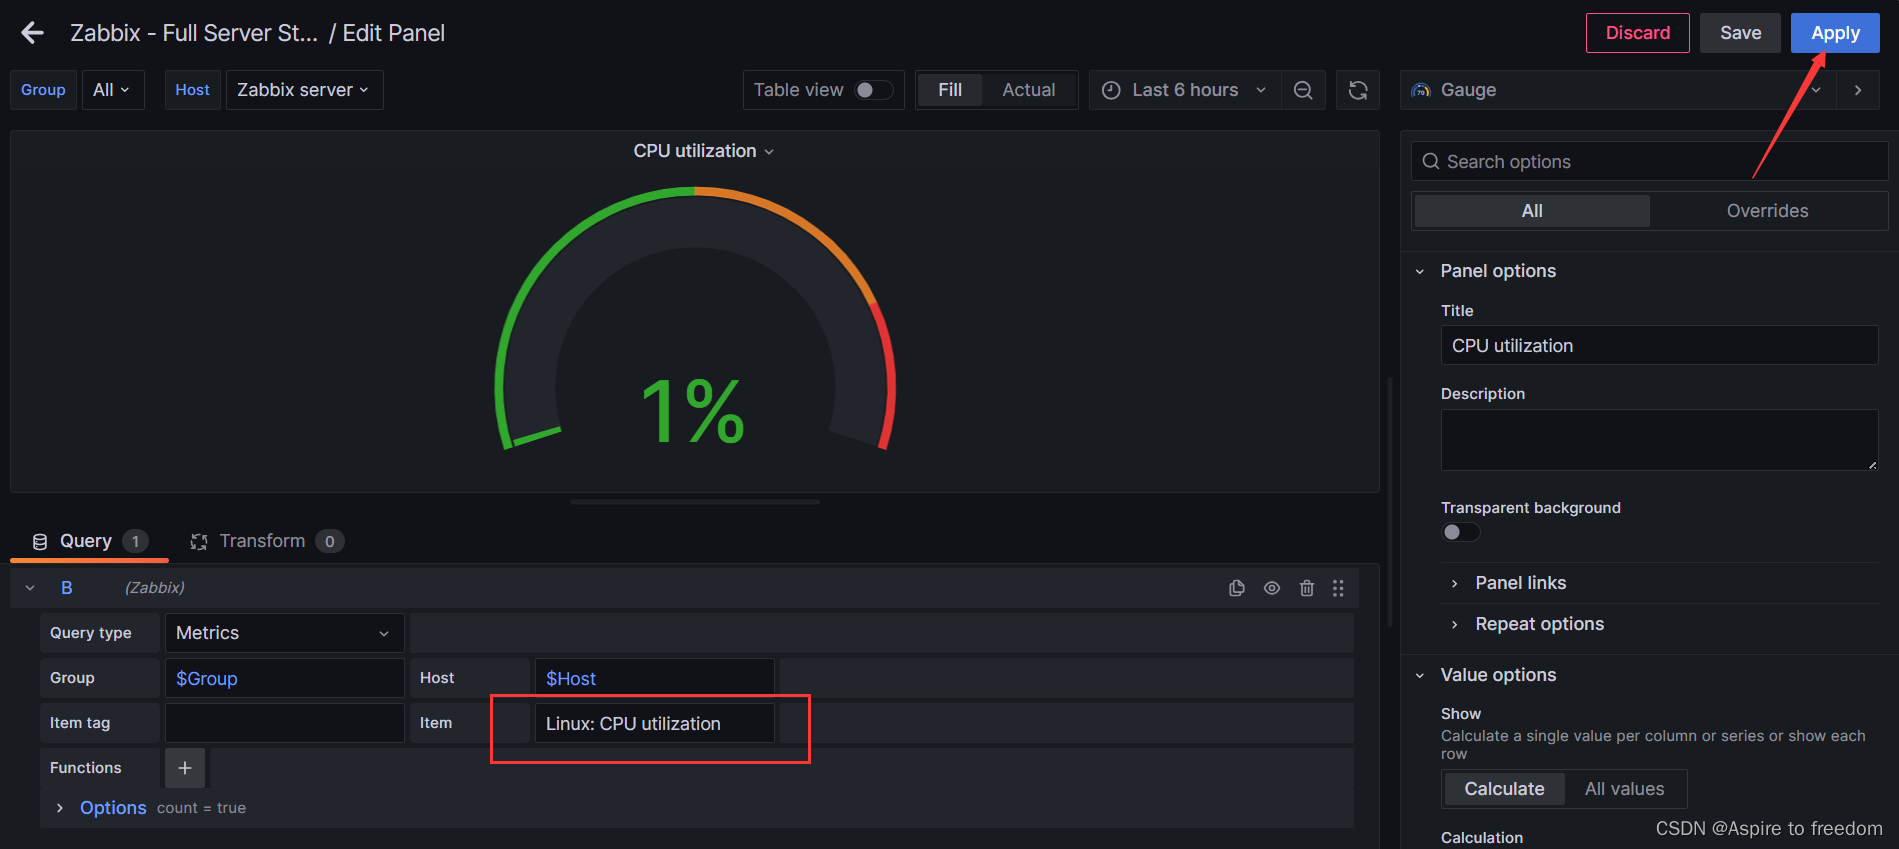
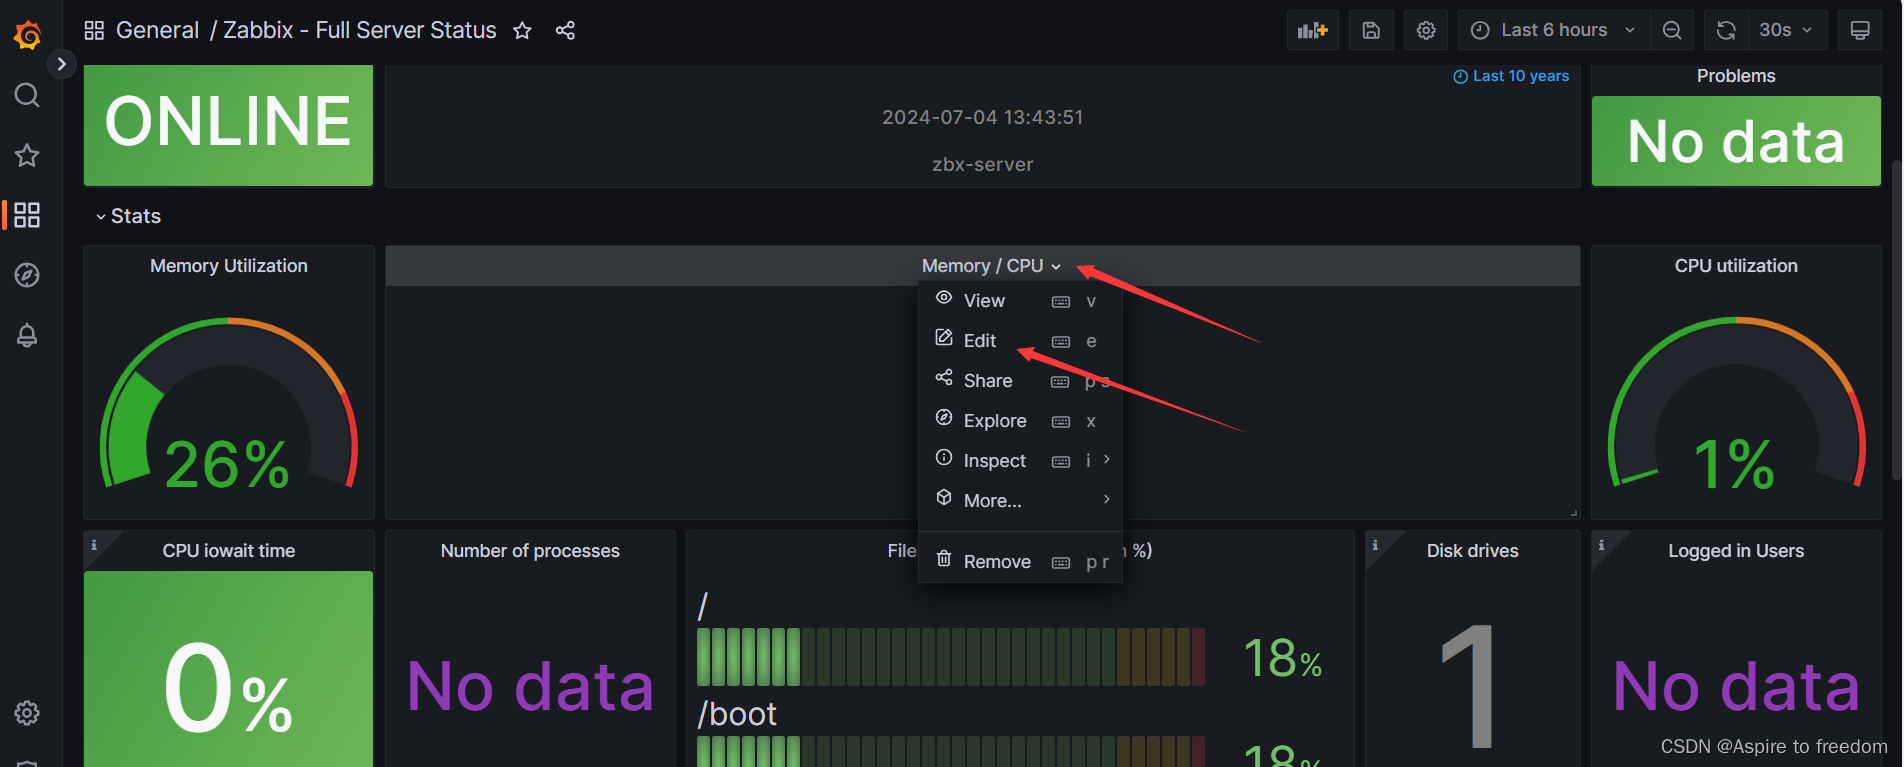
CPU utilization
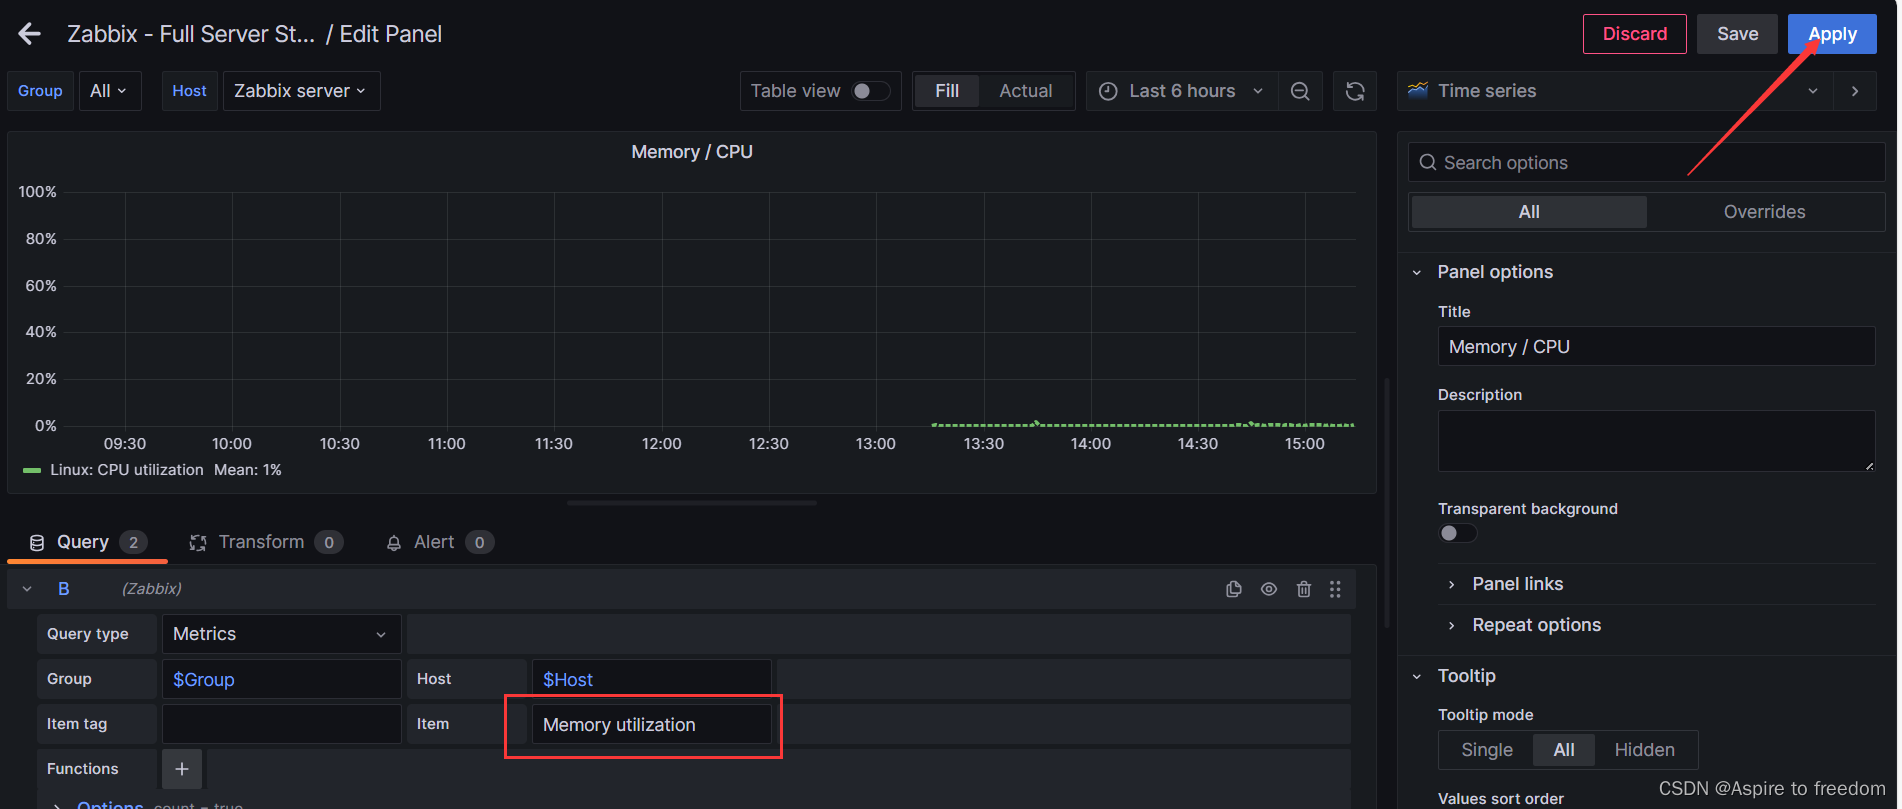
Memory / CPU
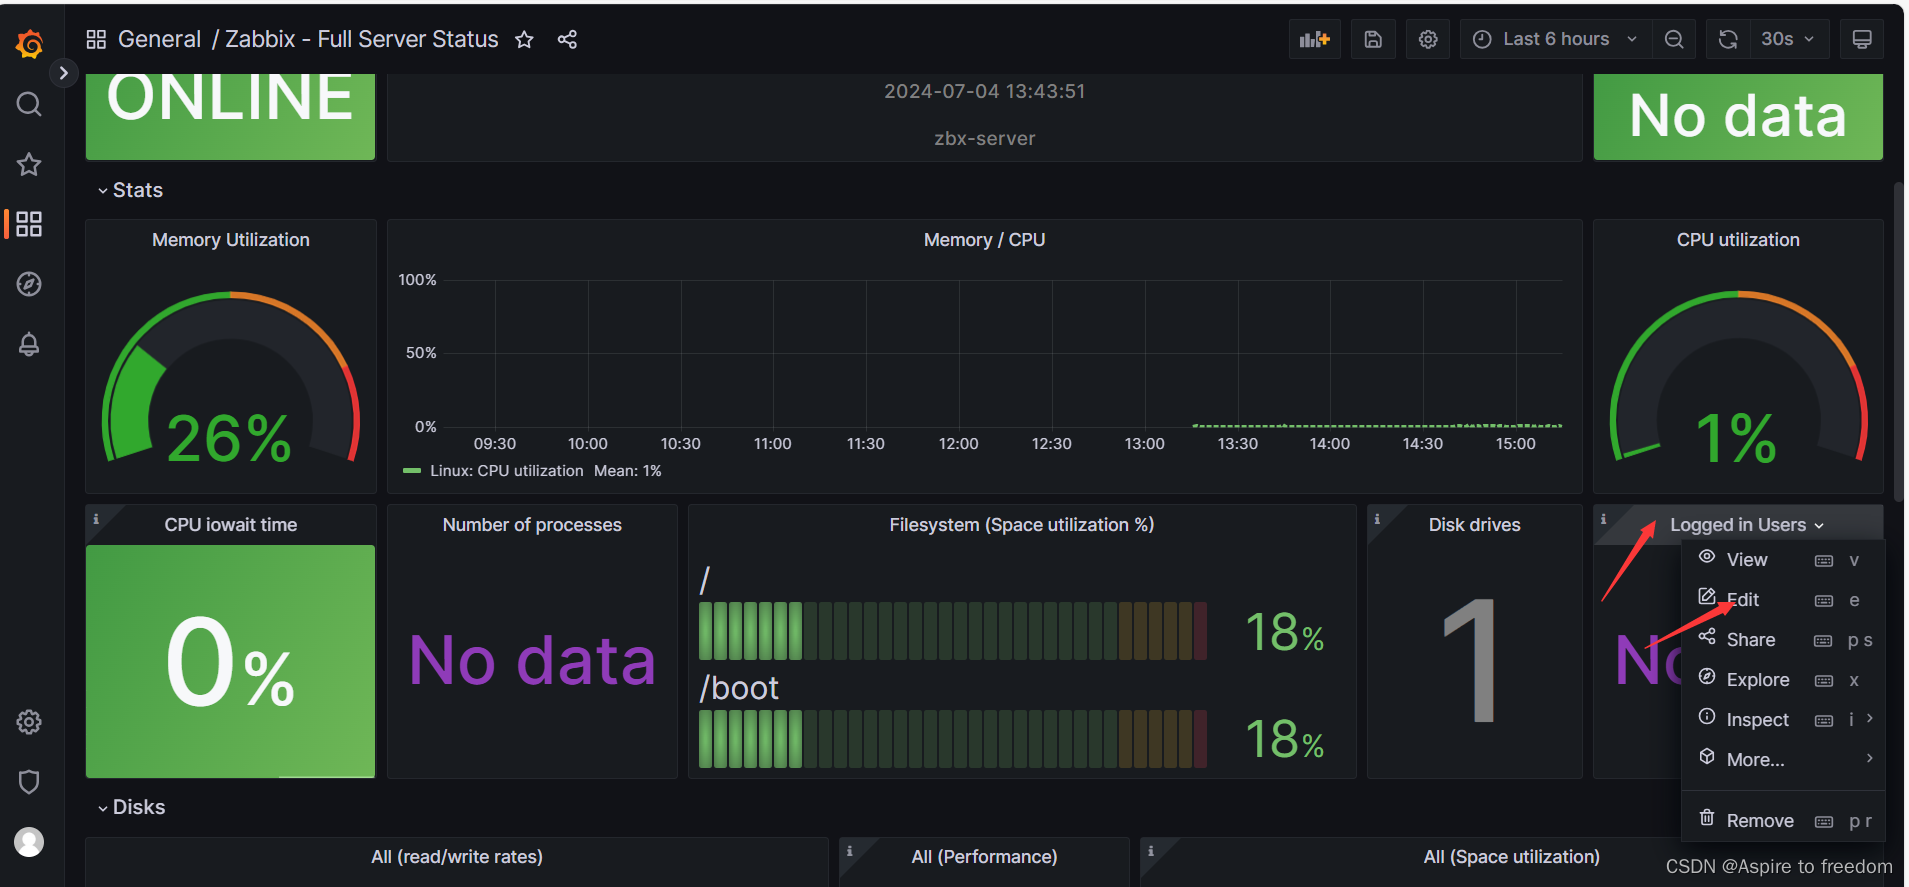
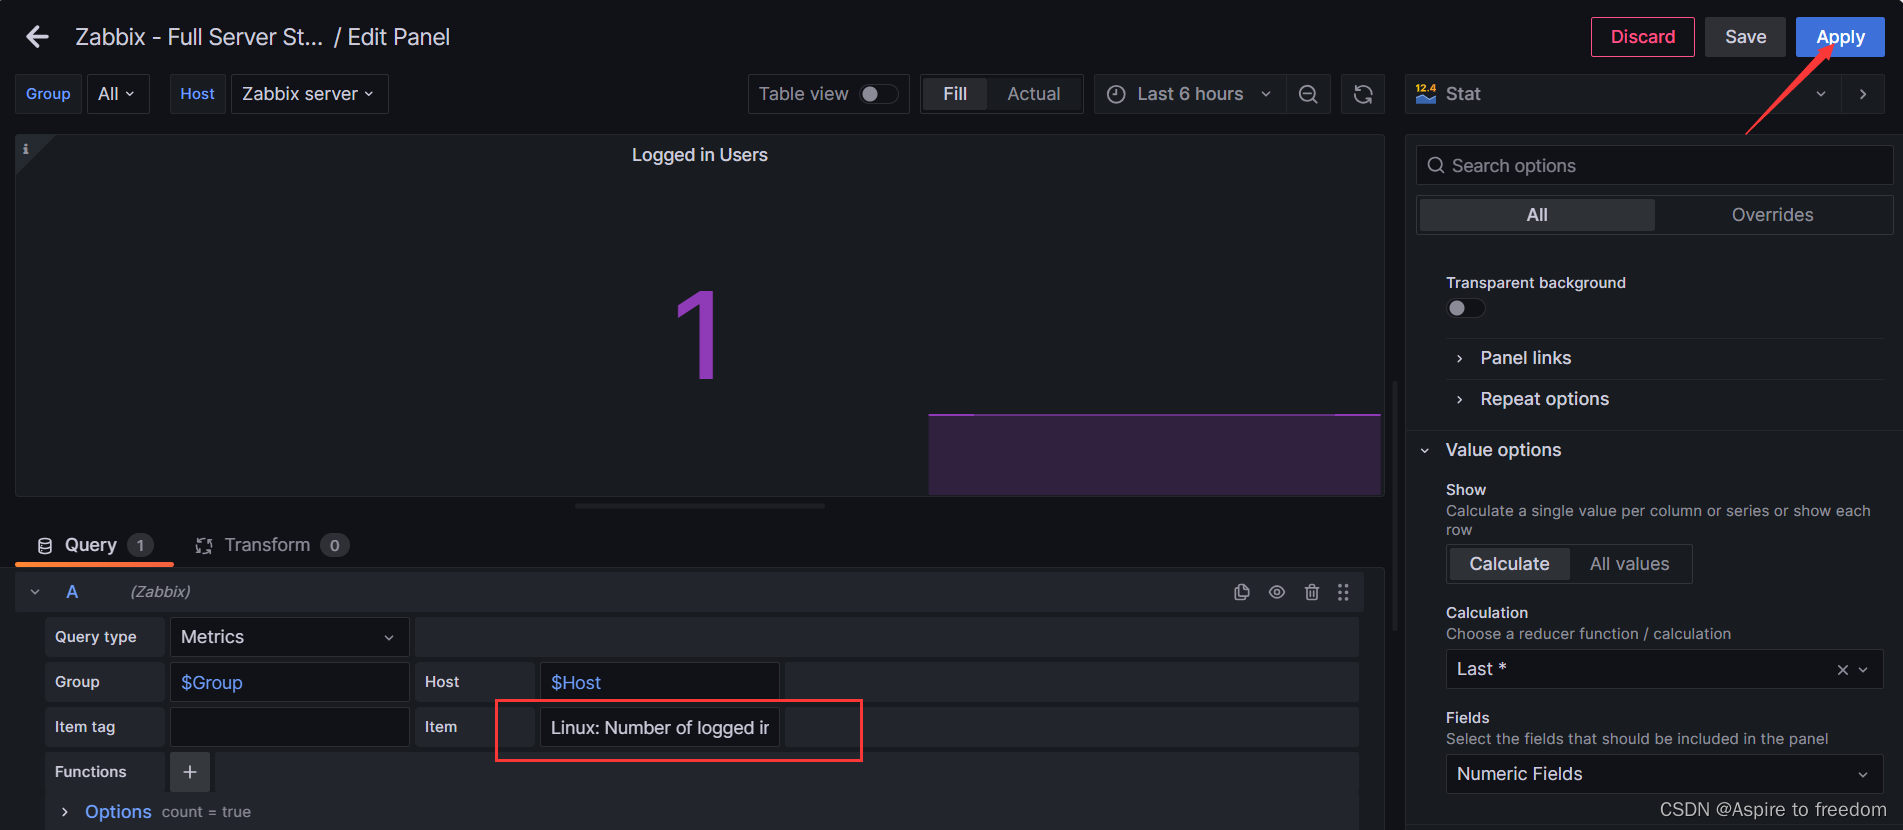
Logged in Users
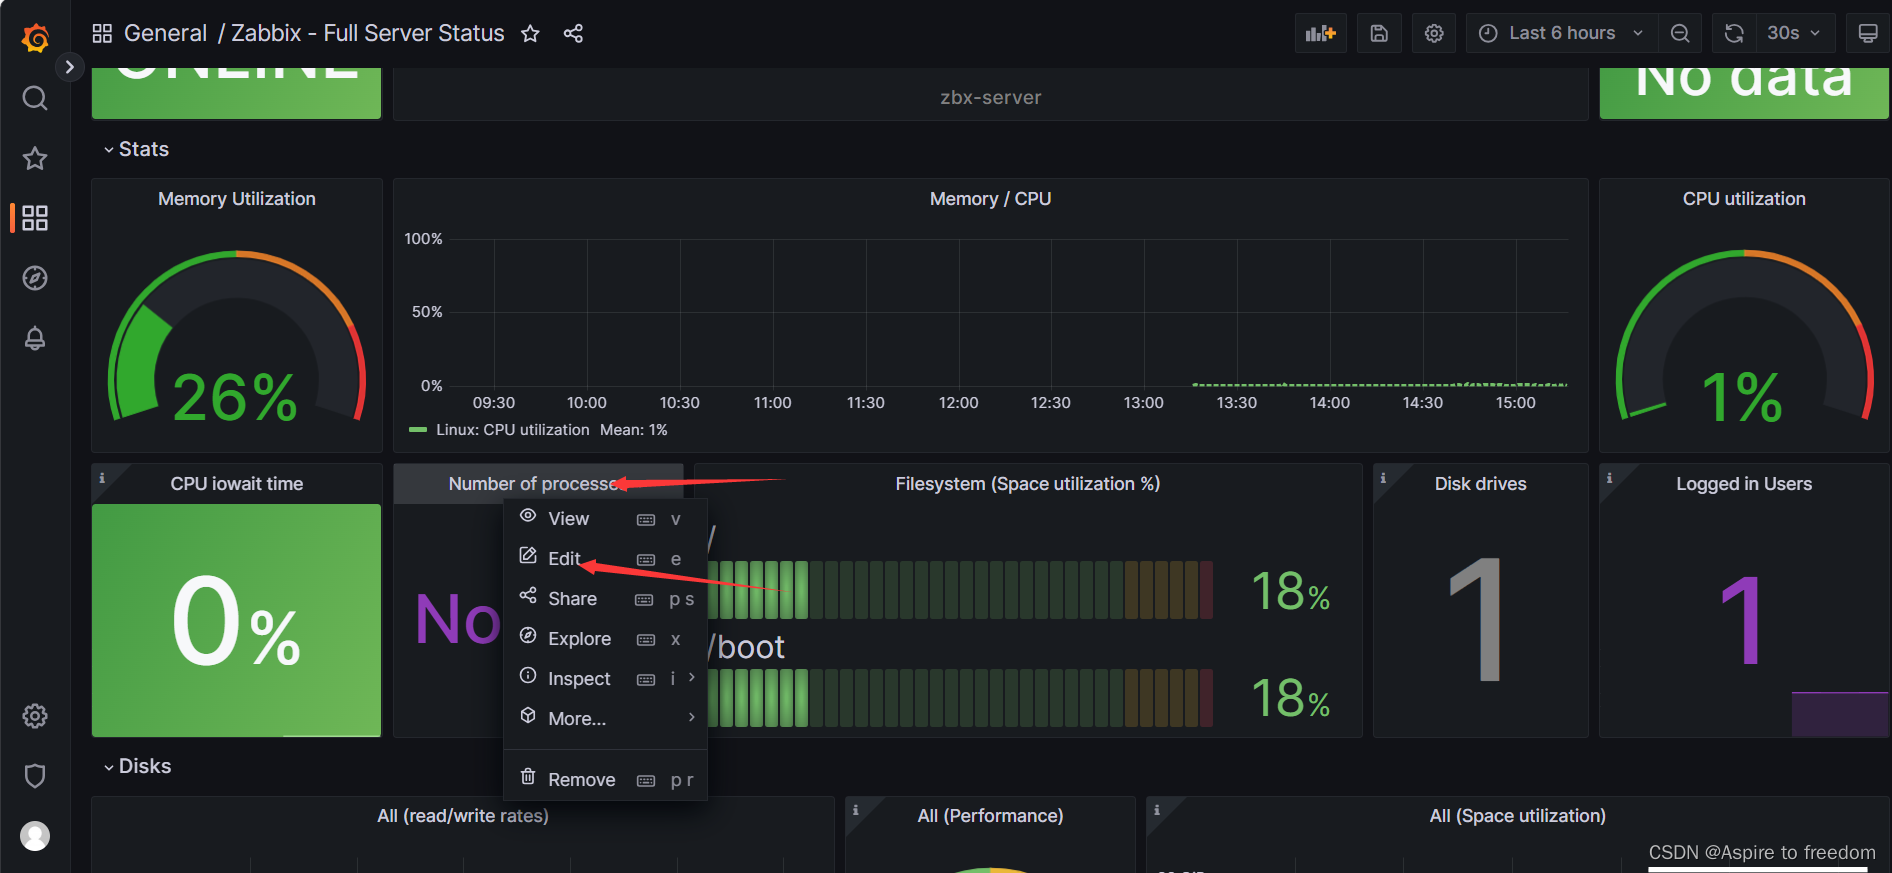
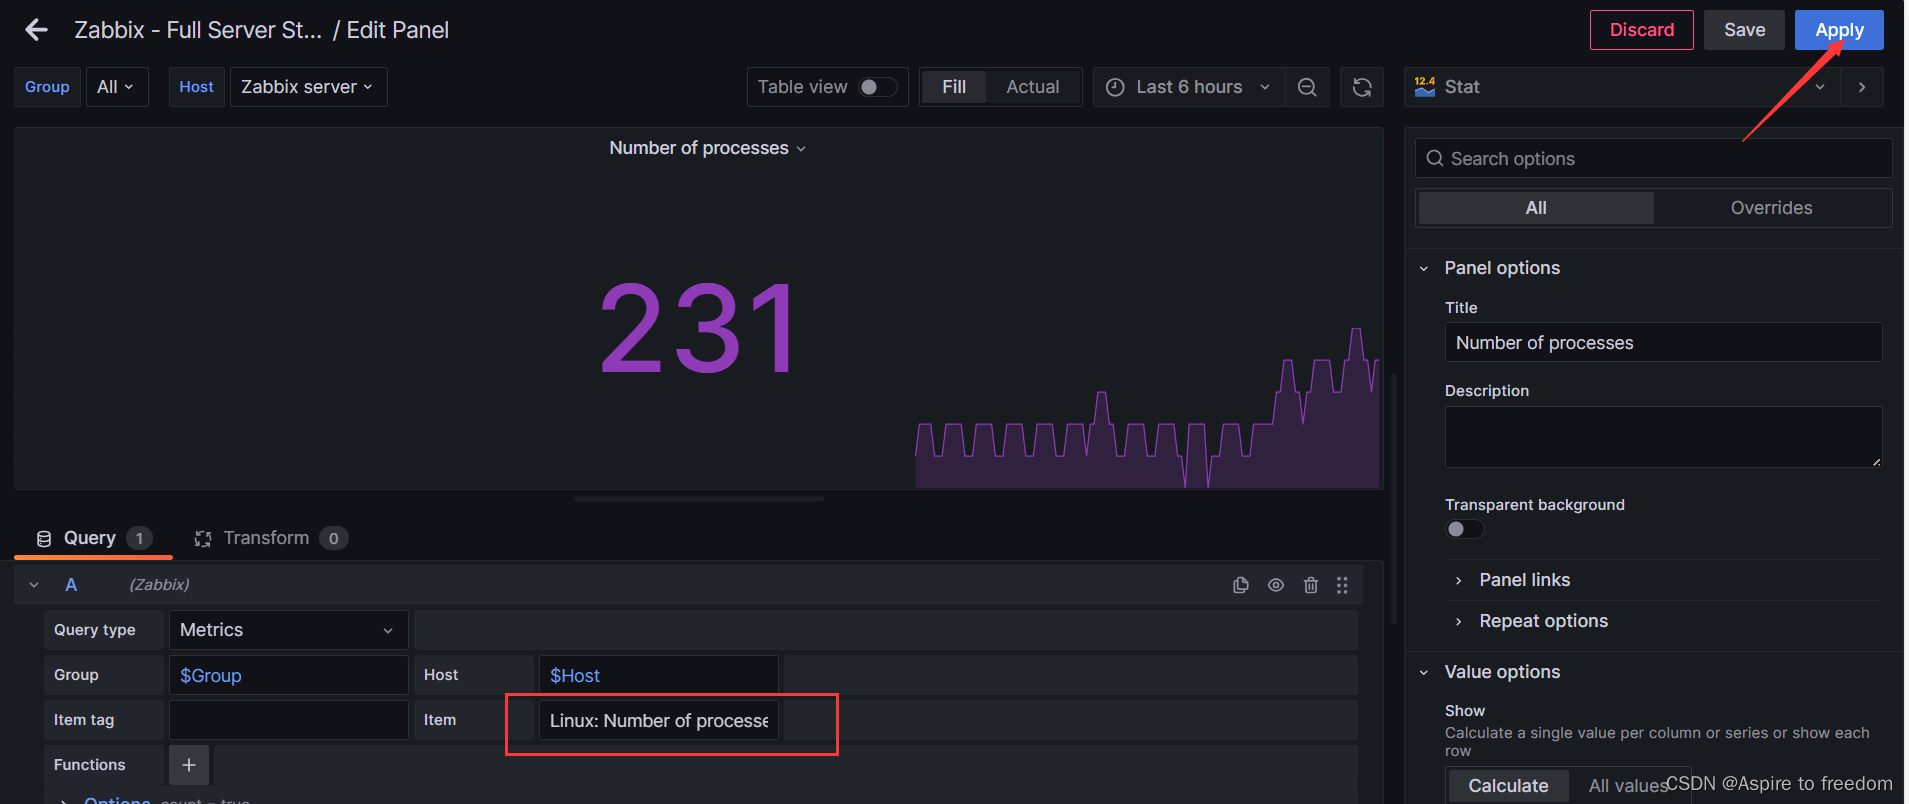
Number of processes
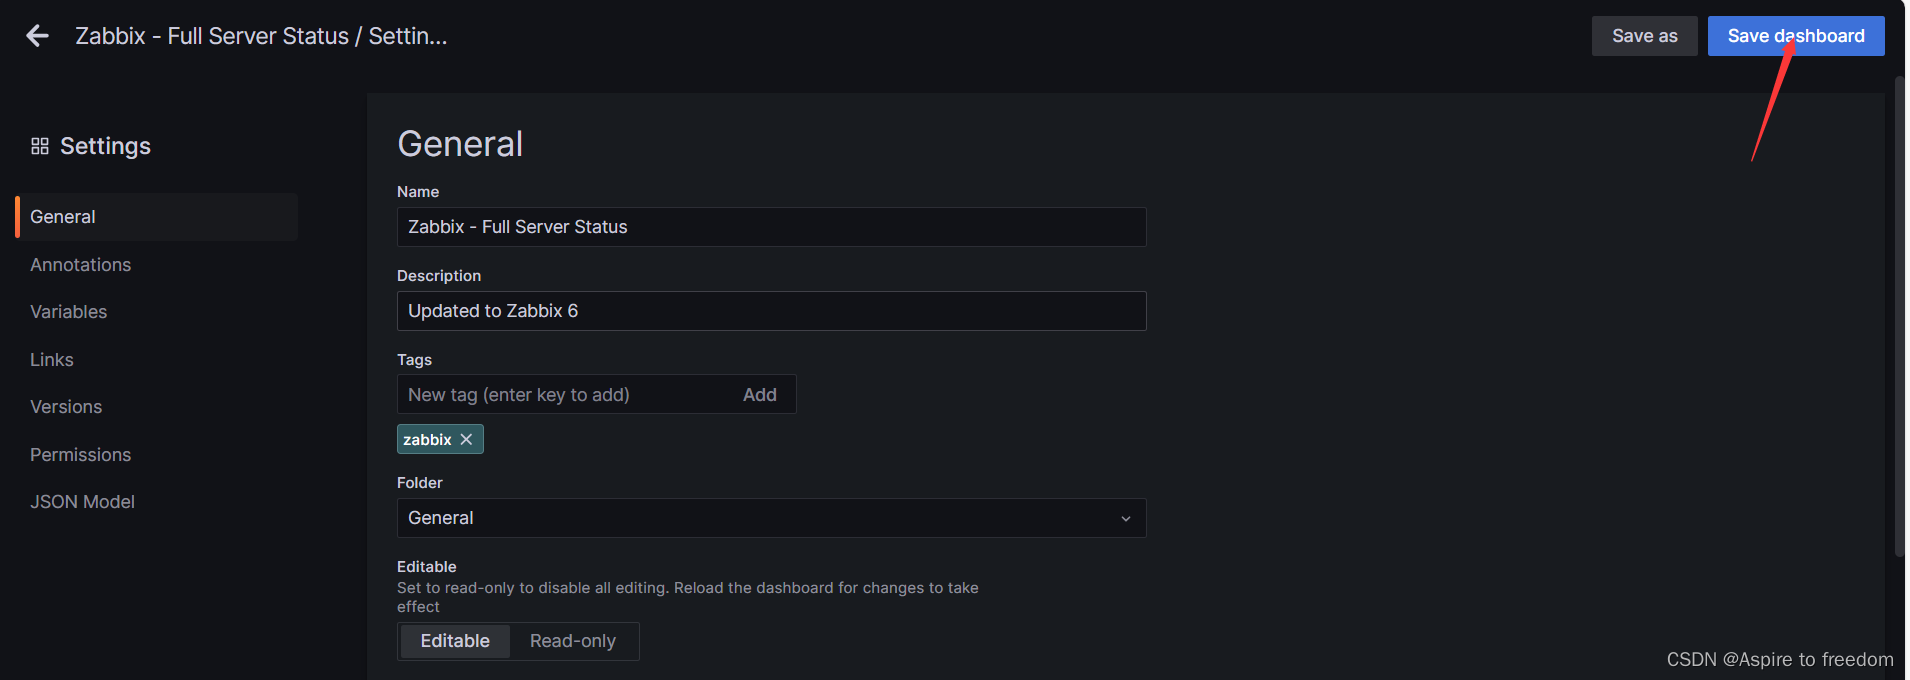
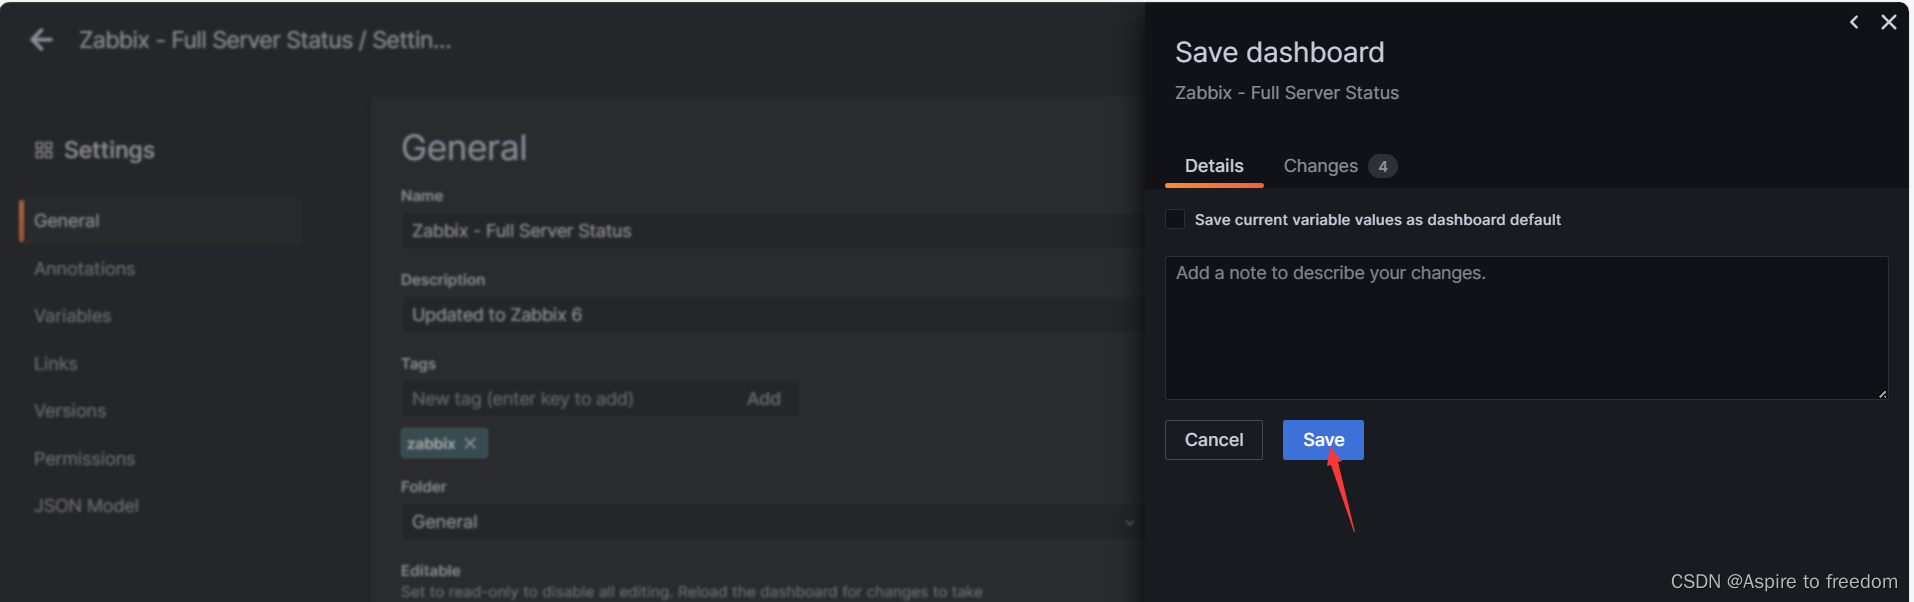
全部完成后保存
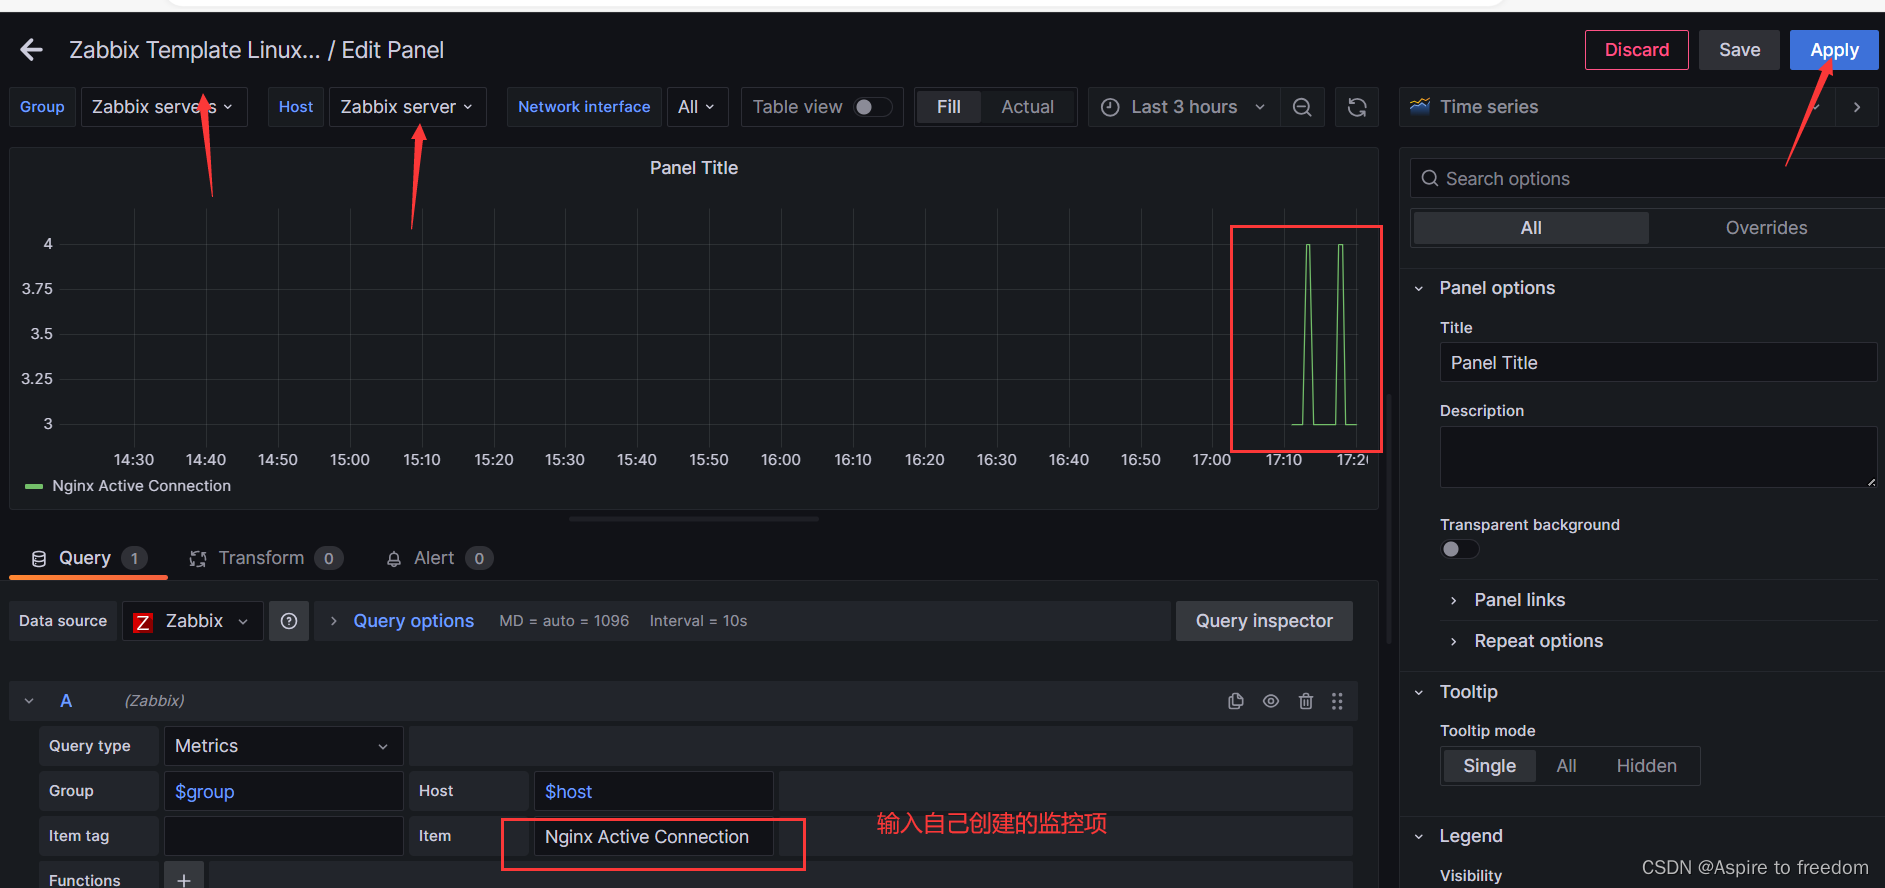
5、使用zabbix监控nginx并发量连接数
使用20.0.0.10服务器;因为该服务器原本已安装nginx,因此省略安装步骤
(1)修改nginx配置
[root@zbx-server ~]# vim /etc/nginx/conf.d/default.conf
##12行添加,开启状态统计功能
location /nginx_state {
         stub_status on;
         access_log off;
     }

[root@zbx-server ~]# systemctl reload nginx
[root@zbx-server ~]# curl -s http://20.0.0.10/nginx_state  #即可使用此命令查看并发量信息
Active connections: 4
server accepts handled requests
 3088 3088 3325
Reading: 0 Writing: 1 Waiting: 3
[root@zbx-server ~]#
(2)编写监控数据脚本
[root@zbx-server ~]# cd /etc/zabbix/zabbix_agent2.d/
[root@zbx-server zabbix_agent2.d]# vim nginx_status.sh
#!/bin/bash
IP=20.0.0.10  ##本机ip
PORT=80
STUB_URI=nginx_state

active() {
    curl -s http://$IP:$PORT/$STUB_URI | awk 'NR==1 {print $3}'
}

accepts() {
    curl -s http://$IP:$PORT/$STUB_URI | awk 'NR==3 {print $1}'
}

handled() {
    curl -s http://$IP:$PORT/$STUB_URI | awk 'NR==3 {print $2}'
}

requests() {
    curl -s http://$IP:$PORT/$STUB_URI | awk 'NR==3 {print $3}'
}

Reading() {
    curl -s http://$IP:$PORT/$STUB_URI | awk 'NR==4 {print $2}'
}

Writing() {
    curl -s http://$IP:$PORT/$STUB_URI | awk 'NR==4 {print $4}'
}

Waiting() {
    curl -s http://$IP:$PORT/$STUB_URI | awk 'NR==4 {print $6}'
}

process() {
    pidof nginx | wc -w
}

case $1 in
active)
    active
    ;;
accepts)
    accepts
    ;;
handled)
    handled
    ;;
requests)
    requests
    ;;
Reading)
    Reading
    ;;
Writing)
    Writing
    ;;
Waiting)
    Waiting
    ;;
process)
    process
    ;;
*)
    echo "$Usage: $0 {active|accepts|handled|requests|Reading|Writing|Waiting|process}"
    exit 1
esac
exit 0

[root@zbx-server zabbix_agent2.d]# chmod +x nginx_status.sh
[root@zbx-server zabbix_agent2.d]# ./nginx_status.sh accepts ##测试脚本显示结果就算成功
3180
[root@zbx-server zabbix_agent2.d]# ./nginx_status.sh active
1
[root@zbx-server zabbix_agent2.d]# ./nginx_status.sh process
3
[root@zbx-server zabbix_agent2.d]#
(3)设置键值
[root@zbx-server zabbix_agent2.d]# vim nginx_state.conf
UserParameter=nginx.status[*],/etc/zabbix/zabbix_agent2.d/nginx_status.sh $1
[root@zbx-server zabbix_agent2.d]# systemctl restart zabbix-agent2.service
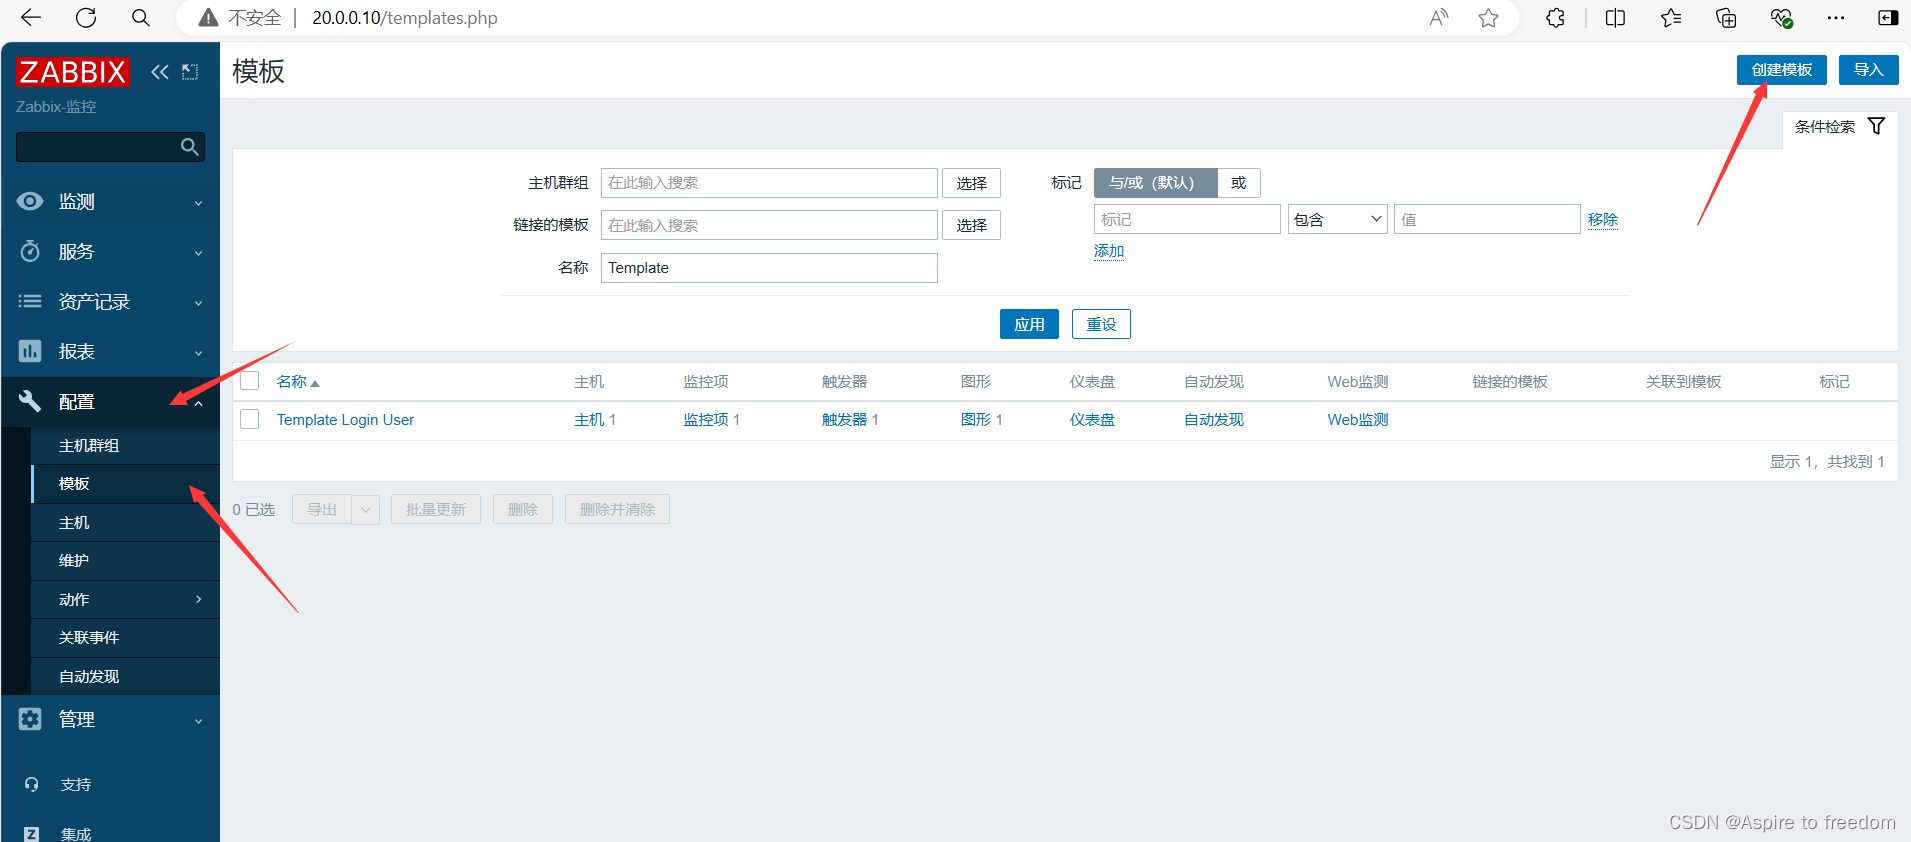
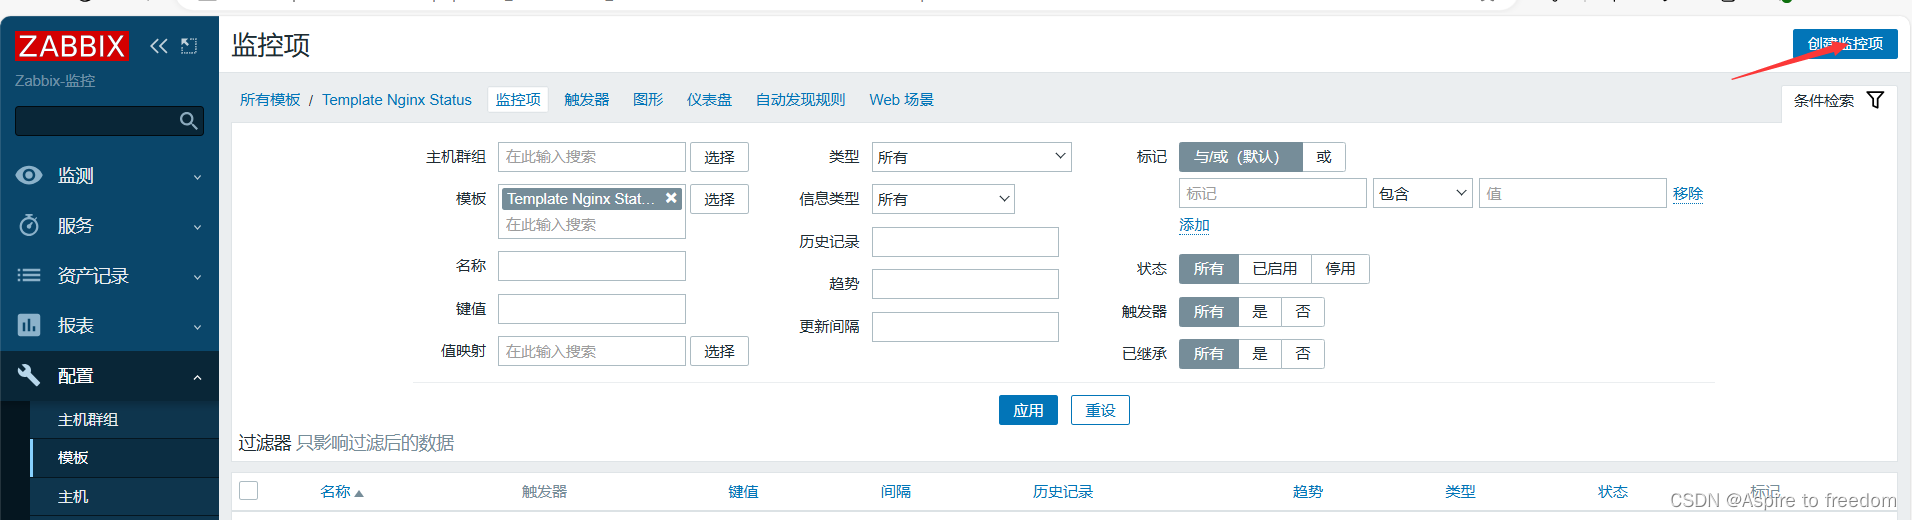
[root@zbx-server zabbix_agent2.d]#(4)在zabbix web端完成自定义监控项
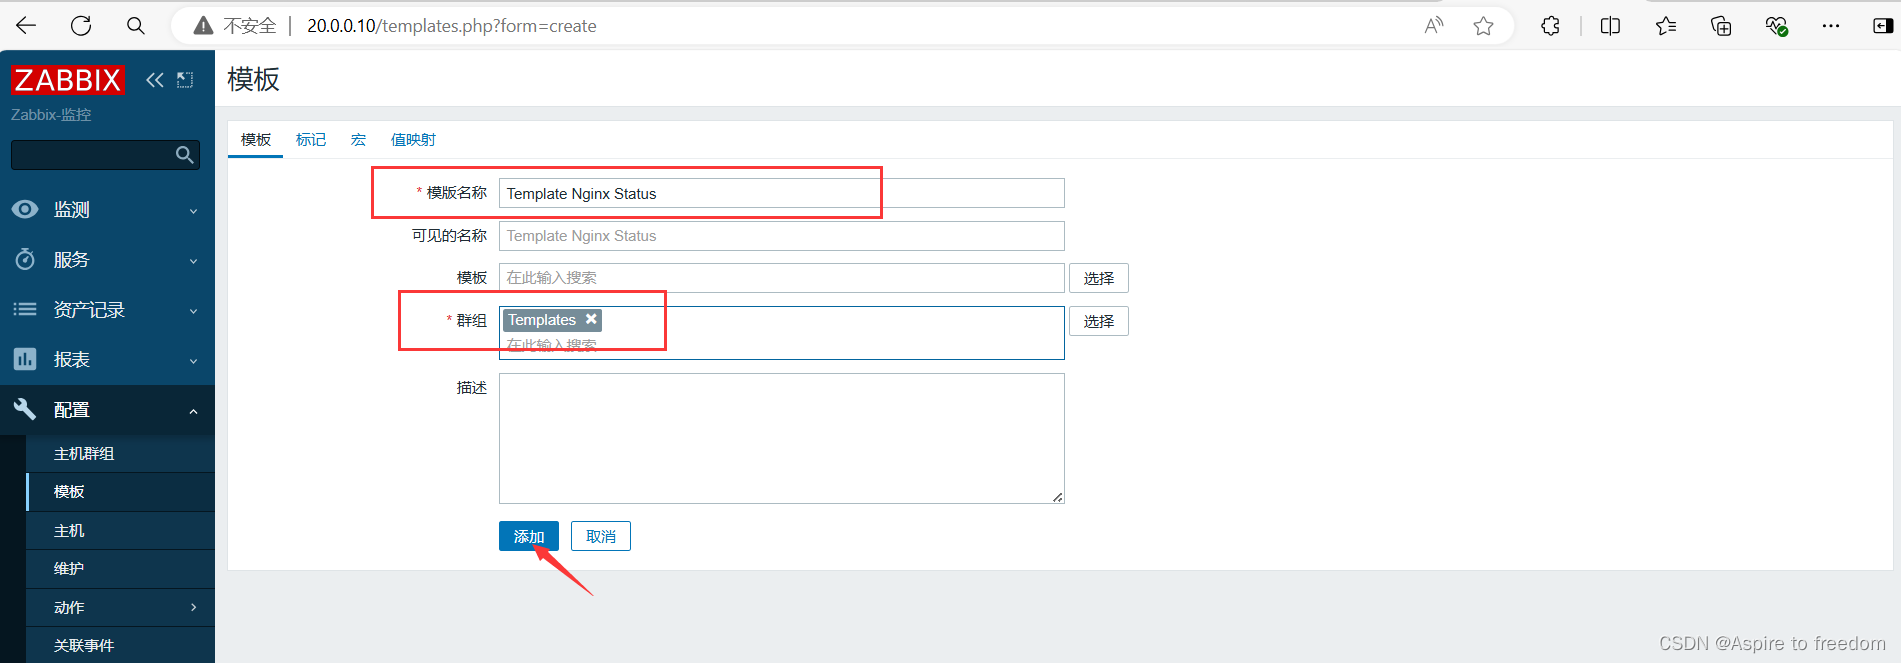
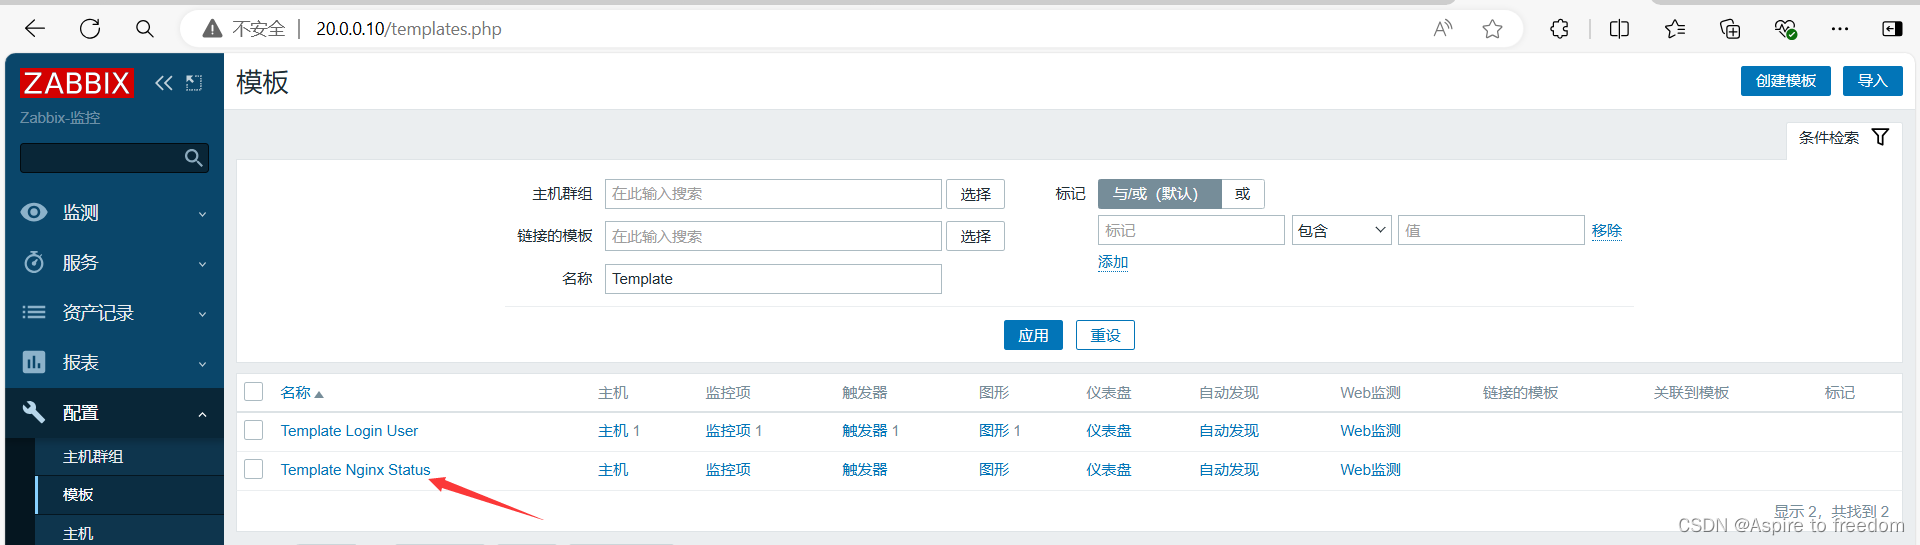
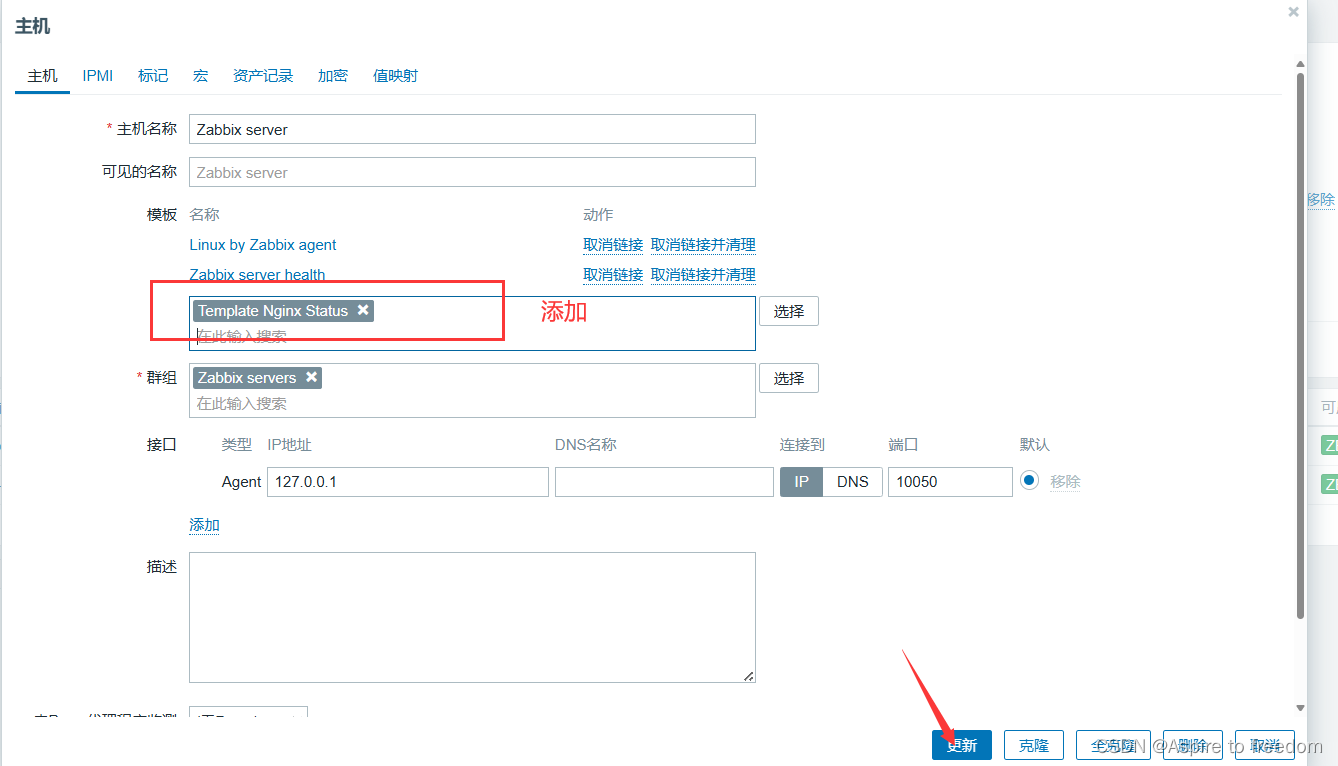
【配置】点击【模板】点击【创建模板】
这个页面:20.0.0.10/index.php
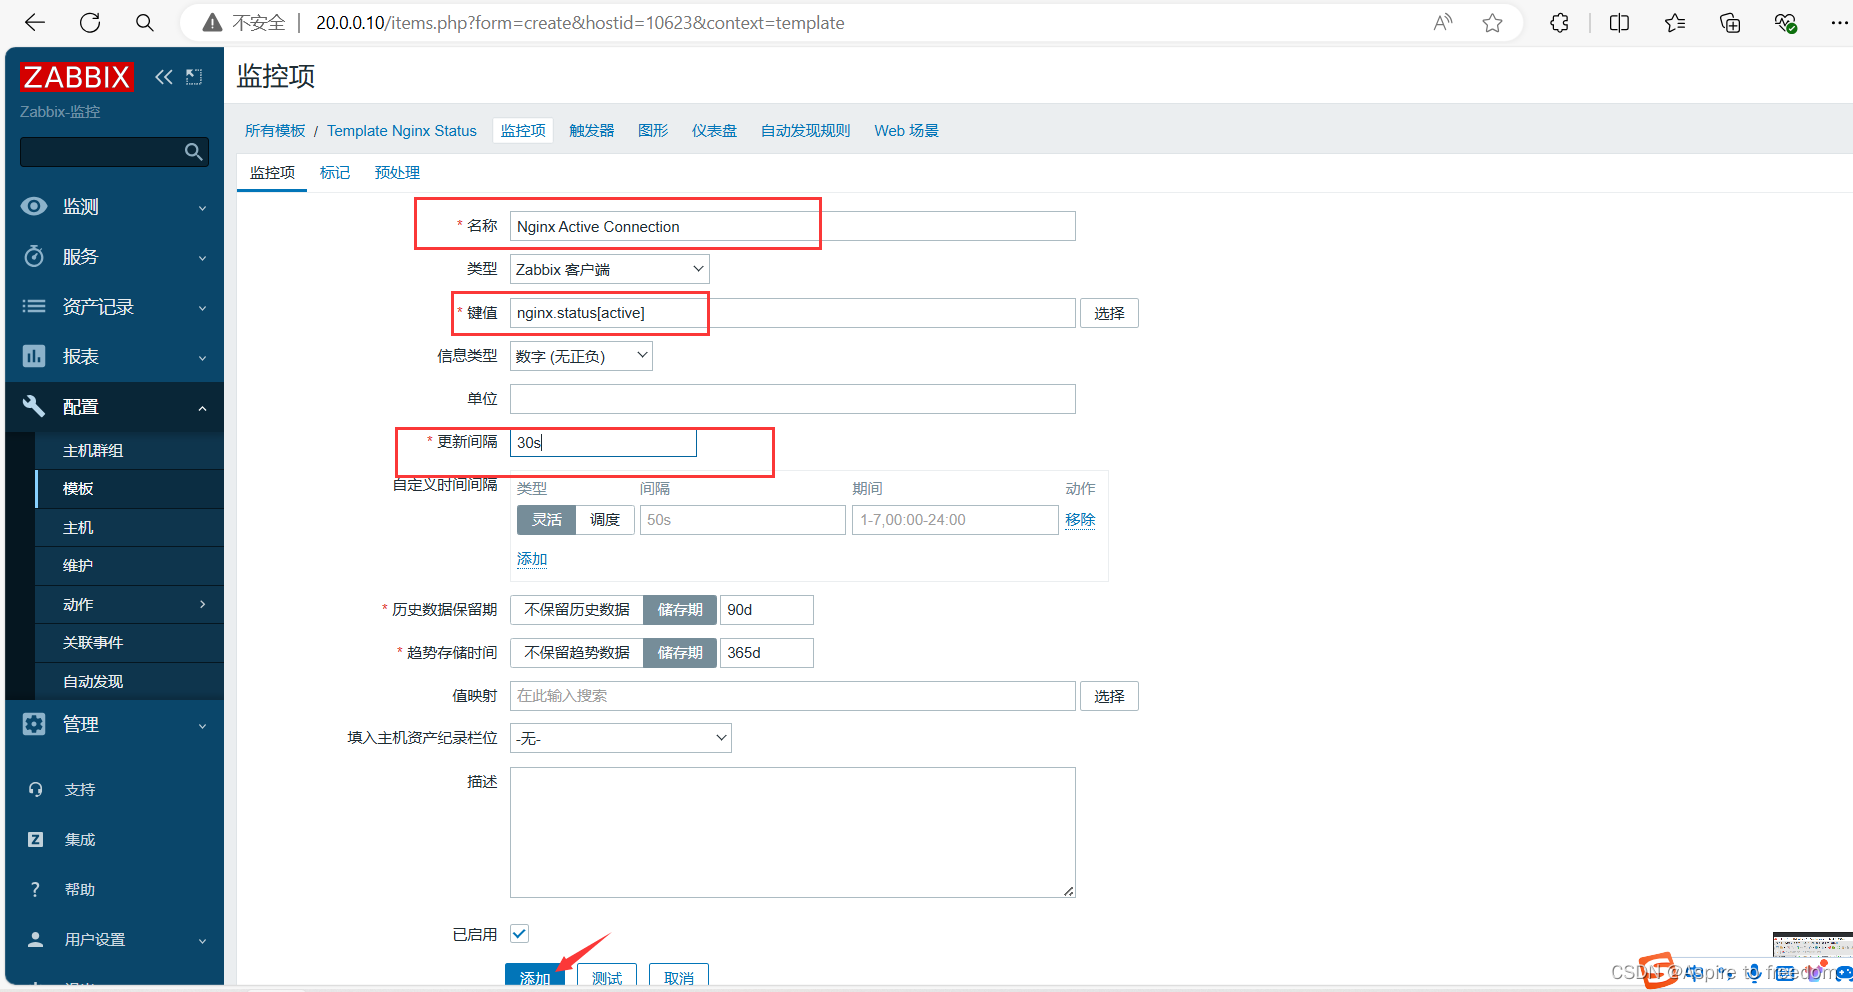
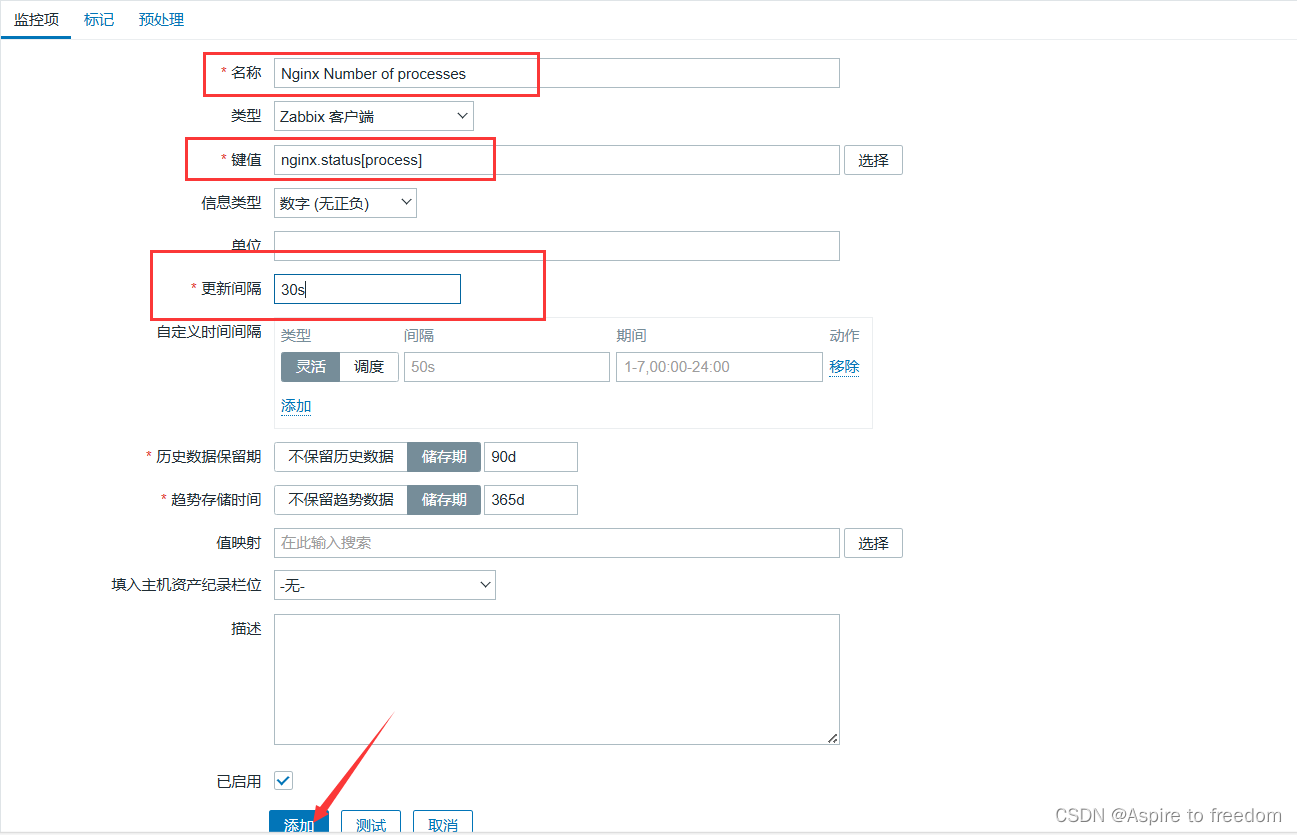
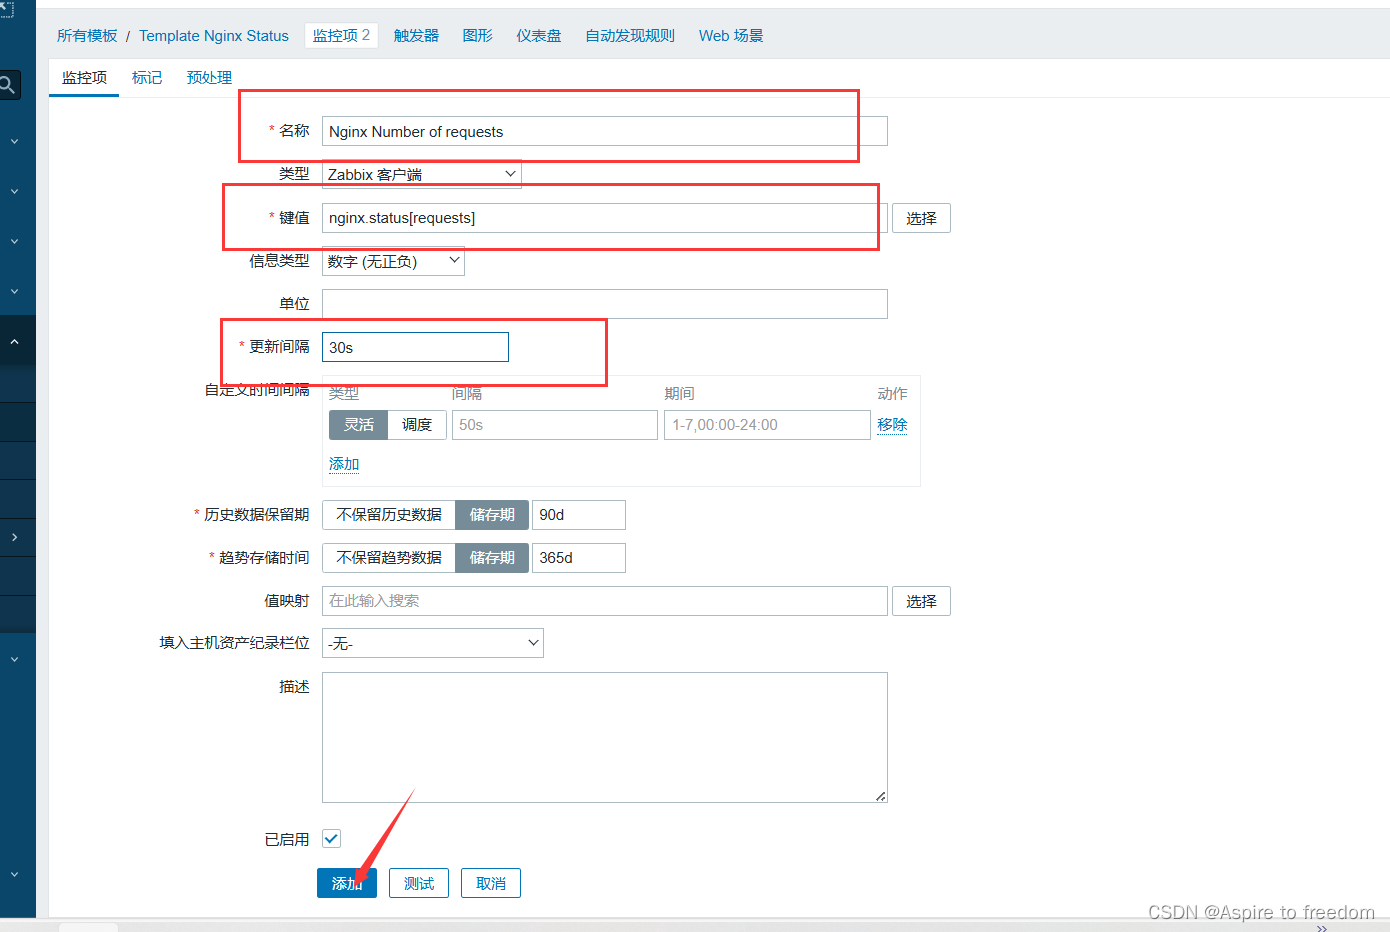
添加三个监控项
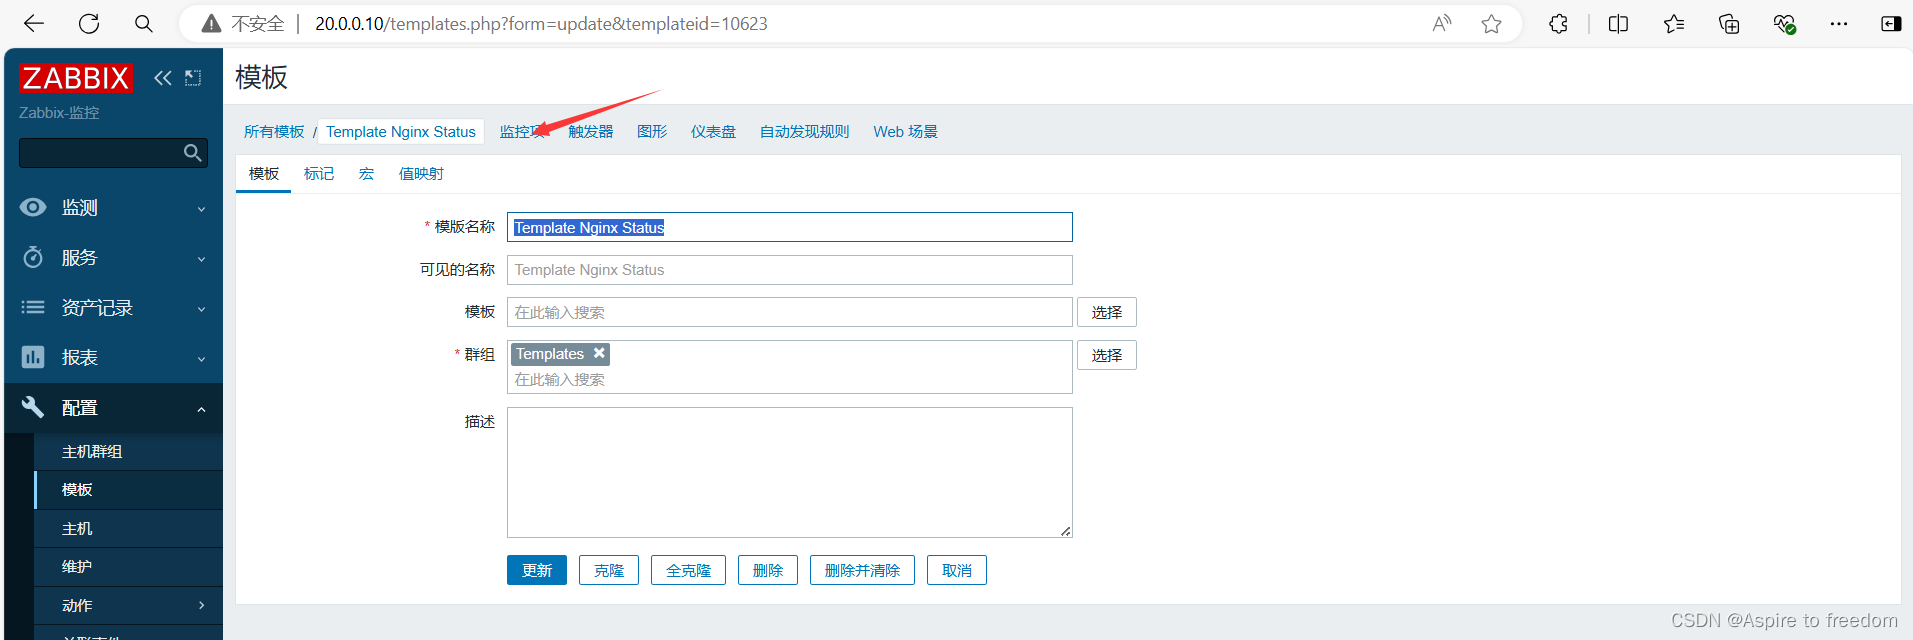
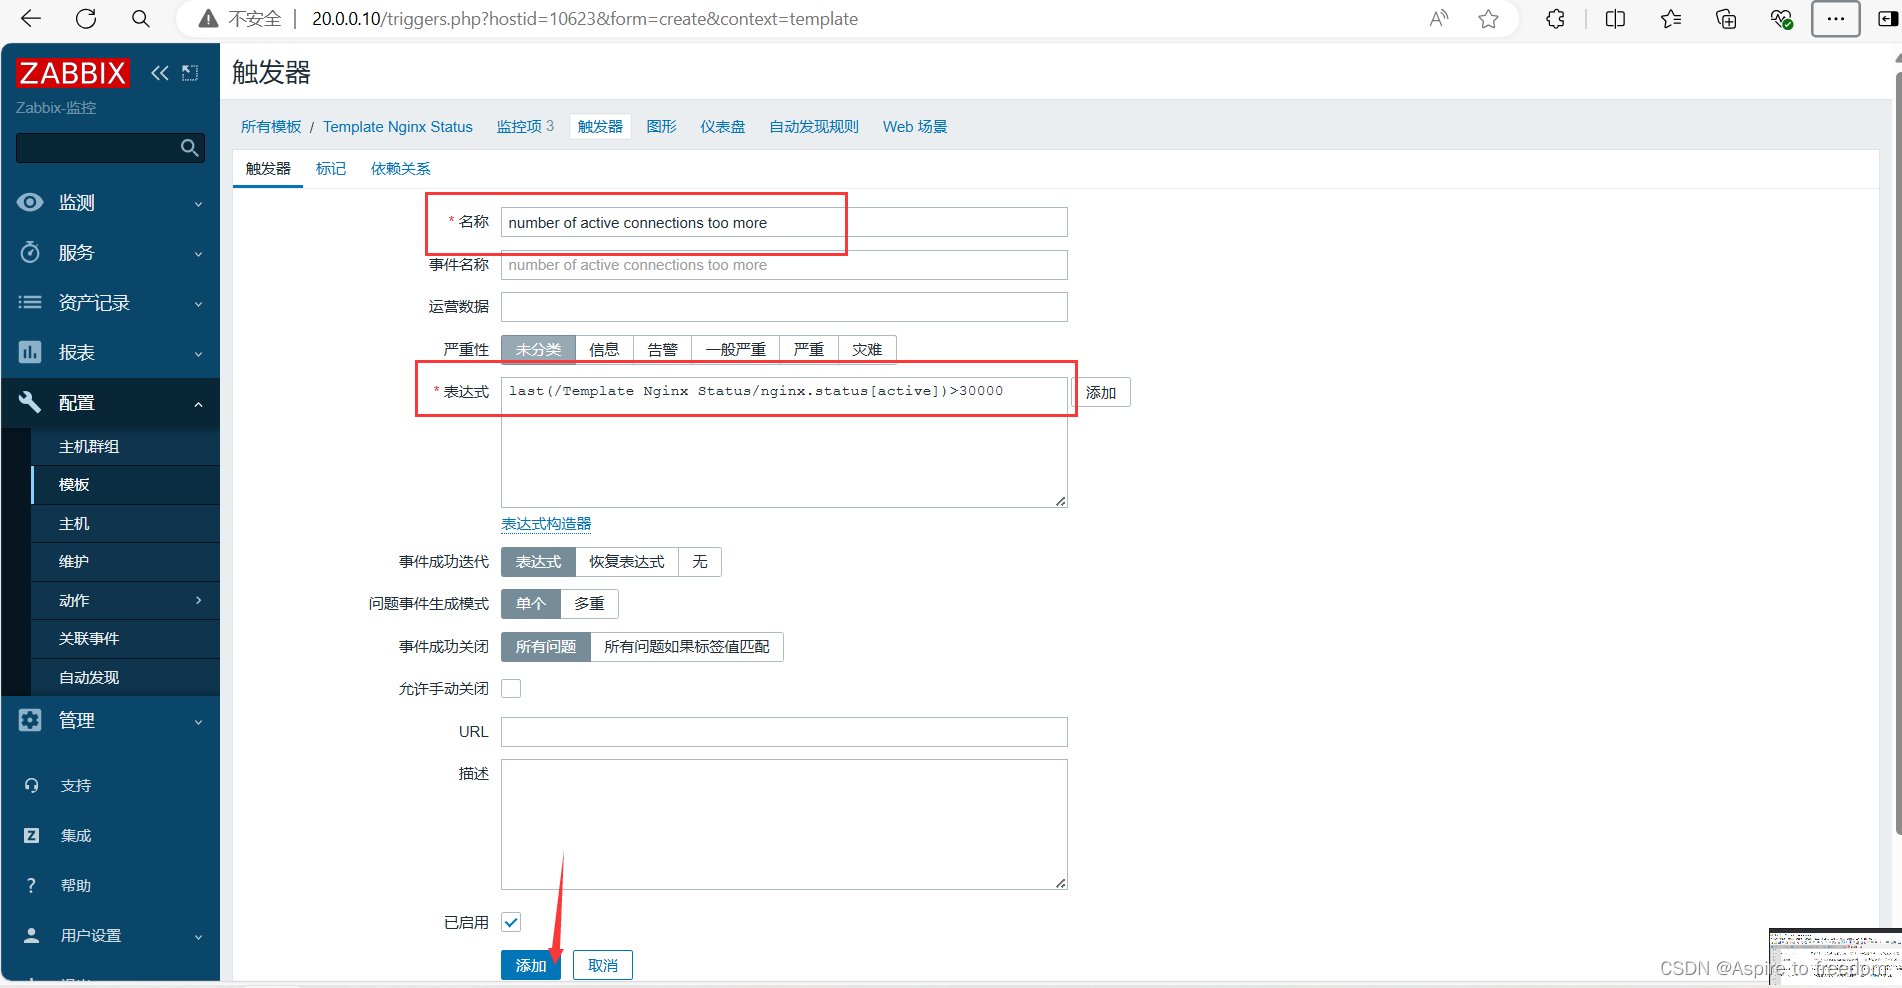
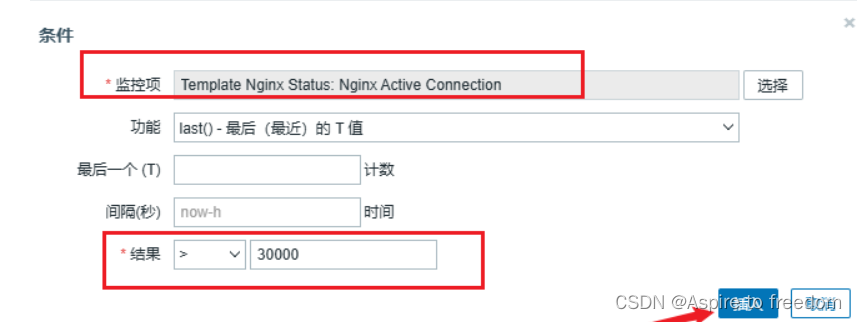
点击上方【触发器】点击【创建触发器】
连接触发器
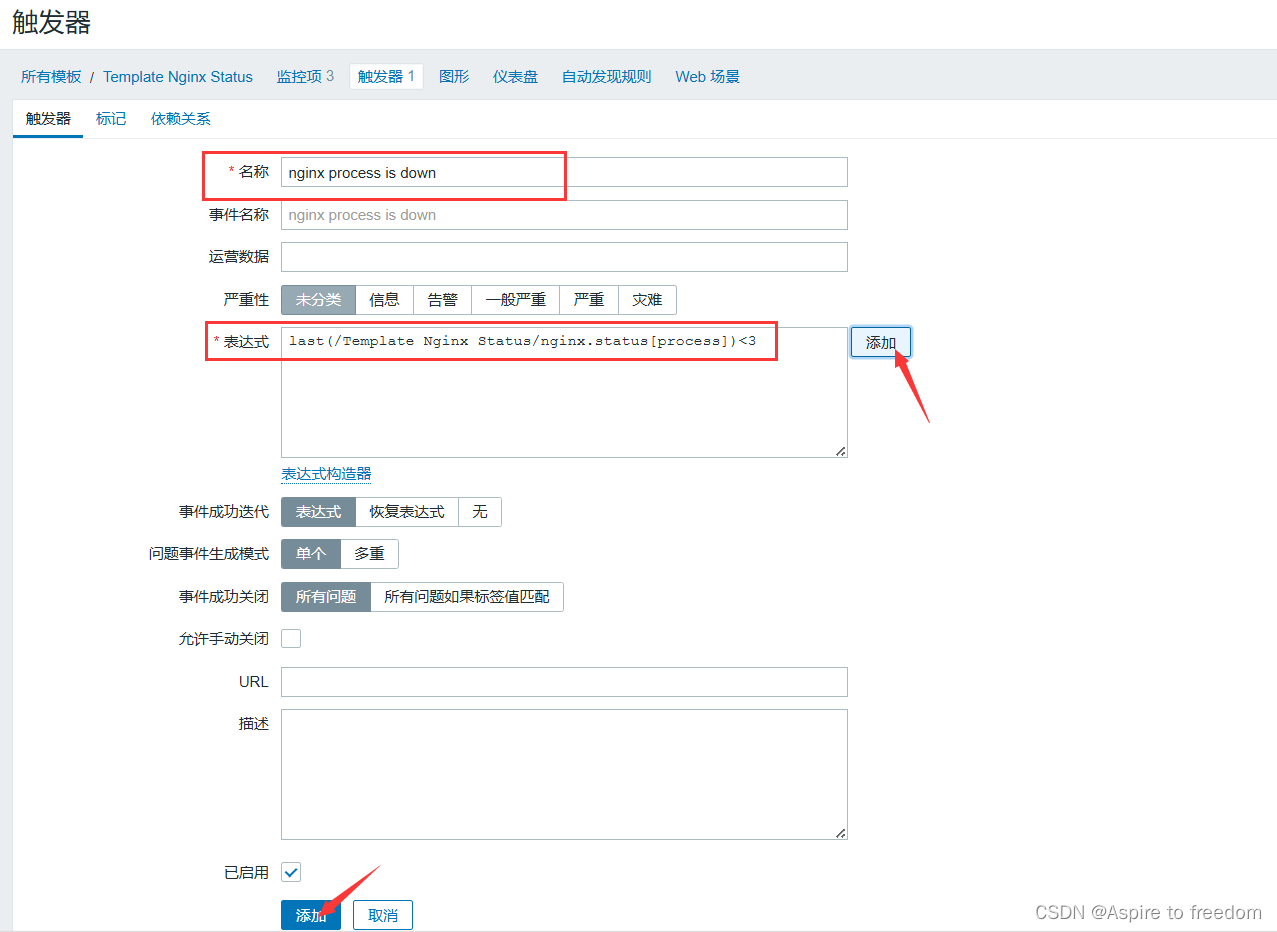
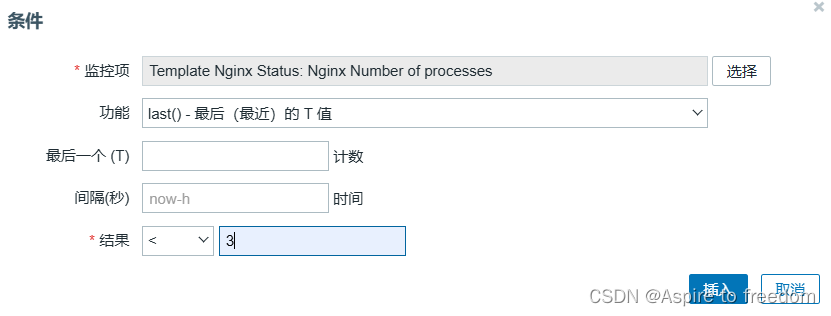
进程触发器
主机关联监控模板:左侧【配置】点击 【主机】点击【Zabbix server】
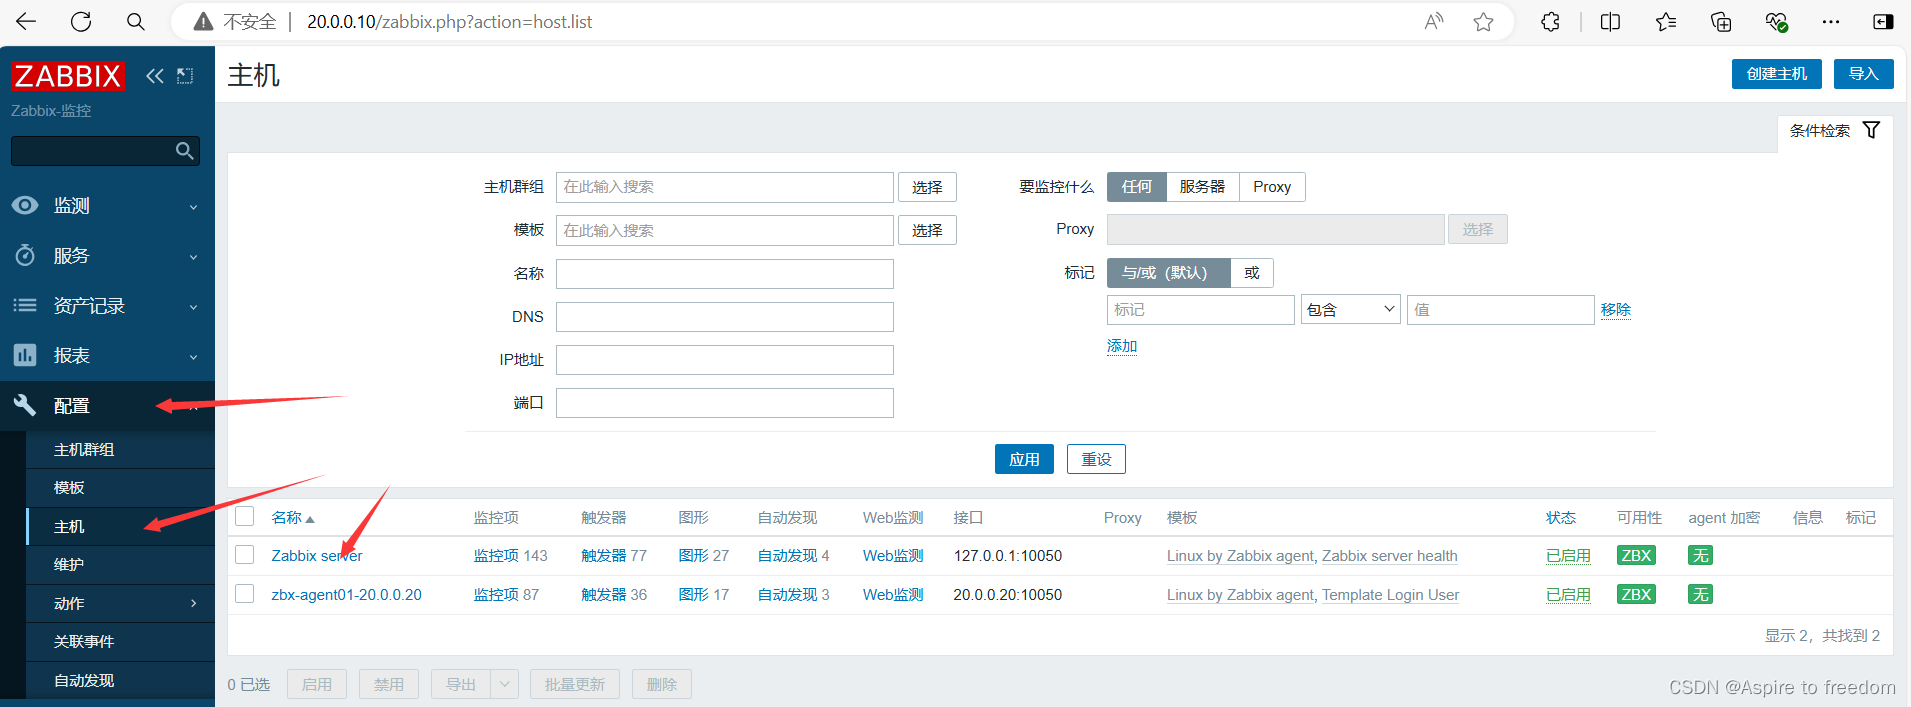
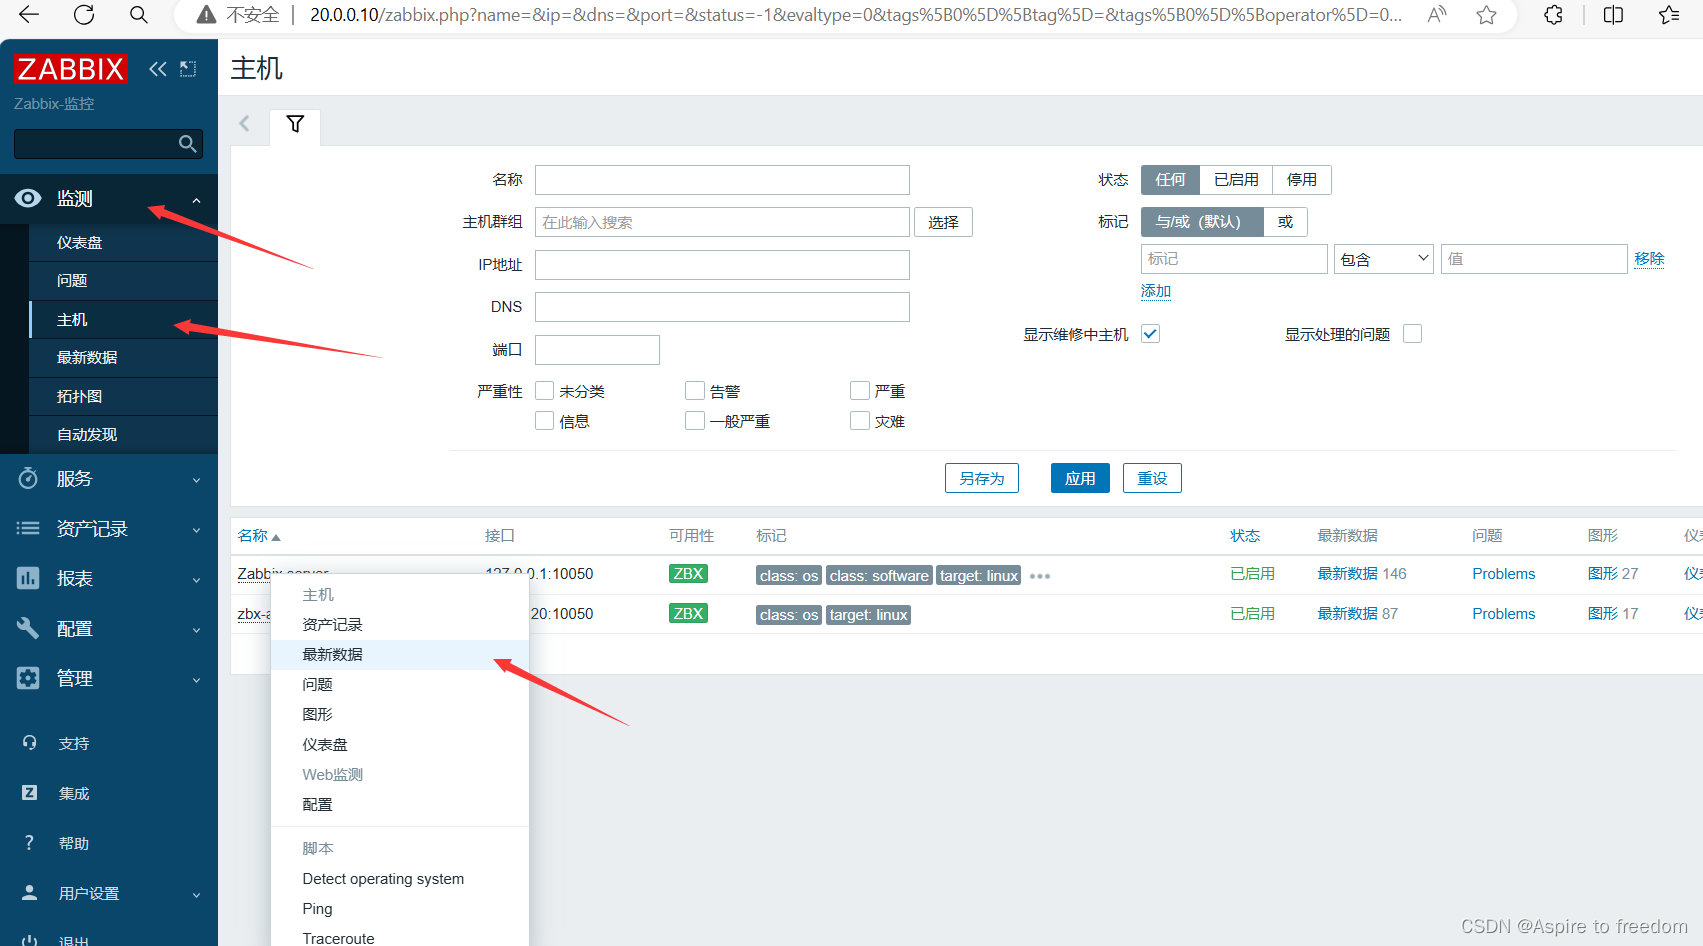
查看:左侧点击【监测】点击【主机】点击【Zabbix server】点击最新数据,找到添加的三个模板

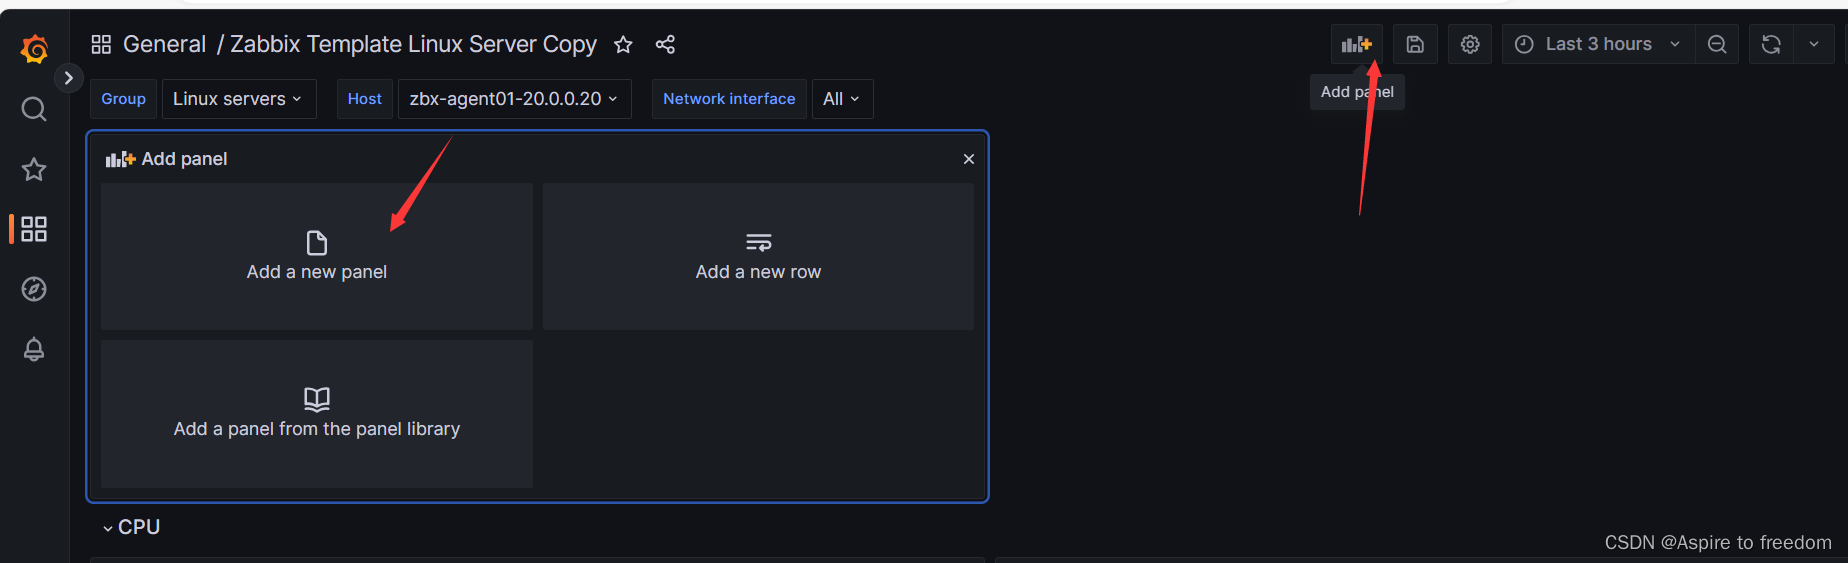
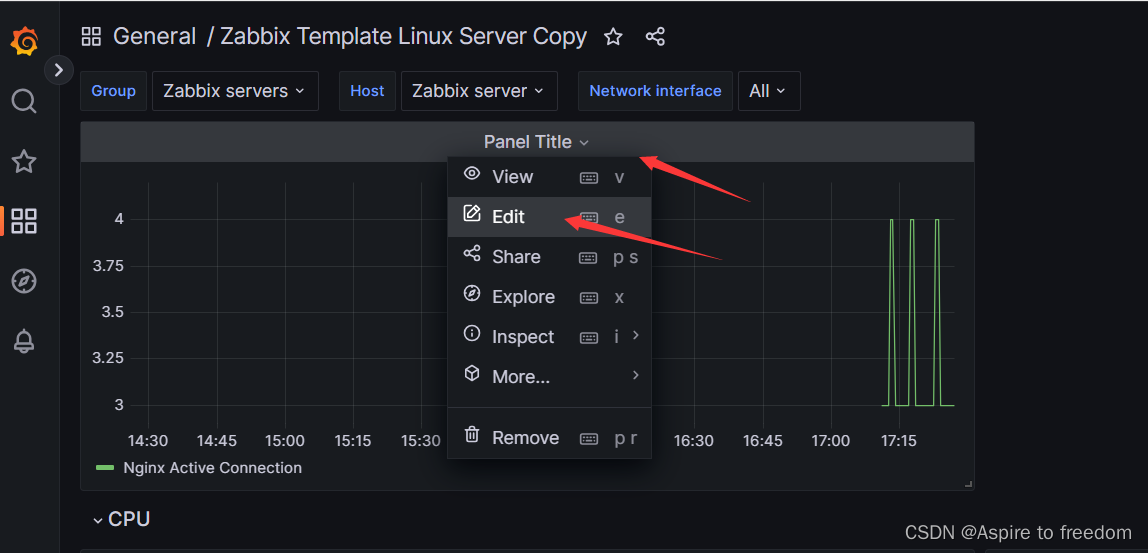
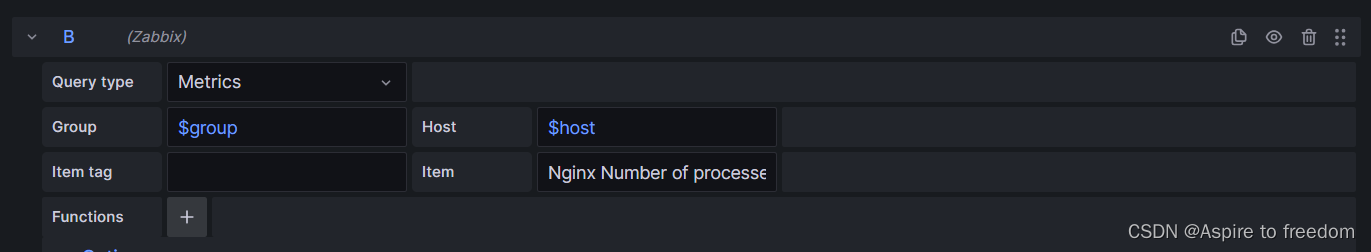
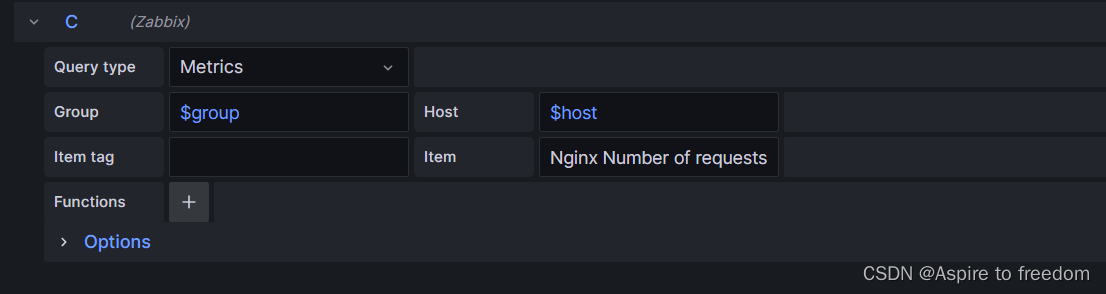
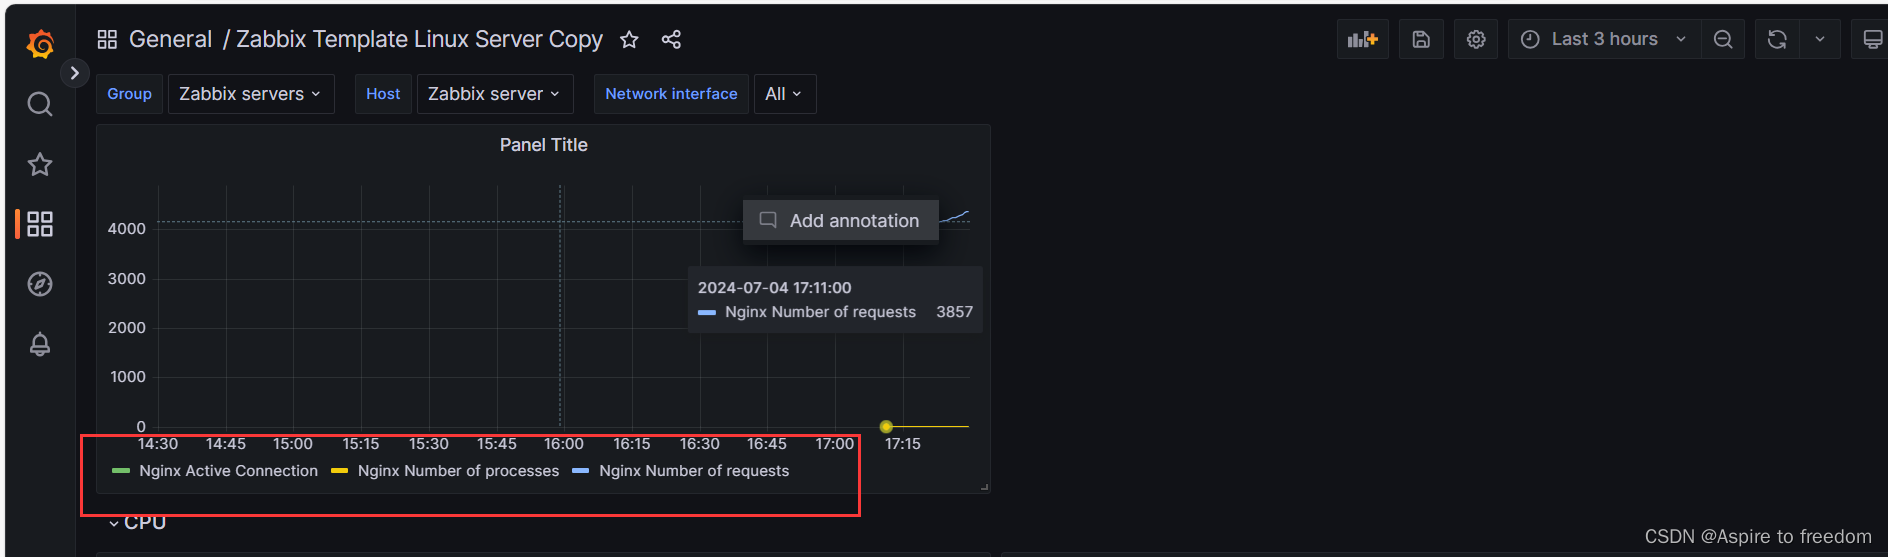
(5)连接到grafana