vue 封装3D柱状图,每个柱子颜色不同,支持渐变

留档,以防忘记

复制代码
<template>
    <div :id="id" class="zhutu3d" :class="barClass" :style="{ height: height }"></div>
</template>
<script>
import * as echarts from 'echarts/lib/echarts';
import 'echarts/lib/chart/bar';
import 'echarts/lib/chart/pictorialBar';
import 'echarts/lib/component/grid';
import 'echarts/lib/component/tooltip';
import 'echarts/lib/component/title';
import 'echarts/lib/component/legend';
export default {
    name: 'JztPrismColourful3D',
    props: {
        styleInit: {},
        datas: {},
        backgroundColor: {
            type: String,
            default: ''
        },
        barClass: {
            type: String,
            default: ''
        },
        height: {
            type: String,
            default: ''
        },
        xLabelRotate: {
            type: Number,
            default: 0
        },
        tooltipUnit: {
            type: String,
            default: '人'
        }
    },
    data: function () {
        return {
            id: 'echart3D' + Math.round(Math.random() * 10000 + 1),
            tdBarChart: null
        };
    },
    mounted() {
        this.tdBarChart = echarts.init(document.getElementById(this.id));
        this.drawBar();
    },
    methods: {
        drawBar() {
            let that = this;
            this.tdBarChart.clear();
            this.tdBarChart.showLoading({
                text: '正在渲染数据',
                maskColor: 'transparent',
                textColor: '#7EBBEA',
                fontSize: 15
            }); //增加提示
            var topArr = []; //顶部棱盖
            var bottomArr = []; //底部棱盖
            var leftArr = []; //左侧柱子
            var rightArr = []; //右侧柱子
            this.datas.series.data.map((el, index) => {
                topArr.push({
                    value: el.value,
                    symbol: 'diamond',
                    symbolOffset: [0, '-50%'],
                    symbolPosition: 'end', //图形边缘与柱子结束的地方内切
                    symbolSize: [this.datas.series.barWidth, this.datas.series.barWidth * 0.4], //根据柱子大小来做调整
                    itemStyle: {
                        normal: {
                            color: {
                                x: 1,
                                y: 0,
                                x2: 0,
                                y2: 0,
                                type: 'linear',
                                global: false,
                                colorStops: [
                                    { offset: 0, color: el.topSymbolColor[0] },
                                    { offset: 1, color: el.topSymbolColor[1] }
                                ]
                            }
                        }
                    }
                });
                bottomArr.push({
                    value: el.value,
                    symbol: 'triangle',
                    symbolOffset: [0, this.datas.series.barWidth * 0.25],
                    symbolSize: [-this.datas.series.barWidth, this.datas.series.barWidth * 0.25],
                    symbolRotate: 180,
                    itemStyle: {
                        color: {
                            x: 0,
                            y: 0,
                            x2: 1,
                            y2: 0,
                            type: 'linear',
                            global: false,
                            colorStops: [
                                { offset: 0, color: el.barColor[0][1] },
                                { offset: 0.5, color: el.barColor[0][1] },
                                { offset: 0.5, color: el.barColor[1][1] },
                                { offset: 1, color: el.barColor[1][1] }
                            ]
                        }
                    }
                });
                leftArr.push({
                    value: el.value,
                    itemStyle: {
                        color: {
                            x: 0,
                            y: 0,
                            x2: 0,
                            y2: 1,
                            type: 'linear',
                            global: false,
                            colorStops: [
                                { offset: 0, color: el.barColor[0][0] },
                                { offset: 1, color: el.barColor[0][1] }
                            ]
                        }
                    }
                });
                rightArr.push({
                    value: el.value,
                    itemStyle: {
                        color: {
                            x: 0,
                            y: 0,
                            x2: 0,
                            y2: 1,
                            type: 'linear',
                            global: false,
                            colorStops: [
                                { offset: 0, color: el.barColor[1][0] },
                                { offset: 1, color: el.barColor[1][1] }
                            ]
                        }
                    }
                });
            });
            this.$nextTick(() => {
                this.tdBarChart.hideLoading();
                this.tdBarChart.setOption({
                    backgroundColor: this.backgroundColor,
                    grid: {
                        left: 15,
                        right: 15,
                        bottom: 0,
                        top: 30,
                        containLabel: true
                    },
                    tooltip: {
                        trigger: 'axis',
                        confine: true,
                        formatter: function (param) {
                            var str = '';
                            param.map((el, index) => {
                                if (el.componentSubType == 'bar') {
                                    str = el.seriesName + '<br>' + el.marker + el.name + ':' + el.data.value + '' + that.tooltipUnit;
                                }
                            });
                            return str;
                        }
                    },
                    xAxis: [
                        {
                            type: 'category',
                            data: this.datas.xAxis,
                            axisTick: {
                                show: false
                            },
                            axisLine: {
                                show: false
                            },
                            splitLine: {
                                show: false
                            },
                            axisLabel: {
                                show: true,
                                color: '#76A5D1',
                                fontSize: 10,
                                fontWeight: 300,
                                rotate: this.xLabelRotate
                            }
                        }
                    ],
                    yAxis: [
                        {
                            type: 'value',
                            axisTick: {
                                show: false
                            },
                            axisLine: {
                                show: false
                            },
                            splitLine: {
                                show: true,
                                lineStyle: {
                                    color: '#082745'
                                }
                            },
                            axisLabel: {
                                show: true,
                                color: '#76A5D1',
                                fontSize: 10,
                                fontWeight: 300
                            }
                        }
                    ],
                    series: [
                        {
                            type: 'pictorialBar',
                            name: '顶部棱盖',
                            z: 10,
                            data: topArr
                        },
                        {
                            type: 'bar',
                            name: this.datas.series.name,
                            barGap: '-50%',
                            // symbol: 'image://' + params.picture, // 图片自己切或者让UI设计切喔
                            symbolOffset: [0, 0],
                            barWidth: this.datas.series.barWidth / 2,
                            z: 2,
                            data: leftArr,
                            label: {
                                show: this.datas.series.labelShow,
                                color: this.datas.series.labelColor,
                                fontSize: this.datas.series.labelFont,
                                position: 'top',
                                offset: [this.datas.series.barWidth / 4, this.datas.series.offsetTop]
                            }
                        },
                        {
                            type: 'bar',
                            name: this.datas.series.name,
                            barGap: '-5%',
                            // symbol: 'image://' + params.picture, // 图片自己切或者让UI设计切喔
                            symbolOffset: [0, 0],
                            barWidth: this.datas.series.barWidth / 2,
                            z: 3,
                            data: rightArr
                        },
                        {
                            type: 'pictorialBar',
                            name: '底部棱盖',
                            barGap: '-100%',
                            z: 6,
                            data: bottomArr
                        }
                    ]
                });
            });
        }
    }
};
</script>

<style lang="scss" scoped>
.zhutu3d {
    margin: 0 auto;
    width: 99%;
    height: 100%;
}
</style>

使用

复制代码
<addechart :datas="prismColourful3DData"></addechart>


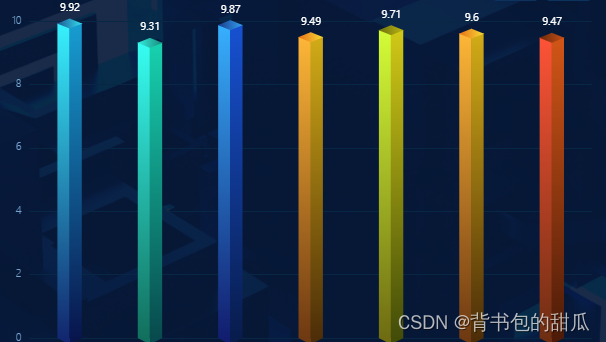
prismColourful3DData:{
                xAxis:['bar1', 'bar2', 'bar3', 'bar4', 'bar5', 'bar6', 'bar7'],
                series:{
                    name:"指数构成-经济",
                    barWidth:25,
                    barMinHeight:5,
                    labelShow:true,  //是否显示label
                    labelColor:'#fff', //label字体颜色
                    labelFont:10,      //label字体大小
                    offsetTop:-5,      //label距顶部高度
                    data:[
                        {value:50,barColor:[["#37F1FD","#12276F"],["#179DD1","#08154D" ]],topSymbolColor:["#34DFF1","#1B5590"]},
                        {value:52,barColor:[["#37FDF2","#126F5D"],["#17D1AF","#084A4D"]],topSymbolColor:["#188978","#34EEE2"]},
                        {value:53,barColor:[["#37AFFD","#121D6F"],["#1751D1","#081C4D"]],topSymbolColor:["#34A1EF","#193A8C"]},
                        {value:56,barColor:[["#FDB637","#6F3912"],["#D1AB17","#4D2E08"]],topSymbolColor:["#F5DB35","#E86F18"]},
                        {value:58,barColor:[["#D4FD37","#6F6C12"],["#D1C817","#434D08"]],topSymbolColor:["#B9B414","#6D710D"]},
                        {value:60,barColor:[["#FDB637","#6F3912"],["#D1AB17","#4D2E08"]],topSymbolColor:["#F5DB35","#E86F18"]},
                        {value:61,barColor:[["#FD5337","#6F2E12"],["#D15517","#4D1B08"]],topSymbolColor:["#C65015","#6B280B"]}
                    ],
                }
            }

效果

相关推荐
紫_龙7 小时前
最新版vue3+TypeScript开发入门到实战教程之重要详解readonly/shallowReadOnly
前端·javascript·typescript
蓝莓味的口香糖9 小时前
【vue】初始化 Vue 项目
前端·javascript·vue.js
aikongmeng9 小时前
【Ai】Claude Code 初始化引导
javascript
光影少年10 小时前
数组去重方法
开发语言·前端·javascript
我命由我1234510 小时前
浏览器的 JS 模块化支持观察记录
开发语言·前端·javascript·css·html·ecmascript·html5
weixin_4434785111 小时前
Flutter第三方常用组件包之路由管理
前端·javascript·flutter
QQ51100828511 小时前
基于区块链的个人医疗咨询挂号信息系统vue
前端·vue.js·区块链
程序员小寒13 小时前
JavaScript设计模式(八):命令模式实现与应用
前端·javascript·设计模式·ecmascript·命令模式
Z_Wonderful15 小时前
在 Next.js 中,使用 [id] 或 public 作为文件夹或文件名是两种完全不同的概念,分别对应 动态路由 和 静态资源托管
javascript·网络·chrome
妖萌妹儿17 小时前
postman怎么做参数化批量测试,测试不同输入组合
开发语言·javascript·postman