📢 大家好,我是 【战神刘玉栋】,有10多年的研发经验,致力于前后端技术栈的知识沉淀和传播。 💗
🌻 近期刚转战 CSDN,会严格把控文章质量,绝不滥竽充数,如需交流,欢迎留言评论。👍
文章目录
写在前面的话
前不久博主整理了 《企业实战分享 · 常用运维中间件》,提到一些常用的中间件,这回介绍一下代码层面的具体整合工作。
此篇博文先介绍一下SpringBoot如何整合Prometheus采集自定义指标,各位大佬可以自行发散。
SpringBoot 整合 Prometheus
背景说明:这里默认已经准备好一个完整的
SpringBoot项目,并且已经整合了Druid,这里以采集Druid指标为例介绍整合流程。
Step1、添加 Pom 依赖
xml
<dependency>
    <groupId>io.micrometer</groupId>
    <artifactId>micrometer-registry-prometheus</artifactId>
</dependency>
Step2、在 application.yml 中配置 Actuator 和 Prometheus
yaml
management:
  endpoints:
    web:
      exposure:
        # 仅暴露 prometheus、health 和 info 端点。
        include: prometheus, health, info
  metrics:
    export:
      prometheus:
        # 启用 Prometheus 指标导出。
        enabled: true
  endpoint:
    prometheus:
      # 启用 /prometheus 端点。
      enabled: true
Step3、注册 Druid 数据源的指标到 Micrometer
java
@Configuration(proxyBeanMethods = false)
@ConditionalOnClass(DruidDataSource.class)
static class DruidDataSourcePoolMetadataProviderConfiguration implements SmartInitializingSingleton {
    private DruidDataSource wrappedDataSource;

    @Bean
    public DataSourcePoolMetadataProvider druidPoolDataSourceMetadataProvider() {
        return (dataSource) -> {
            DruidDataSource ds = DataSourceUnwrapper.unwrap(dataSource, DruidDataSource.class);
            if (ds != null) {
                this.wrappedDataSource = ds;
                return new DruidDataSourcePoolMetadata(ds);
            }
            return null;
        };
    }

    @Override
    public void afterSingletonsInstantiated() {
        if (this.wrappedDataSource == null) {
            return;
        }
        Metrics.gauge(MetricsConstant.DataSource.POOLING_COUNT, this.wrappedDataSource, DruidDataSource::getPoolingCount);
        Metrics.gauge(MetricsConstant.DataSource.CONNECT_OPEN_COUNT, this.wrappedDataSource, DruidDataSource::getConnectCount);
        Metrics.gauge(MetricsConstant.DataSource.CONNECT_CLOSE_COUNT, this.wrappedDataSource, DruidDataSource::getCloseCount);
        Metrics.gauge(MetricsConstant.DataSource.CONNECT_ERROR_COUNT, this.wrappedDataSource, DruidDataSource::getConnectErrorCount);
        Metrics.gauge(MetricsConstant.DataSource.EXECUTE_COUNT, this.wrappedDataSource, DruidDataSource::getExecuteCount);
        Metrics.gauge(MetricsConstant.DataSource.ROLLBACK_COUNT, this.wrappedDataSource, DruidDataSource::getRollbackCount);
        Metrics.gauge(MetricsConstant.DataSource.PHYSICAL_CONNECT_COUNT, this.wrappedDataSource, DruidDataSource::getCreateCount);
        Metrics.gauge(MetricsConstant.DataSource.PHYSICAL_CLOSE_COUNT, this.wrappedDataSource, DruidDataSource::getDestroyCount);
        Metrics.gauge(MetricsConstant.DataSource.PHYSICAL_CONNECT_ERROR_COUNT, this.wrappedDataSource, DruidDataSource::getCreateErrorCount);
        Metrics.gauge(MetricsConstant.DataSource.NOT_EMPTY_WAIT_COUNT, this.wrappedDataSource, DruidDataSource::getNotEmptyWaitCount);
        Metrics.gauge(MetricsConstant.DataSource.NOT_EMPTY_WAIT_MILLIS, this.wrappedDataSource, DruidDataSource::getNotEmptyWaitMillis);
    }
}
Step4、配置 Prometheus 抓取 Spring Boot 应用的指标
进入Prometheus所在服务器,修改配置文件prometheus.yml
如下所示,是配置具体某个服务,如果是SpringCloud,有接入网关,也可以通过网关配置。
yaml
scrape_configs:
  - job_name: 'spring-boot-app'
    static_configs:
      - targets: ['localhost:8080']
Step5、启动 Spring Boot 应用并检查指标
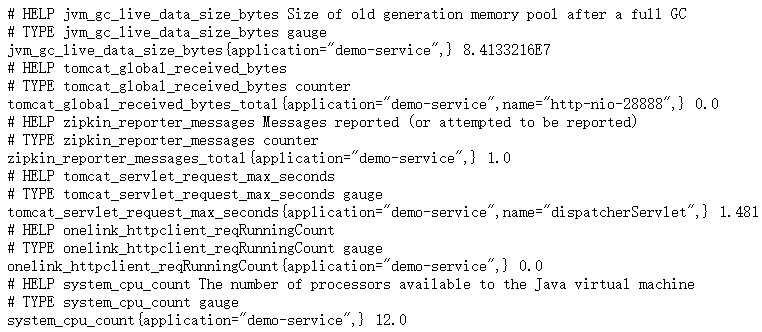
访问地址:http://127.0.0.1:28888//actuator/prometheus
应该可以看到如下图所示的相关指标信息,包括 Druid 数据源的指标。
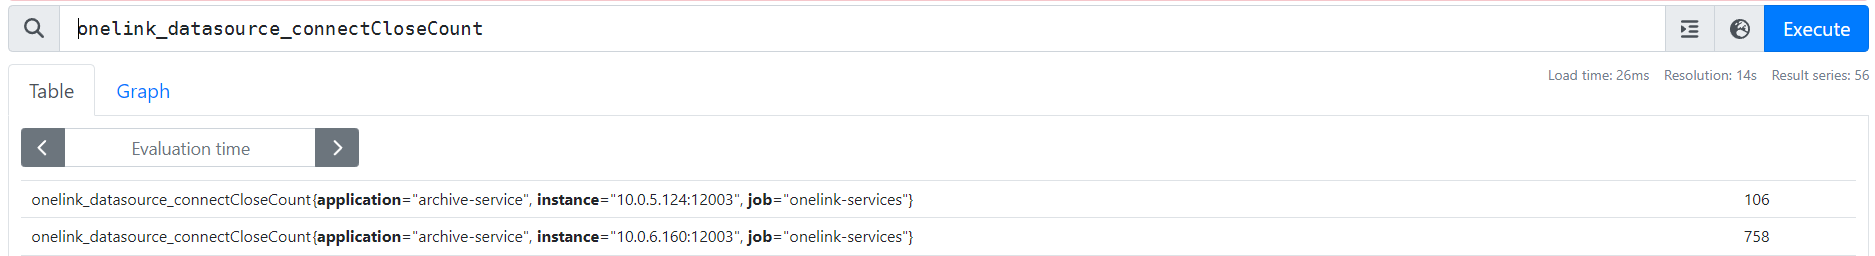
Step6、打开 Prometheus 界面验证
启动 Prometheus,访问地址:http://localhost:9090
在 Prometheus 的界面中可以看到从 Spring Boot 应用中抓取到的指标数据,操作效果如下图:
继续采集 OkHttp3 指标
需求背景
框架采用OkHttp3作为远程调用工具,现在也需要采集相关指标到Prometheus。
这里基本实现思路,类似前面的Druid整合方案。
1、瞬时类型的指标,可以在初始化的时候利用Metrics.gauge注册;
2、请求耗时这样的指标,可以借助 OkHttp3 的拦截器,计算耗时,再利用Metrics.timer注册;
Metrics.gauge 和 Metrics.timer 区别
Metrics.gauge 收集的是瞬时数据(instantaneous data),也就是某一时刻的数值。这些数据通常反映了当前状态或当前值,例如内存使用量、线程数、队列长度等。
Metrics.timer 收集的是区间数据(interval data),也就是一段时间内的多个数据点。这些数据点可以用于计算统计信息,比如平均值、最小值、最大值等。
通过这两种不同的度量方式,可以全面地监控和分析应用程序的性能和状态。
具体代码案例
java
public class HttpClientMetricsInterceptor implements Interceptor {
public HttpClientMetricsInterceptor(Dispatcher dispatcher) {
Assert.notNull(dispatcher, "OkHttp dispatcher could not be null");
Metrics.gauge(HttpClient.MAX_REQ_PER_HOST_SIZE, dispatcher.getMaxRequestsPerHost());
Metrics.gauge(HttpClient.MAX_REQ_SIZE, dispatcher.getMaxRequests());
Metrics.gauge(HttpClient.REQ_RUNNING_COUNT, dispatcher, Dispatcher::runningCallsCount);
Metrics.gauge(HttpClient.REQ_QUEUE_TASK_COUNT, dispatcher, Dispatcher::queuedCallsCount);
ExecutorService executorService = dispatcher.executorService();
if (executorService instanceof ThreadPoolExecutor) {
ThreadPoolExecutor executor = (ThreadPoolExecutor) executorService;
Metrics.gauge(HttpClient.MAX_POOL_SIZE, executor, ThreadPoolExecutor::getMaximumPoolSize);
Metrics.gauge(HttpClient.CORE_POOL_SIZE, executor, ThreadPoolExecutor::getCorePoolSize);
Metrics.gauge(HttpClient.ACTIVE_POOL_COUNT, executor, ThreadPoolExecutor::getActiveCount);
Metrics.gauge(HttpClient.LARGEST_POOL_SIZE, executor, ThreadPoolExecutor::getLargestPoolSize);
}
}
@Override
public Response intercept(Chain chain) throws IOException {
Timer.Sample sample = Timer.start(Metrics.globalRegistry);
Request request = chain.request();
Response response = null;
try {
response = chain.proceed(request);
} finally {
String threadName = Thread.currentThread().getName();
boolean async = StrUtil.startWith(threadName, "okhttp", true);
Timer timer = Metrics.timer(HttpClient.RESP_TIME,
"method", request.method(),
"status", String.valueOf(response == null ? "-1" : response.code()),
"uri", URLUtil.getPath(request.url().toString()),
"async", async + ""
);
sample.stop(timer);
}
return response;
}
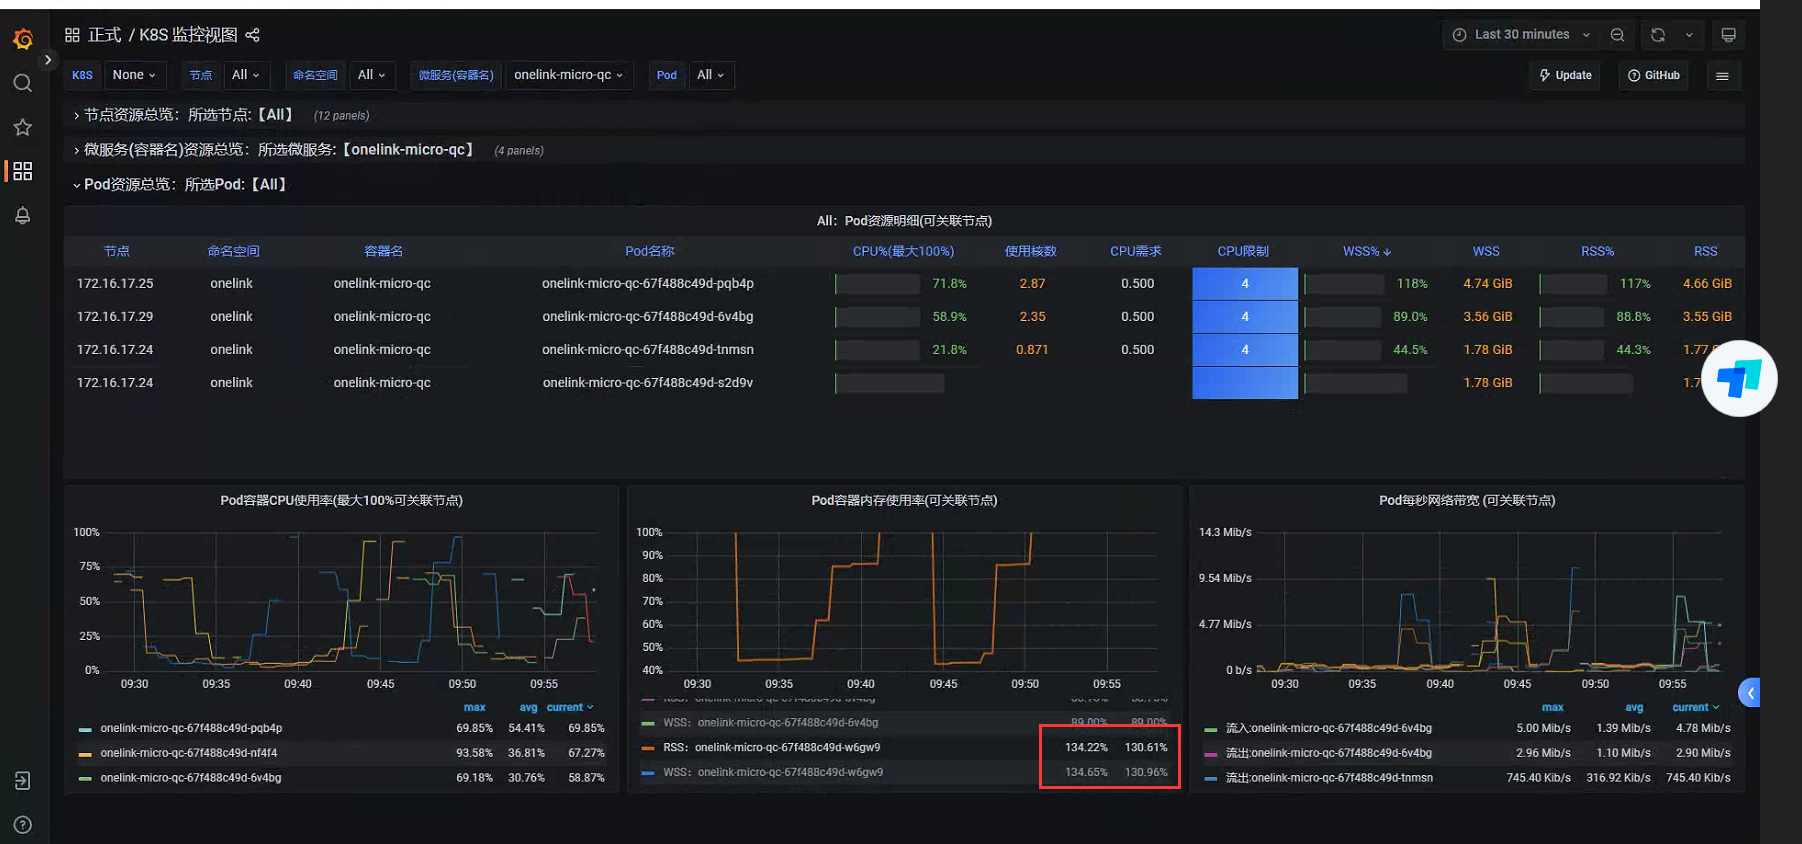
}整合 Grafana
采集到Prometheus的数据,可以通过界面操作,但如果想以仪表盘的直观形式展示更多指标信息,可以考虑整合Grafana,整合工作很简单,代码不需要任何改动。
只需要按如下步骤:
- 安装并启动 Grafana。
- 配置 Prometheus 数据源。
- 创建或导入 Dashboard。
- 使用 Prometheus 查询语法可视化指标。
- 根据需要配置告警和通知。
相关博文:《企业实战分享 · 常用运维中间件》
关于 PromQL 语法
使用Prometheus界面查询的时候,需要借助PromQL语法,一般使用Prometheus查询自定义指标。
通过指标建议通过Grafana面板查询更直观。
下方是一些查询示例:
latex
语法:<metric name>{<label name>=<label value>, ...}
示例一:onelink_datasource_poolingCount{application="archive-service"}[20s] offset 1m
示例分析:
1、onelink_datasource_poolingCount是指标名称,是自定义指标,代表"当前连接池中的连接数";
2、{application="archive-service"}大括号代表过滤,很好理解;
3、[20s]中括号代表时间范围,没添加时间的代表瞬时向量查询,添加了时间的代表区间向量查询,右侧Value会出现多个值,值的个数等于指定时间/拉取频率,例如开发库指定10秒拉取,则出现2个值。
4、offset代表时间位移,不添加代表以当前系统时间为基准进行查询;

示例二:
count(onelink_datasource_poolingCount{application="archive-service"} > 1)
rate(onelink_datasource_poolingCount{application="archive-service"}[1m]) --1分钟增长
topk(6, onelink_datasource_poolingCount > 3) -- 查看前6的指标
示例分析:
1、通过布尔运算对时间序列进行过滤,其实就是上面示例二的大于号,将value进行比对;
2、可以使用一些函数,具体看示例;

过滤符号补充:
label=value 完全匹配
label!=value 完全不陪陪
label=~regx 正则匹配
label=!~regx 正则不匹配
onelink_datasource_poolingCount{application=~"archive-service|dc-.*"}

时间单位补充:
s - 秒
m - 分钟
h - 小时
d - 天
w - 周
y - 年

布尔运算补充:
== (相等)
!= (不相等)
> (大于)
< (小于)
>= (大于等于)
<= (小于
总结陈词
上文分享若干企业实际开发中日常使用场景及应对方案,希望对大家有帮助。
💗 后续会逐步分享企业实际开发中的实战经验,有需要交流的可以联系博主。