本文为博主原创,转载请注明出处:
Telegraf 是一个灵活的服务器代理,用于收集和报告指标。它支持插件驱动,这意味着你可以根据需要添加或修改功能。
1.使用telegraf --help 查看telegraf提供的相关命令和参数
使用telegraf --help 可以查看telegraf提供的相关命令和参数,具体如下:
telegraf --help
Telegraf, The plugin-driven server agent for collecting and reporting metrics.

Usage:

  telegraf [commands|flags]

The commands & flags are:

  config              print out full sample configuration to stdout
  version             print the version to stdout

  --aggregator-filter <filter>   filter the aggregators to enable, separator is :
  --config <file>                configuration file to load
  --config-directory <directory> directory containing additional *.conf files
  --plugin-directory             directory containing *.so files, this directory will be
                                 searched recursively. Any Plugin found will be loaded
                                 and namespaced.
  --debug                        turn on debug logging
  --input-filter <filter>        filter the inputs to enable, separator is :
  --input-list                   print available input plugins.
  --output-filter <filter>       filter the outputs to enable, separator is :
  --output-list                  print available output plugins.
  --pidfile <file>               file to write our pid to
  --pprof-addr <address>         pprof address to listen on, don't activate pprof if empty
  --processor-filter <filter>    filter the processors to enable, separator is :
  --quiet                        run in quiet mode
  --section-filter               filter config sections to output, separator is :
                                 Valid values are 'agent', 'global_tags', 'outputs',
                                 'processors', 'aggregators' and 'inputs'
  --sample-config                print out full sample configuration
  --test                         gather metrics, print them out, and exit;
                                 processors, aggregators, and outputs are not run
  --test-wait                    wait up to this many seconds for service
                                 inputs to complete in test mode
  --usage <plugin>               print usage for a plugin, ie, 'telegraf --usage mysql'
  --version                      display the version and exit

Examples:

  # generate a telegraf config file:
  telegraf config > telegraf.conf

  # generate config with only cpu input & influxdb output plugins defined
  telegraf --input-filter cpu --output-filter influxdb config

  # run a single telegraf collection, outputing metrics to stdout
  telegraf --config telegraf.conf --test

  # run telegraf with all plugins defined in config file
  telegraf --config telegraf.conf

  # run telegraf, enabling the cpu & memory input, and influxdb output plugins
  telegraf --config telegraf.conf --input-filter cpu:mem --output-filter influxdb

  # run telegraf with pprof
  telegraf --config telegraf.conf --pprof-addr localhost:6060
基本命令
-
telegraf config: 打印完整的样本配置到标准输出。 -
telegraf version: 打印版本信息。
配置相关
-
--config <file>: 指定要加载的配置文件。 -
--config-directory <directory>: 指定包含额外 *.conf 文件的目录。 -
--plugin-directory: 指定包含 *.so 文件的目录,Telegraf 将递归搜索此目录并加载任何找到的插件。 -
--debug: 启用调试日志。 -
--input-filter <filter>: 过滤要启用的输入插件,分隔符为冒号。 -
--output-filter <filter>: 过滤要启用的输出插件,分隔符为冒号。 -
--pidfile <file>: 指定写入进程ID的文件。 -
--pprof-addr <address>: 指定监听 pprof 的地址。如果为空,则不激活 pprof。 -
--processor-filter <filter>: 过滤要启用的处理器,分隔符为冒号。 -
--quiet: 以静默模式运行。 -
--section-filter: 过滤要输出的配置部分,有效值包括 'agent', 'global_tags', 'outputs', 'processors', 'aggregators' 和 'inputs'。 -
--sample-config: 打印完整的样本配置。 -
--test: 收集指标、打印它们并退出;在测试模式下,不会运行处理器、聚合器和输出。 -
--test-wait: 在测试模式下等待多长时间以完成服务输入。 -
--usage <plugin>: 打印特定插件的使用信息,例如 'telegraf --usage mysql'。
示例
-
生成 Telegraf 配置文件 :
telegraf config > telegraf.conf -
仅定义 CPU 输入和 InfluxDB 输出插件的配置 :
telegraf --input-filter cpu --output-filter influxdb config -
单次 Telegraf 收集,输出指标到 stdout :
telegraf --config telegraf.conf --test -
按配置文件中定义的所有插件运行 Telegraf :
telegraf --config telegraf.conf -
启用 CPU 和内存输入,以及 InfluxDB 输出插件的 Telegraf :
telegraf --config telegraf.conf --input-filter cpu:mem --output-filter influxdb -
带有 pprof 的 Telegraf 运行 :
telegraf --config telegraf.conf --pprof-addr localhost:6060
2.telegraf --debug 调试运行
运行实例如下:
root@533b2a4c7c7d:/# telegraf --debug
2024-07-26T08:29:49Z I! Starting Telegraf 1.14.3
2024-07-26T08:29:49Z I! Using config file: /etc/telegraf/telegraf.conf
2024-07-26T08:29:49Z I! Loaded inputs: procstat procstat procstat procstat procstat procstat procstat procstat procstat procstat procstat procstat procstat procstat procstat procstat procstat procstat procstat procstat procstat procstat procstat ping disk kernel mem system net cpu processes swap
2024-07-26T08:29:49Z I! Loaded aggregators:
2024-07-26T08:29:49Z I! Loaded processors:
2024-07-26T08:29:49Z I! Loaded outputs: influxdb
2024-07-26T08:29:49Z I! Tags enabled: host=controller1 nodetype=controller
2024-07-26T08:29:49Z I! [agent] Config: Interval:30s, Quiet:false, Hostname:"controller1", Flush Interval:10s
2024-07-26T08:29:49Z D! [agent] Initializing plugins
2024-07-26T08:29:49Z D! [agent] Connecting outputs
2024-07-26T08:29:49Z D! [agent] Attempting connection to [outputs.influxdb]
2024-07-26T08:29:49Z W! [outputs.influxdb] When writing to [http://192.168.118.142:8097]: database "monitor" creation failed: 404 Not Found
2024-07-26T08:29:49Z D! [agent] Successfully connected to outputs.influxdb
2024-07-26T08:29:49Z D! [agent] Starting service inputs
2024-07-26T08:30:00Z D! [outputs.influxdb] Buffer fullness: 0 / 10000 metrics
2024-07-26T08:30:10Z D! [outputs.influxdb] Wrote batch of 81 metrics in 8.753274ms
2024-07-26T08:30:10Z D! [outputs.influxdb] Buffer fullness: 0 / 10000 metrics
2024-07-26T08:30:20Z D! [outputs.influxdb] Wrote batch of 4 metrics in 1.620578ms
2024-07-26T08:30:20Z D! [outputs.influxdb] Buffer fullness: 0 / 10000 metrics
2024-07-26T08:30:30Z D! [outputs.influxdb] Buffer fullness: 0 / 10000 metrics
2024-07-26T08:30:40Z D! [outputs.influxdb] Wrote batch of 83 metrics in 11.697527ms
2024-07-26T08:30:40Z D! [outputs.influxdb] Buffer fullness: 0 / 10000 metrics
2024-07-26T08:30:50Z D! [outputs.influxdb] Wrote batch of 4 metrics in 1.38142ms
关注后面几行日志:
- Buffer fullness : 这些消息显示了Telegraf内部缓冲区的状态,即在任何给定时间点,等待被发送到InfluxDB的指标数量。例如,"Buffer fullness: 0 / 10000 metrics"意味着当前没有指标在缓冲区中等待发送,而"Buffer fullness: 3 / 10000 metrics"表示有3个指标在缓冲区等待发送。这个数字显示了缓冲区的当前占用情况,与缓冲区的总容量(在这种情况下是10000个指标)相比。
- Wrote batch of X metrics in Y ms : 这些消息表示Telegraf成功地将一批指标发送到InfluxDB,并给出了处理这批指标所花费的时间。例如,"Wrote batch of 80 metrics in 8.915386ms"意味着Telegraf成功地将80个指标作为一批发送到InfluxDB,这个过程花费了大约8.92毫秒。
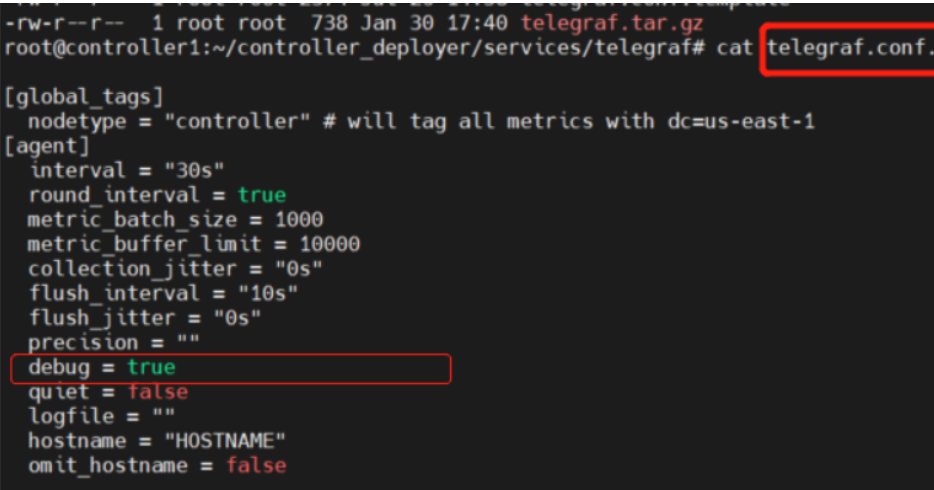
3.通过修改配置文件开启debug模式:
修改 telegraf.conf 配置文件中得 debug 为 true