节点的属性:

内置节点:

修改节点属性的核心方法:
js
source.prop('size', { width: 120, height: 50 }) // 修改 x 坐标
source.attr('rect/fill', '#ccc') // 修改填充色,等价于 source.prop('attrs/rect/fill', '#ccc')
在React中的用法:
js
change = (command: string) => {
 const nodes = this.graph.getNodes()
 switch (command) {
   case 'prop':
     nodes.forEach((node) => {
       const width = 100 + Math.floor(Math.random() * 50)
       const height = 40 + Math.floor(Math.random() * 10)
       node.prop('size', { width, height })
     })
     break
   case 'attr':
     nodes.forEach((node) => {
       const color = Color.random().toHex()
       node.attr('body/fill', color)
     })
     break
   default:
     break
 }
}
vue3实现修改节点大小
html
<script setup>
import {Graph} from '@antv/x6'
import {onMounted, ref} from "vue";
import {Snapline} from "@antv/x6-plugin-snapline";
const data = {
nodes: [
{
id: 'node1',
shape: 'rect',
x: 40,
y: 40,
width: 100,
height: 40,
label: 'hello',
attrs: {
// body 是选择器名称,选中的是 rect 元素
body: {
stroke: '#8f8f8f',
strokeWidth: 1,
fill: '#fff',
rx: 6,
ry: 6,
},
},
},
{
id: 'node2',
shape: 'rect',
x: 160,
y: 180,
width: 100,
height: 40,
label: 'world',
attrs: {
body: {
stroke: '#8f8f8f',
strokeWidth: 1,
fill: '#fff',
rx: 6,
ry: 6,
},
},
},
],
// 边:连接节点
edges: [
{
shape: 'edge',
source: 'node1', // 开始节点
target: 'node2', // 目标节点,会建立从开始节点到目标节点的连线
label: 'x6',
attrs: {
// line 是选择器名称,选中的边的 path 元素
line: {
stroke: '#8f8f8f',
strokeWidth: 1,
},
},
},
],
}
const graph = ref() // 图对象
// 修改大小
const updateSize = () => {
const nodes = graph.value.getNodes()
nodes.forEach((node) => {
const width = 100 + Math.floor(Math.random() * 50)
const height = 40 + Math.floor(Math.random() * 10)
node.prop('size', {width, height})
})
}
onMounted(() => {
graph.value = new Graph({
container: document.getElementById('container'),
width: 800,
height: 600,
background: {
color: '#F2F7FA',
},
})
graph.value.fromJSON(data) // 渲染元素
graph.value.centerContent() // 居中显示
// 使用插件
graph.value.use(
// 自动对齐
new Snapline({
enabled: true,
}),
)
// 数据导出
console.log(graph.value.toJSON())
})
</script>
<template>
<div>
<div>
<button @click="updateSize">修改节点大小</button>
</div>
<div id="container"></div>
</div>
</template>
<style scoped>
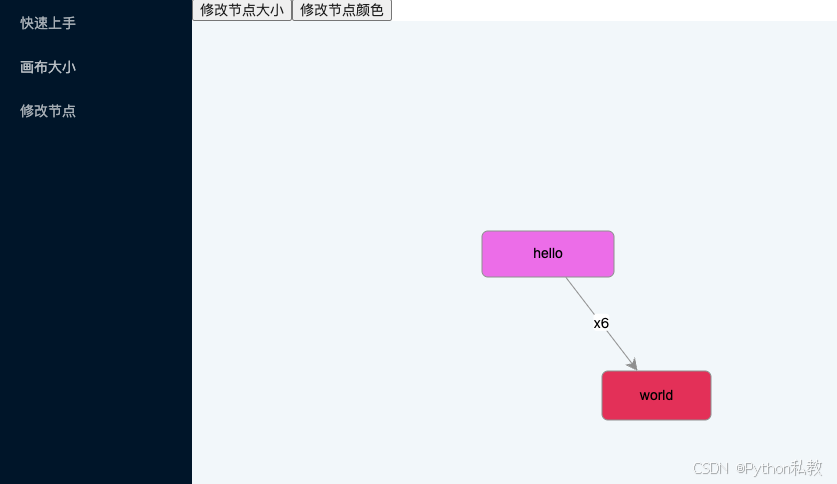
</style>vue3实现修改节点颜色
html
<script setup>
import {Color, Graph} from '@antv/x6'
import {onMounted, ref} from "vue";
import {Snapline} from "@antv/x6-plugin-snapline";

const data = {
  nodes: [
    {
      id: 'node1',
      shape: 'rect',
      x: 40,
      y: 40,
      width: 100,
      height: 40,
      label: 'hello',
      attrs: {
        // body 是选择器名称,选中的是 rect 元素
        body: {
          stroke: '#8f8f8f',
          strokeWidth: 1,
          fill: '#fff',
          rx: 6,
          ry: 6,
        },
      },
    },
    {
      id: 'node2',
      shape: 'rect',
      x: 160,
      y: 180,
      width: 100,
      height: 40,
      label: 'world',
      attrs: {
        body: {
          stroke: '#8f8f8f',
          strokeWidth: 1,
          fill: '#fff',
          rx: 6,
          ry: 6,
        },
      },
    },
  ],
  // 边:连接节点
  edges: [
    {
      shape: 'edge',
      source: 'node1', // 开始节点
      target: 'node2', // 目标节点,会建立从开始节点到目标节点的连线
      label: 'x6',
      attrs: {
        // line 是选择器名称,选中的边的 path 元素
        line: {
          stroke: '#8f8f8f',
          strokeWidth: 1,
        },
      },
    },
  ],
}

const graph = ref() // 图对象
// 修改大小
const updateSize = () => {
  const nodes = graph.value.getNodes()
  nodes.forEach((node) => {
    const width = 100 + Math.floor(Math.random() * 50)
    const height = 40 + Math.floor(Math.random() * 10)
    node.prop('size', {width, height})
  })
}
// 修改颜色
const updateColor = () => {
  const nodes = graph.value.getNodes()
  nodes.forEach((node) => {
    const color = Color.random().toHex()
    node.attr('body/fill', color)
  })
}
onMounted(() => {
  graph.value = new Graph({
    container: document.getElementById('container'),
    width: 800,
    height: 600,
    background: {
      color: '#F2F7FA',
    },
  })
  graph.value.fromJSON(data) // 渲染元素
  graph.value.centerContent() // 居中显示

  // 使用插件
  graph.value.use(
      // 自动对齐
      new Snapline({
        enabled: true,
      }),
  )

  // 数据导出
  console.log(graph.value.toJSON())
})
</script>

<template>
  <div>
    <div>
      <button @click="updateSize">修改节点大小</button>
      <button @click="updateColor">修改节点颜色</button>
    </div>
    <div id="container"></div>
  </div>
</template>

<style scoped>

</style>