目录
python
from sklearn.gaussian_process import GaussianProcessRegressor
from sklearn.gaussian_process.kernels import ExpSineSquared, WhiteKernel
from sklearn.linear_model import LinearRegression

import causalpy as cp
%config InlineBackend.figure_format = 'retina'
导入数据
python
data = cp.load_data("rd")
data.head()
线性模型和主效应模型
python
result = cp.skl_experiments.RegressionDiscontinuity(
    data,
    formula="y ~ 1 + x + treated",
    model=LinearRegression(),
    treatment_threshold=0.5,
)
fig, ax = result.plot()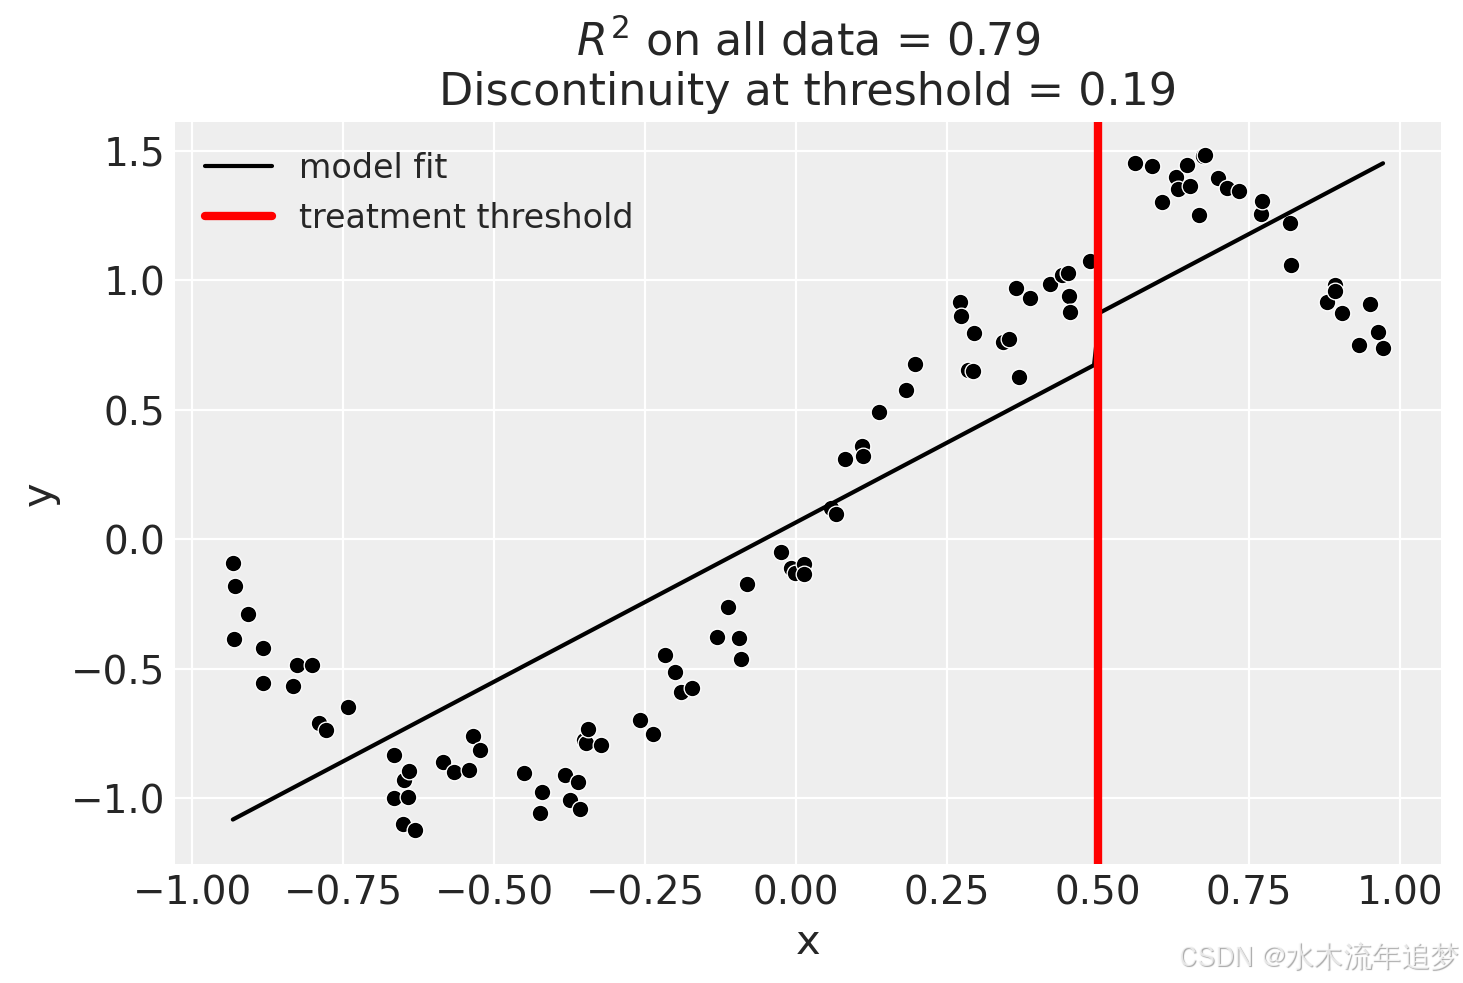
python
result.summary(round_to=3)Difference in Differences experiment
Formula: y ~ 1 + x + treated
Running variable: x
Threshold on running variable: 0.5
Results:
Discontinuity at threshold = 0.19
Model coefficients:
Intercept 0
treated[T.True] 0.19
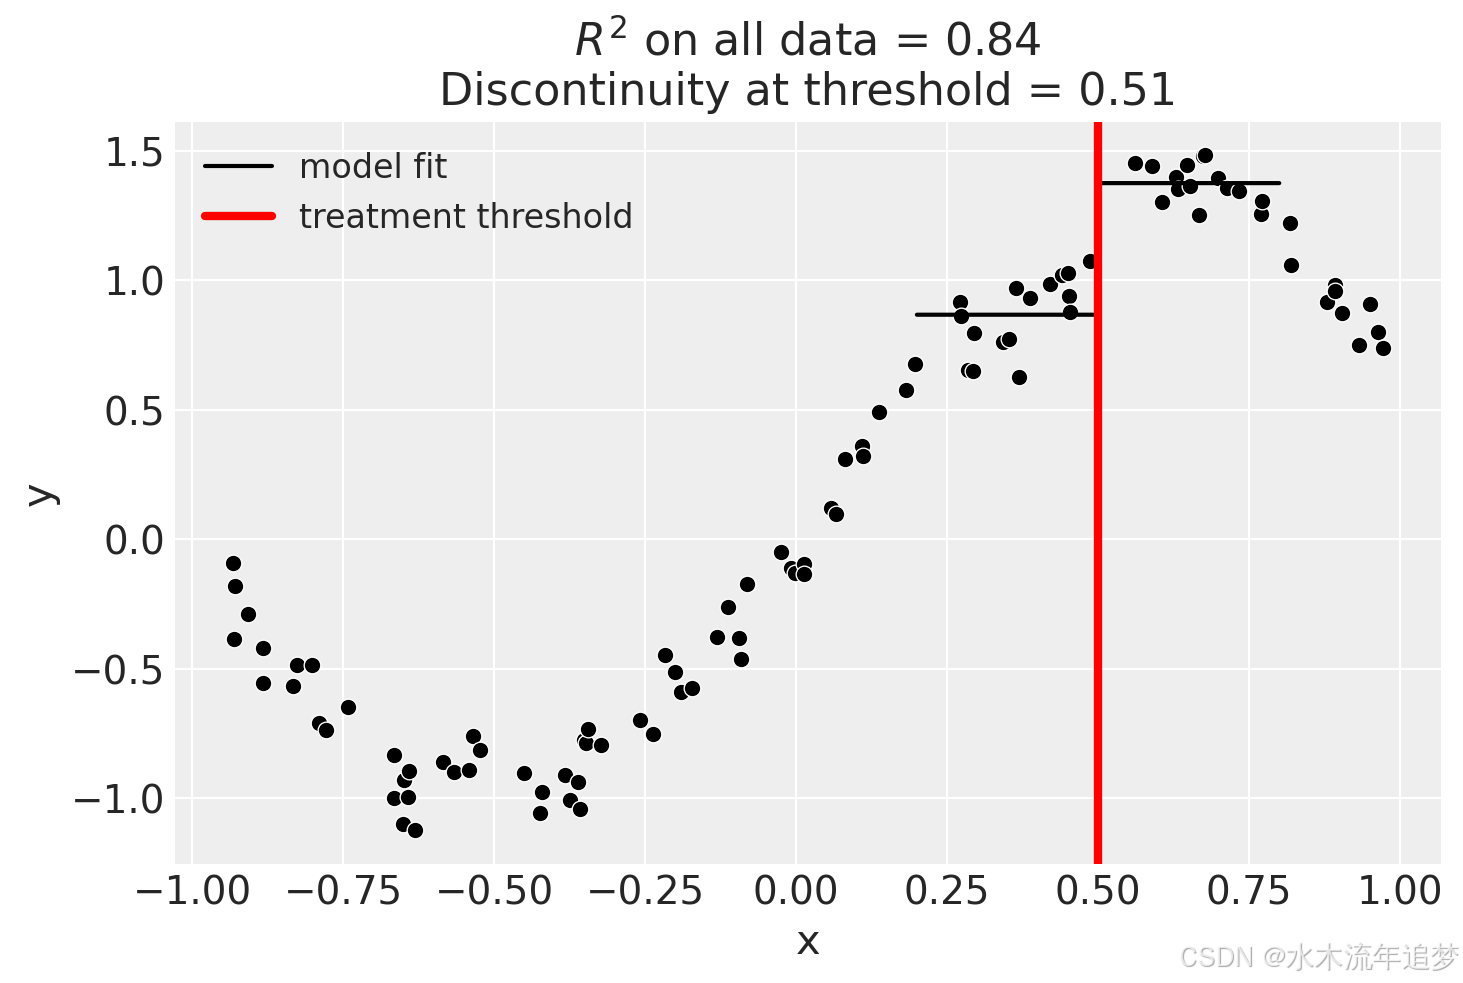
x 1.23线性模型、主效应模型和交互作用模型
python
result = cp.skl_experiments.RegressionDiscontinuity(
    data,
    formula="y ~ 1 + x + treated + x:treated",
    model=LinearRegression(),
    treatment_threshold=0.5,
)
result.plot();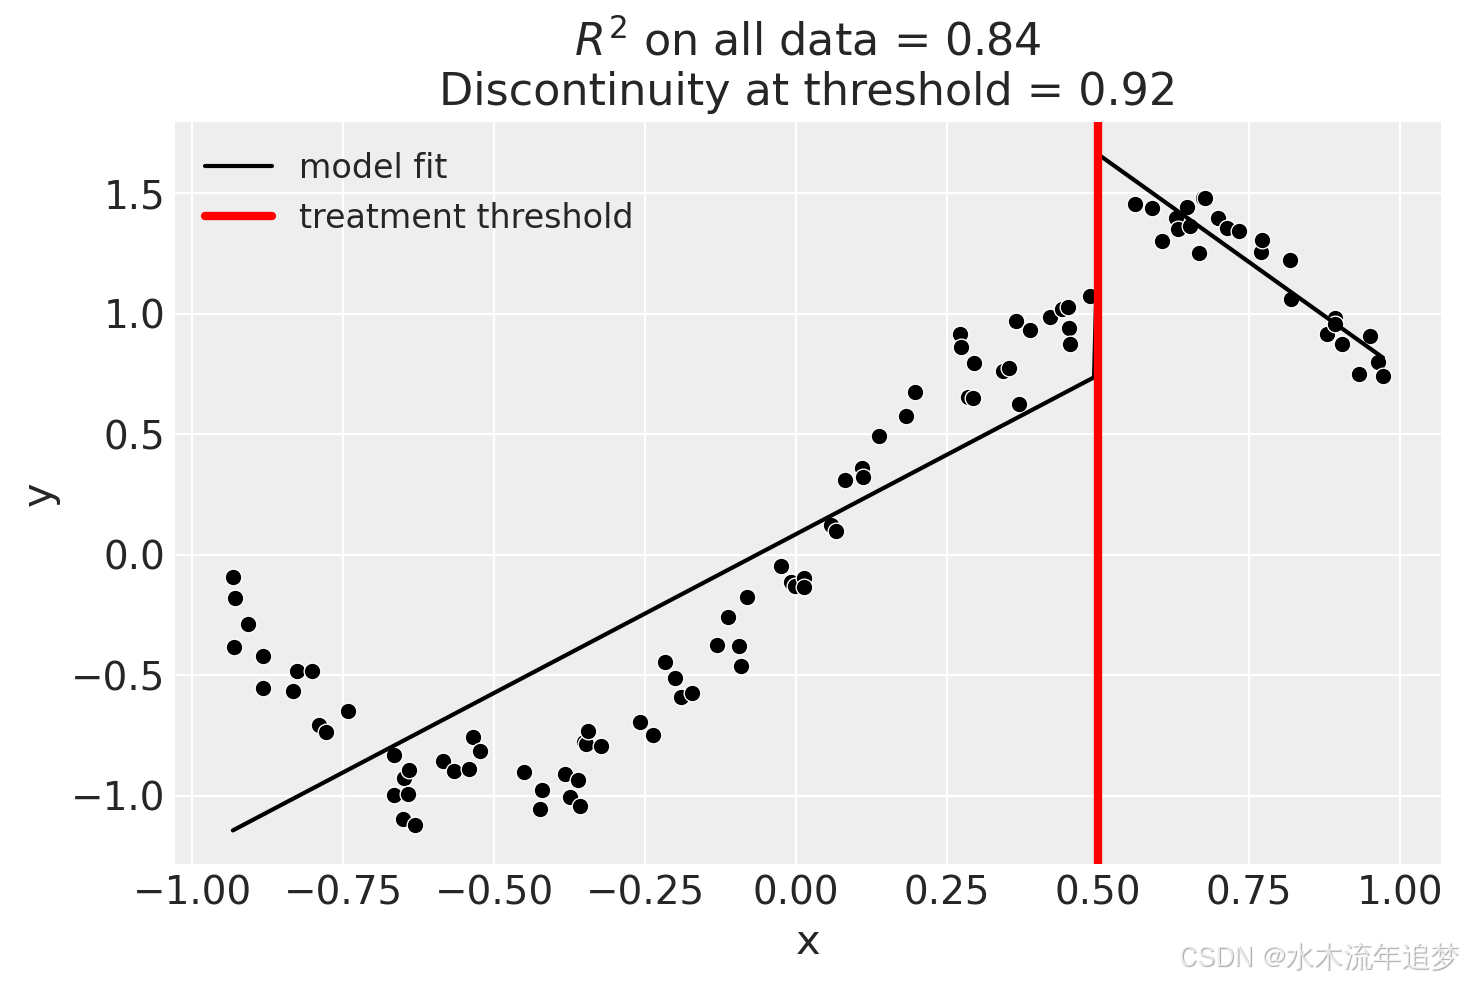
虽然我们可以看到这样做并不能很好地拟合数据,几乎肯定高估了阈值处的不连续性。
python
result.summary(round_to=3)Difference in Differences experiment
Formula: y ~ 1 + x + treated + x:treated
Running variable: x
Threshold on running variable: 0.5
Results:
Discontinuity at threshold = 0.92
Model coefficients:
Intercept 0
treated[T.True] 2.47
x 1.32
x:treated[T.True] -3.11使用bandwidth
我们处理这个问题的一种方法是使用 `bandwidth` 参数。这将只对阈值附近的一定带宽内的数据进行拟合。如果 x 是连续变量,那么模型将只对满足 的数据进行拟合。
python
result = cp.skl_experiments.RegressionDiscontinuity(
    data,
    formula="y ~ 1 + x + treated + x:treated",
    model=LinearRegression(),
    treatment_threshold=0.5,
    bandwidth=0.3,
)

result.plot();
我们甚至可以走得更远,只为接近阈值的数据拟合截距。但很明显,这将涉及更多的估计误差,因为我们使用的数据较少。
python
result = cp.skl_experiments.RegressionDiscontinuity(
    data,
    formula="y ~ 1 + treated",
    model=LinearRegression(),
    treatment_threshold=0.5,
    bandwidth=0.3,
)

result.plot();