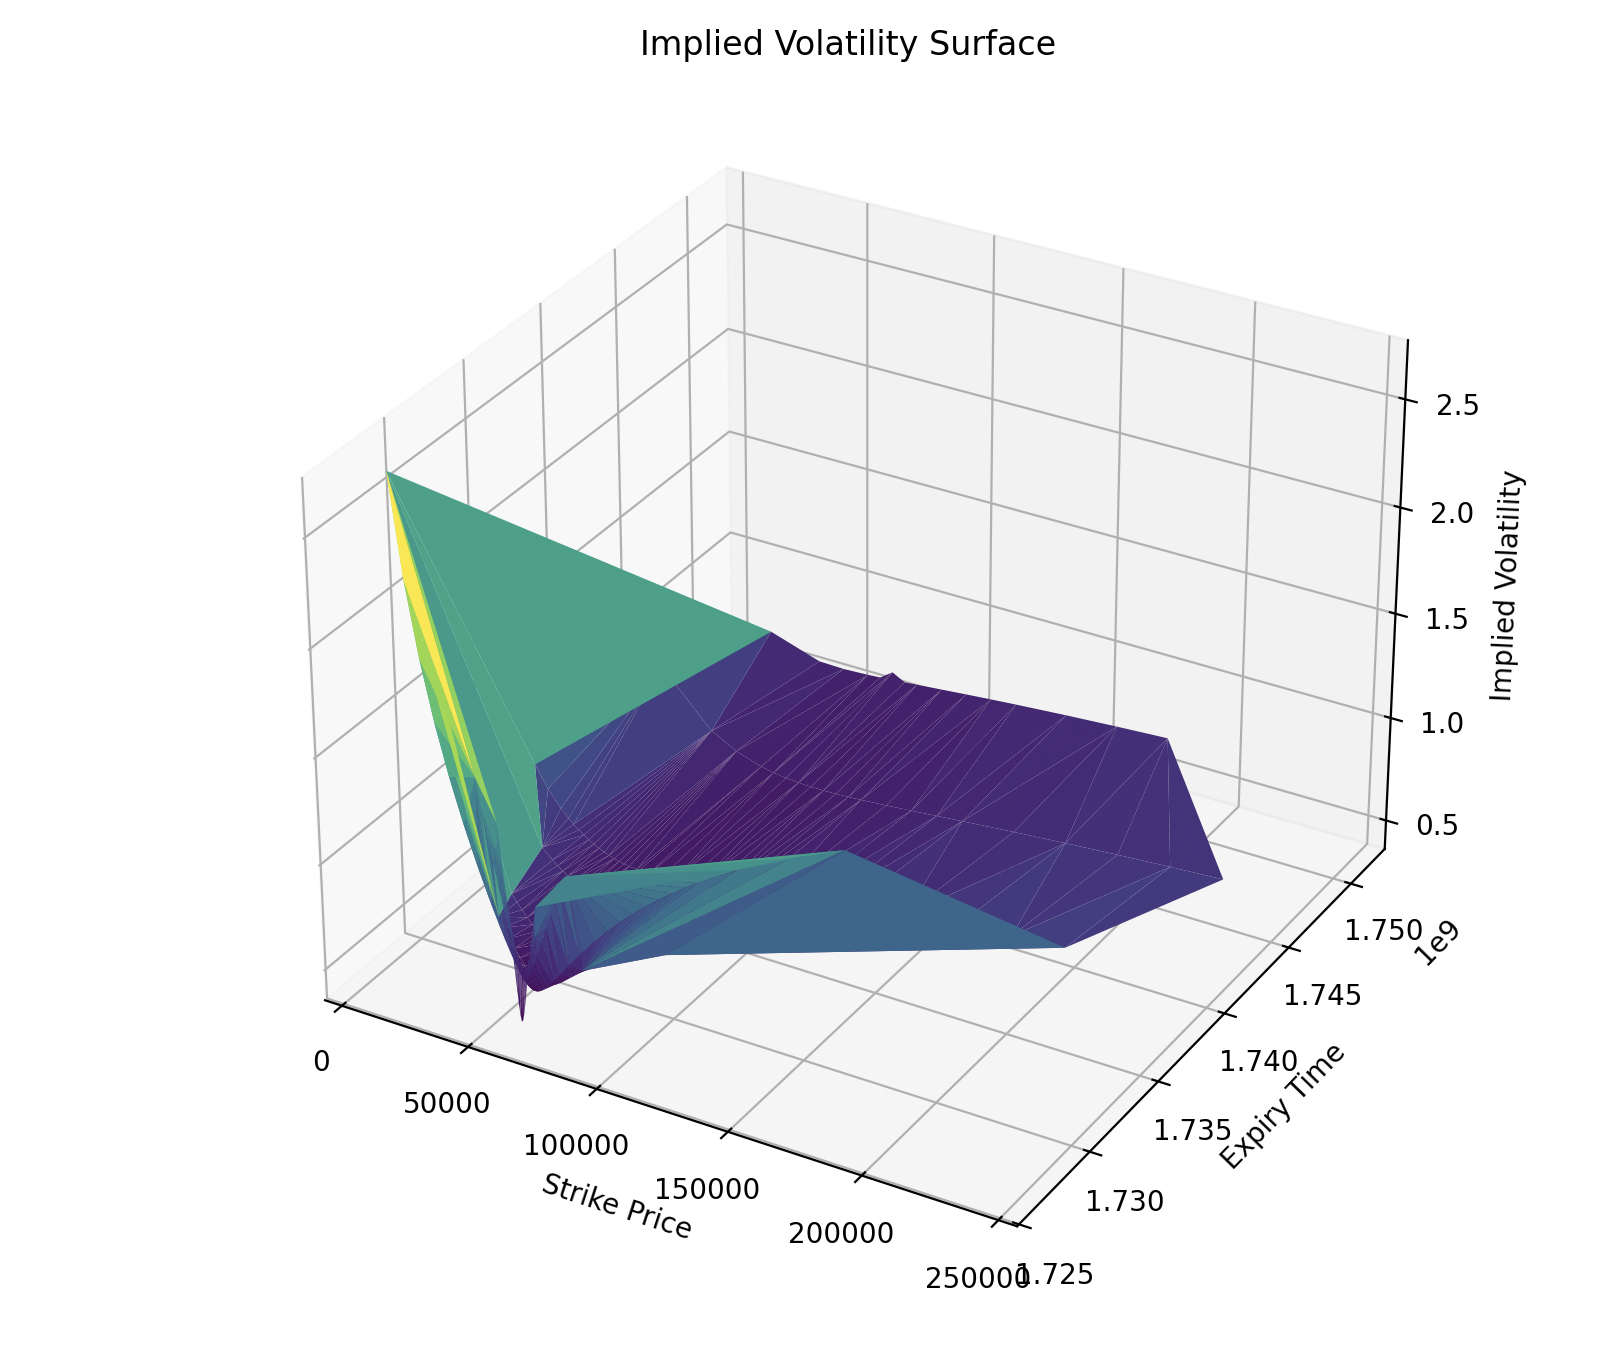
波动率曲面(Volatility Surface)是期权交易中展示隐含波动率随行权价(strike price)和到期时间(expiry time)变化的一种三维图形。
本文尝试通过 Python,通过 ccxt 基于从交易所获取期权的指标数据绘制构建 BTC 波动率曲面。
准备工作
首先,安装所需的库,确保环境可与交易所交互并绘制图表。
ccxt: 一个用于便于连接加密货币交易所的库。pandas: 用于数据处理,本文主要用于将 datetime 字符串转为 timestamp。matplotlib: 用于绘图。mpl_toolkits.mplot3d: 用于绘制三维图表。
安装命令:
bash
pip install ccxt matplotlib pandas期权合约数据
通过 ccxt 库可以方便地获取加密货币交易所的期权数据。本例中,我们使用 ccxt 的 Bybit API 获取 BTC 期权的市场数据。
通过 ccxt 的 API fetch_option_markets 即可获取期权合约数据。
python
import ccxt
from collections import defaultdict

# 初始化ccxt并连接到Bybit交易所
bybit = ccxt.bybit(
    {
        "options": {"loadAllOptions": True}, # 获取所有的期权数据
    }
)

# 获取BTC期权市场数据
option_markets = bybit.fetch_option_markets({"baseCoin": "BTC"})
通过在初始化交易所 API 实例时配置 loadAllOptions 和 fetch_option_markets 参数 baseCoin 为 BTC 指定获取所有 BTC 的期权合约数据
输出 option_markets 中的数据查看下结构:
plain
{'id': 'BTC-20SEP24-70000-P', 'lowercaseId': None, 'symbol': 'BTC/USDC:USDC-240920-70000-P', 'base': 'BTC', 'quote': 'USDC', 'settle': 'USDC', 'baseId': 'BTC', 'quoteId': 'USDC', 'settleId': 'USDC', 'type': 'option', 'spot': False, 'margin': False, 'swap': False, 'future': False, 'option': True, 'index': None, 'active': True, 'contract': True, 'linear': None, 'inverse': None, 'subType': None, 'taker': 0.0006, 'maker': 0.0001, 'contractSize': 0.01, 'expiry': 1726819200000, 'expiryDatetime': '2024-09-20T08:00:00.000Z', 'strike': 70000.0, 'optionType': 'put', 'precision': {'amount': 0.01, 'price': 5.0}, 'limits': {'leverage': {'min': None, 'max': None}, 'amount': {'min': 0.01, 'max': 500.0}, 'price': {'min': 5.0, 'max': 10000000.0}, 'cost': {'min': None, 'max': None}}, 'created': 1724918400000, 'info': {'symbol': 'BTC-20SEP24-70000-P', 'status': 'Trading', 'baseCoin': 'BTC', 'quoteCoin': 'USDC', 'settleCoin': 'USDC', 'optionsType': 'Put', 'launchTime': '1724918400000', 'deliveryTime': '1726819200000', 'deliveryFeeRate': '0.00015', 'priceFilter': {'minPrice': '5', 'maxPrice': '10000000', 'tickSize': '5'}, 'lotSizeFilter': {'maxOrderQty': '500', 'minOrderQty': '0.01', 'qtyStep': '0.01'}}}其中的 strike 为行权价,optionType 为期权类型(call 和 put),expiryDatetime 为到期时间。
为了分析,我要将期权按到期时间(expiryDatetime)排序,且只过滤看涨期权(call)和活跃中的期权合约。
将这部分数据提取出来,如下所示:
python
# 将期权按到期时间分类
expiry_option_markets = defaultdict(list)
for option_market in option_markets:
    if option_market["active"] and option_market["optionType"] == "call":
        expiry_option_markets[option_market["expiryDatetime"]].append(option_market)
提取行权价和隐含波动率
将数据按到期时间排序,确保后续的其他的数据按到期日期顺序排列。
python
# 先对到期时间进行排序
sorted_expiry_dates = sorted(
    expiry_option_markets.keys(), key=lambda d: pd.to_datetime(d).timestamp()
)接下来就是从期权市场数据中提取出行权价(strike)和隐含波动率(implied volatility)。
隐含波动率通常是由交易所计算并提供的,我们通过 fetch_greeks 提取交易所的数据,不自己计算。
python
# 行权价和隐含波动率数据的存储
strike_prices = []
expiry_times = []
implied_vols = []

# 遍历每个到期时间,收集行权价和隐含波动率
for expiry_date in sorted_expiry_dates:
    option_markets = expiry_option_markets[expiry_date]
    for option_market in option_markets:
        greeks = bybit.fetch_greeks(symbol=option_market["id"])  # 获取希腊字母和波动率
        strike_price = option_market["strike"]
        implied_volatility = greeks["markImpliedVolatility"]

        # 将数据添加到列表中
        strike_prices.append(strike_price)
        expiry_times.append(pd.to_datetime(expiry_date).timestamp())  # 转为时间戳
        implied_vols.append(implied_volatility)
这个步骤中,通过 Bybit 的 API 获取了每个期权的隐含波动率(标记价格的隐含波动率),存储起来便于绘图。
如果有获取希腊字母的需求,如 delta、gamma、theta、vega 等,这个接口中也有相应的字段,可自行查看。
现在我们有了行权价-strikes,到期日期 expiry_times 和对应的隐含波动率 implied_vols。
绘制波动率曲面
数据准备就绪后,我们使用 matplotlib 库绘制三维波动率曲面图。这张图的三维轴分别表示行权价(X轴)、到期时间(Y轴)和隐含波动率(Z轴)。
python
import numpy as np
import pandas as pd
import matplotlib.pyplot as plt
from mpl_toolkits.mplot3d import Axes3D

# 创建图形
fig = plt.figure(figsize=(12, 8))
ax = fig.add_subplot(111, projection="3d")

# 绘制三维曲面
surf = ax.plot_trisurf(strike_prices, expiry_times, implied_vols, cmap="viridis")

# 设置坐标轴标签
ax.set_xlabel("Strike Price")
ax.set_ylabel("Expiry Time")
ax.set_zlabel("Implied Volatility")

# 设置标题
ax.set_title("Implied Volatility Surface")

# 显示图形
plt.show()
如下所示:

看着有点怪怪的,没发现问题,应该是对的吧。
解释:
- X 轴(行权价): 期权的行权价格。它决定了期权持有者是否会在到期时行使期权。
- Y 轴(到期时间): 期权的到期时间,通常表示为 UNIX 时间戳。
- Z 轴(隐含波动率): 隐含波动率反映了市场对于标的资产未来波动的预期。
plot_trisurf 函数通过三角剖分来绘制不规则网格的数据点,使得我们能够直观地观察隐含波动率随行权价和到期时间的变化。
结语
本文介绍了如何使用 Python 获取交易所 BTC 期权数据,并通过隐含波动率绘制波动率曲面。
我还在不断学习中,希望这篇文章对你有用!