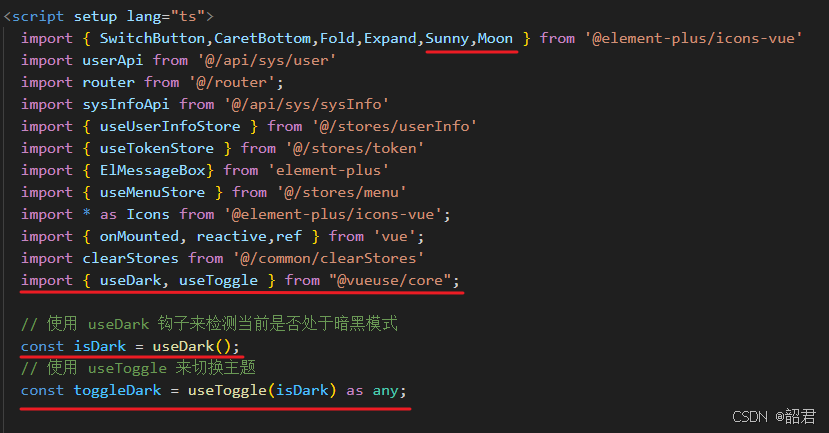
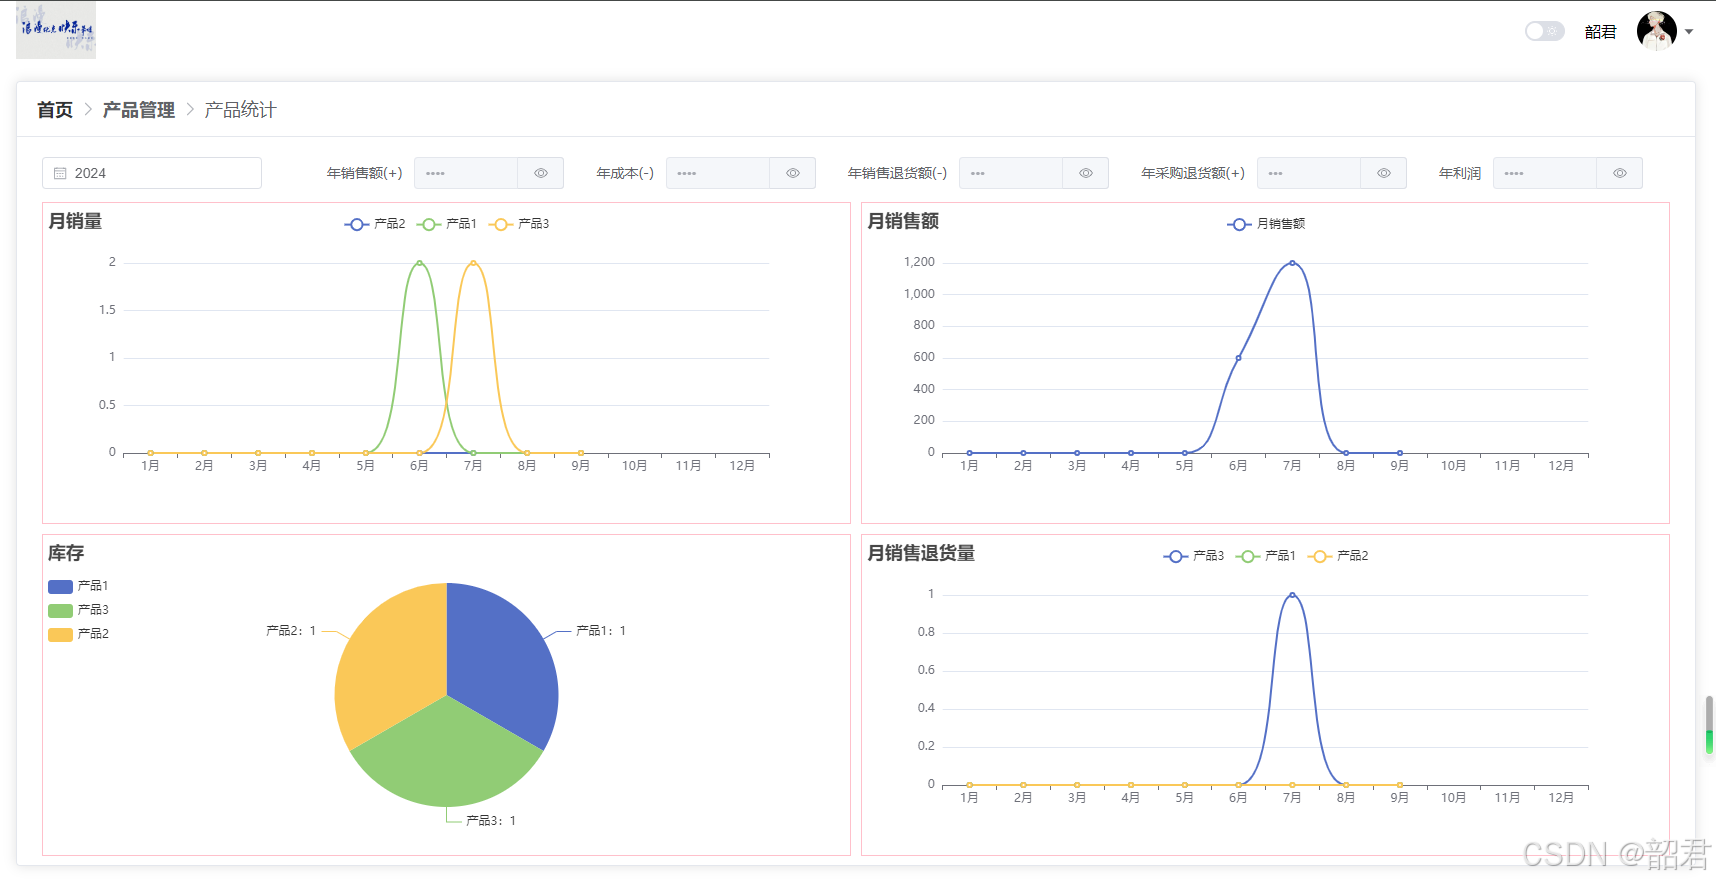
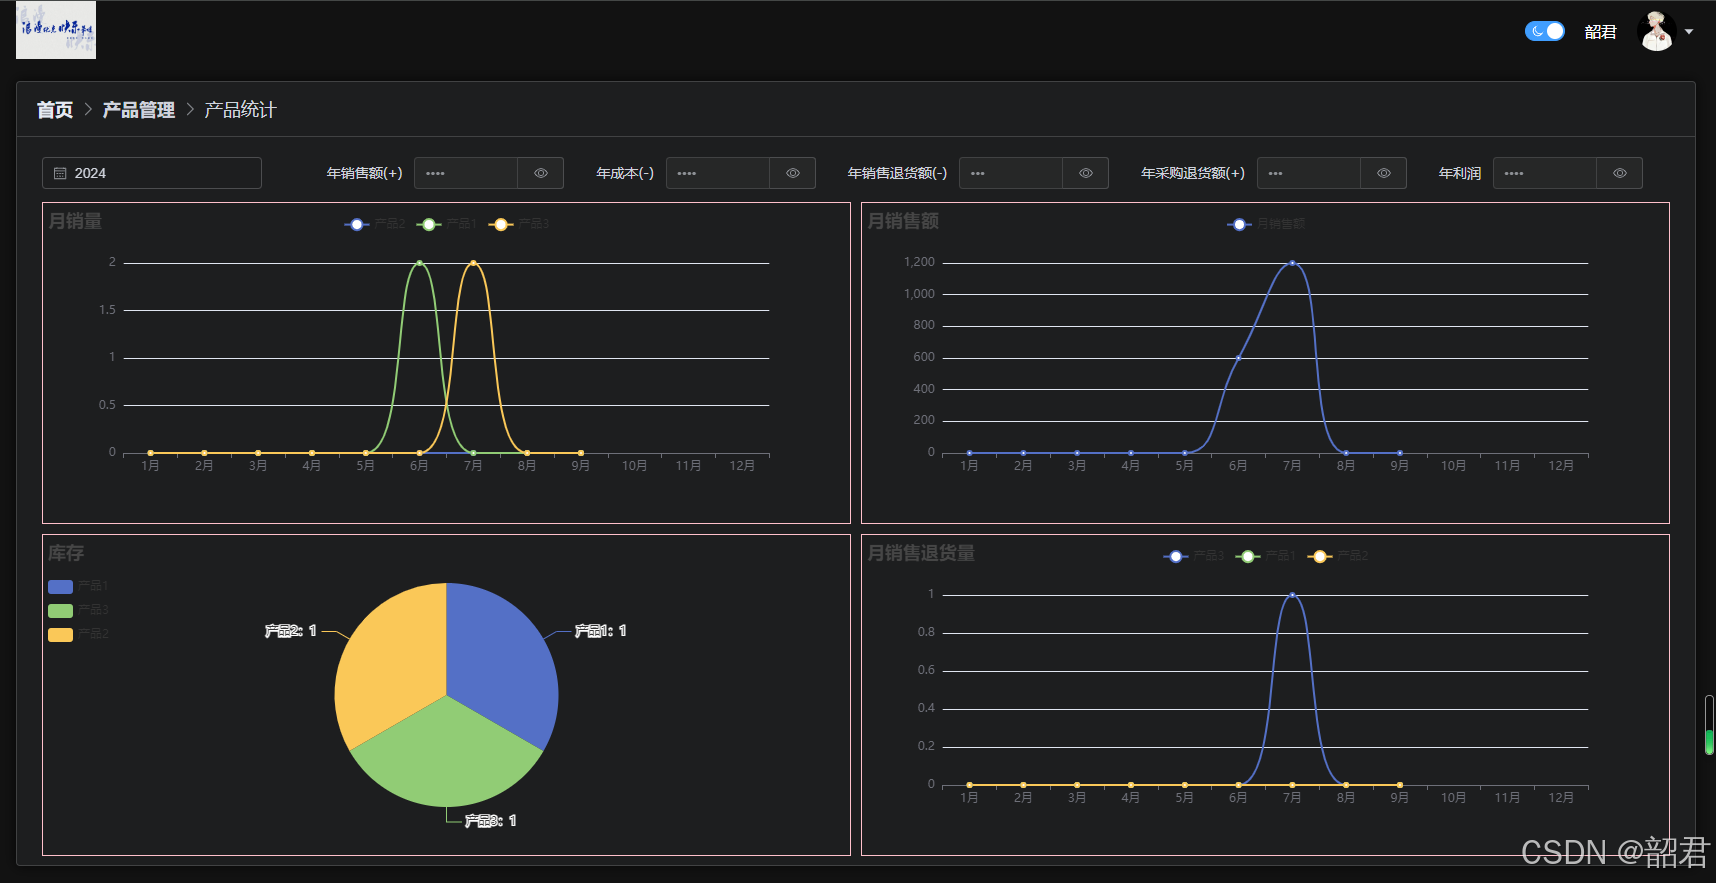
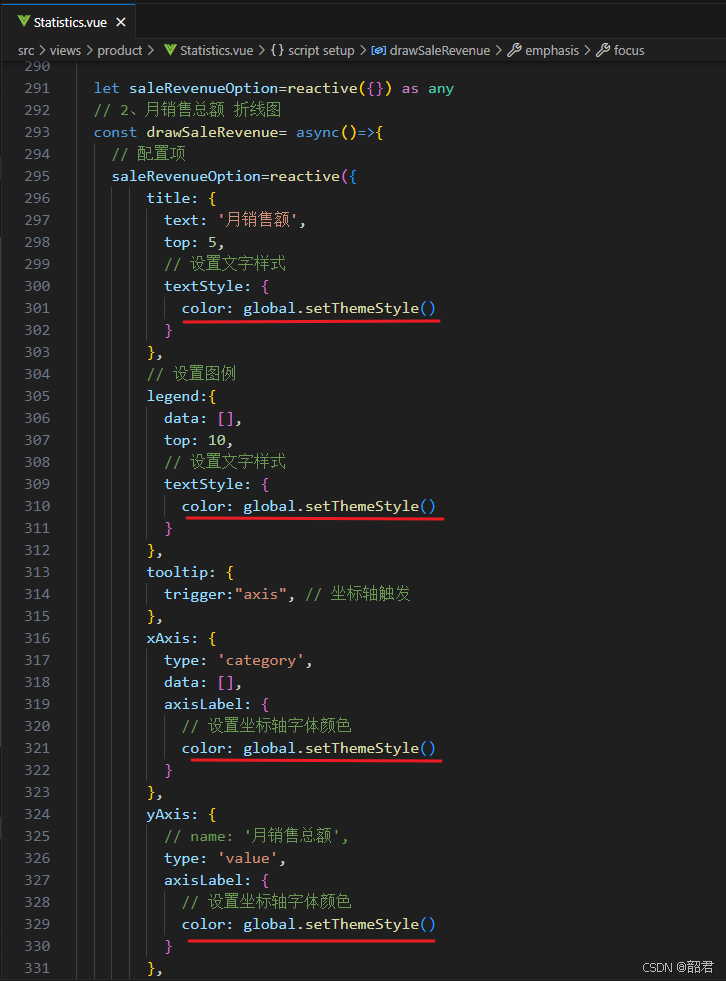
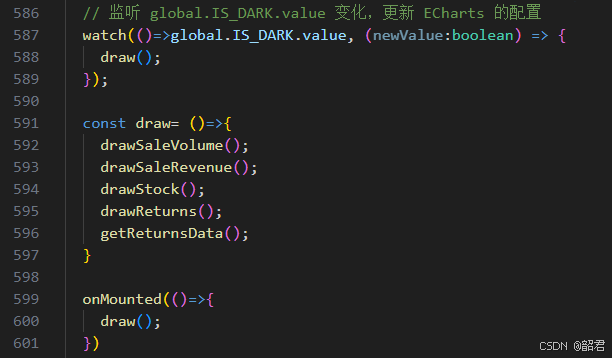
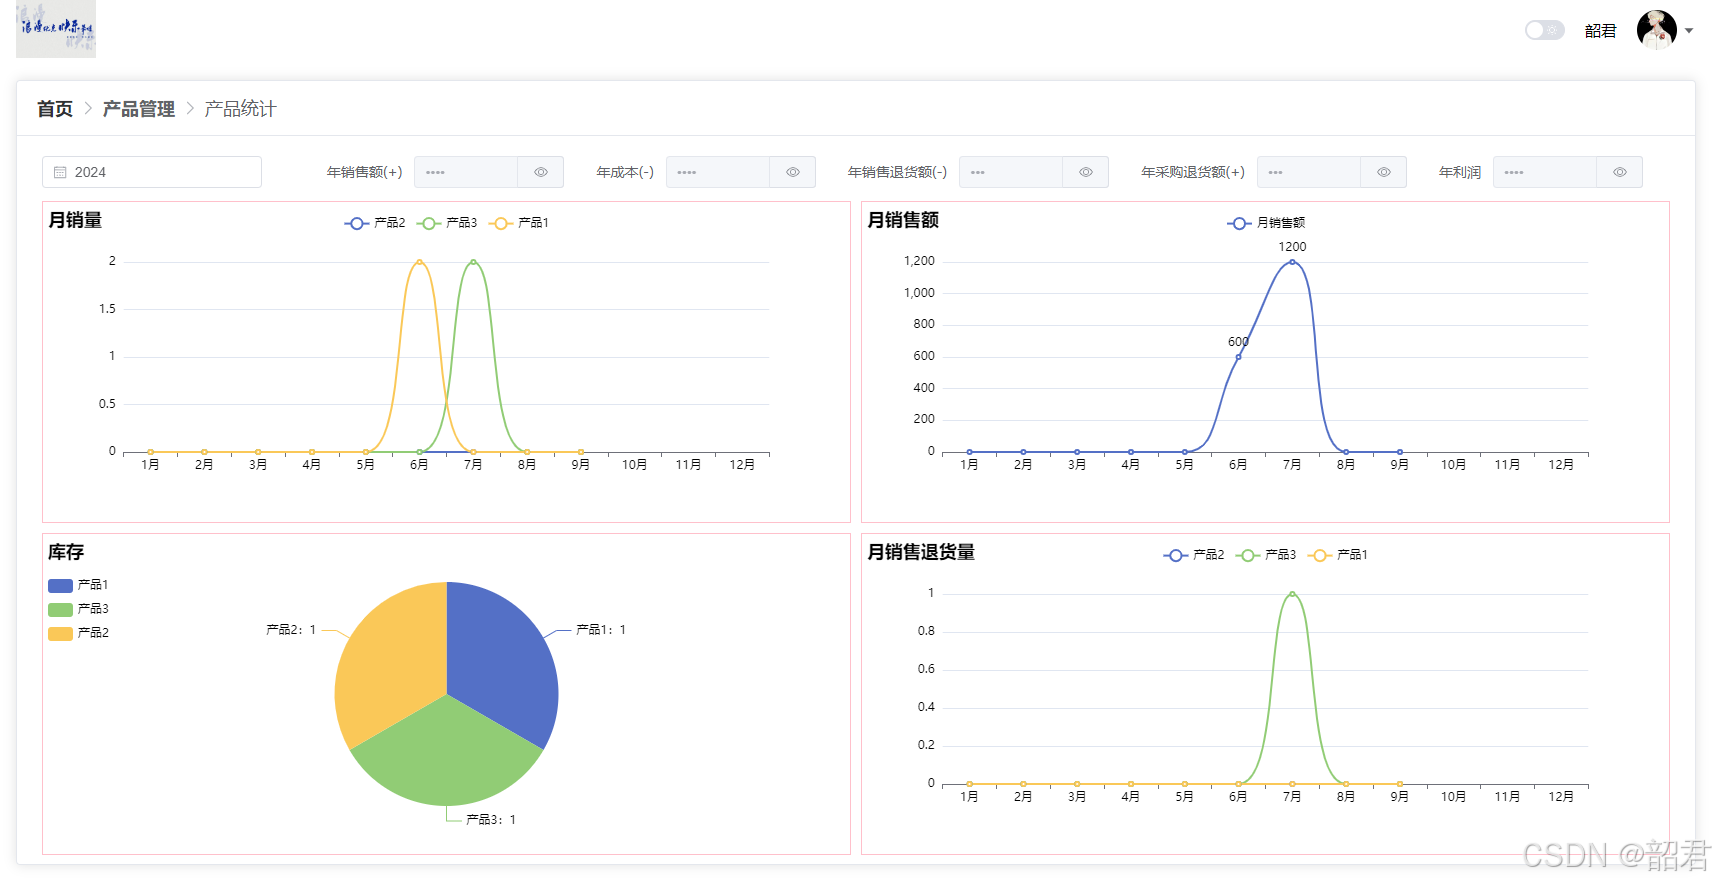
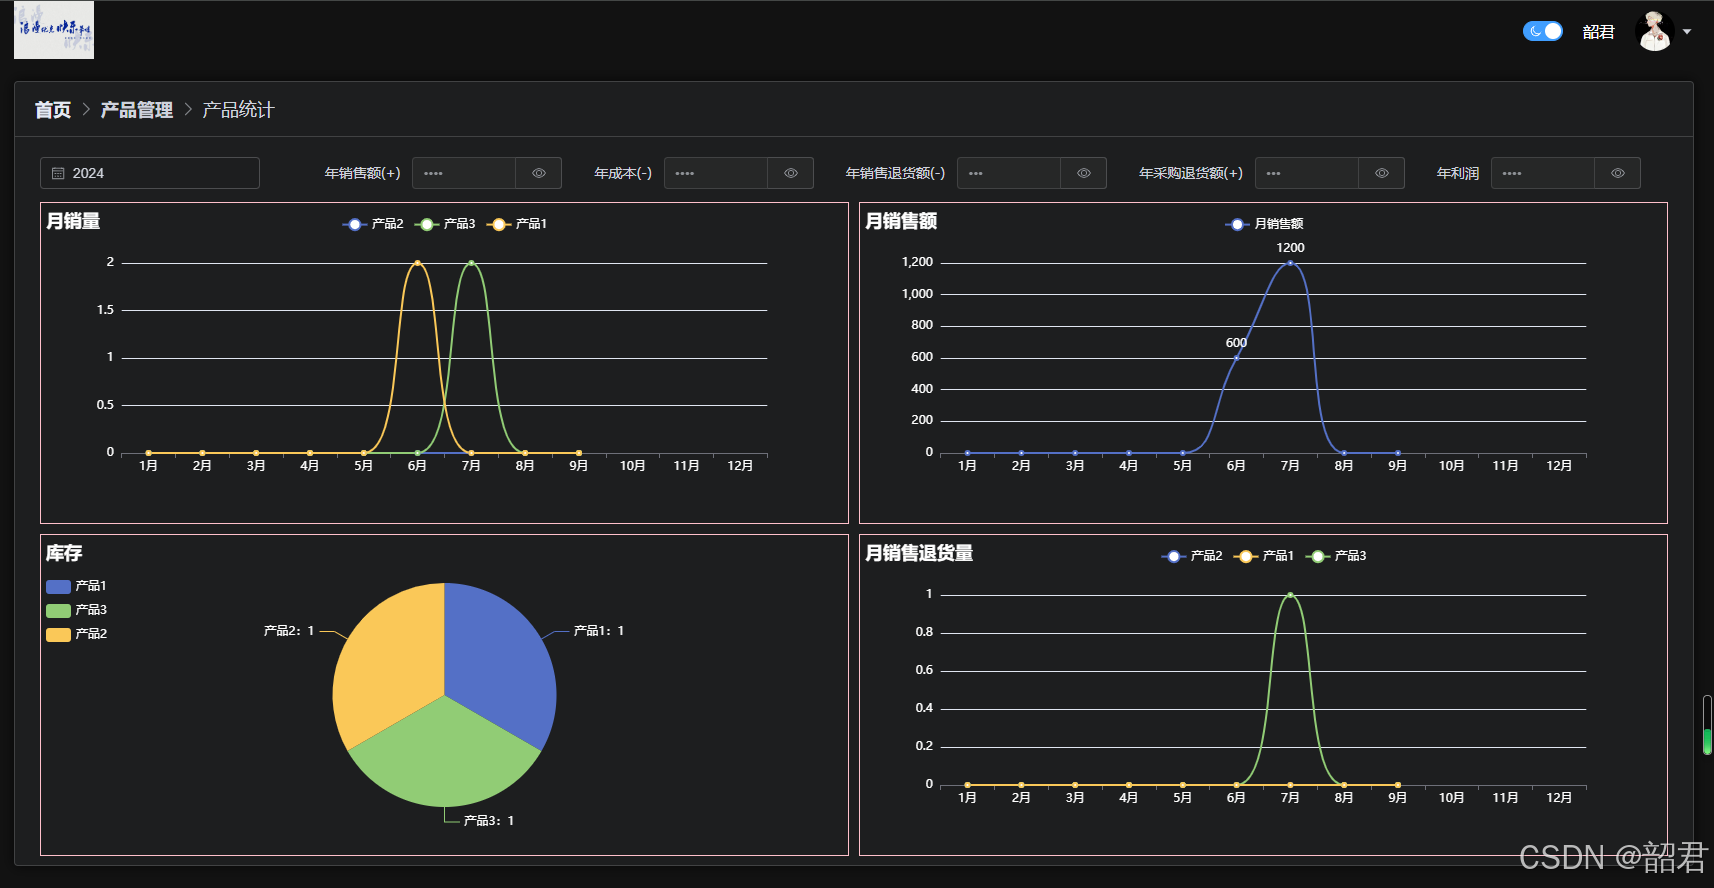
html
复制代码
<template>
  <el-card class="container">
    <template #header>
      <div class="header">
        <el-breadcrumb :separator-icon="ArrowRight">
          <el-breadcrumb-item :to="{ path: '/home/index' }" class="title">首页</el-breadcrumb-item>
          <el-breadcrumb-item class="title">产品管理</el-breadcrumb-item>
          <el-breadcrumb-item class="title">产品统计</el-breadcrumb-item>
        </el-breadcrumb>
      </div>
    </template>

    <div class="top">
      <div class="date-picker">
        <el-date-picker
          v-model="date"
          type="year"
          format="YYYY"
          value-format="YYYY-MM-DD"
          @change="draw"
        />
      </div>

      <div class="statistics">
        <el-form inline>
          <el-form-item label="年销售额(+)">
            <el-input v-model="sale" :type="saleVisible ? 'text' : 'password'" disabled >
              <template #append>
                <el-button :icon="saleVisible ? Hide : View" @click="showSale" />
              </template>
            </el-input>
          </el-form-item>

          <el-form-item label="年成本(-)">
            <el-input v-model="cost" :type="costVisible ? 'text' : 'password'" disabled>
              <template #append>
                <el-button :icon="costVisible ? Hide : View" @click="showCost" />
              </template>
            </el-input>
          </el-form-item>

          <el-form-item label="年销售退货额(-)">
            <el-input v-model="saleReturns" :type="saleReturnsVisible ? 'text' : 'password'" disabled>
              <template #append>
                <el-button :icon="saleReturnsVisible ? Hide : View" @click="showSaleReturns" />
              </template>
            </el-input>
          </el-form-item>

          <el-form-item label="年采购退货额(+)">
            <el-input v-model="purchaseReturns" :type="purchaseReturnsVisible ? 'text' : 'password'" disabled>
              <template #append>
                <el-button :icon="purchaseReturnsVisible ? Hide : View" @click="showPurchaseReturns" />
              </template>
            </el-input>
          </el-form-item>

          <el-form-item label="年利润">
            <el-input v-model="profit" :type="profitVisible ? 'text' : 'password'" disabled>
              <template #append>
                <el-button :icon="profitVisible ? Hide : View" @click="showProfit" />
              </template>
            </el-input>
          </el-form-item>
        </el-form>
      </div>
    </div>

    <el-scrollbar height="670px">
      <div class="mycharts">
        <!-- 1、各产品月销量 -->
        <div id="saleVolume" class="mychart"></div>
        <!-- 2、月销售总额 -->
        <div id="saleRevenue" class="mychart"></div>
      </div>

      <div class="mycharts">
        <!-- 3、库存 -->
        <div id="stock" class="mychart"></div>
        <!-- 4、月销售退货量 -->
        <div id="returns" class="mychart"></div>
      </div>
    </el-scrollbar>

  </el-card>
</template>

<script setup lang="ts">
  import ordersApi from '@/api/product/orders';
  import productApi from '@/api/product/product';
  import { onMounted, reactive, ref,watch } from 'vue'
  import { ArrowRight,View,Hide } from '@element-plus/icons-vue'
  import * as echarts from 'echarts';
  import returnsApi from '@/api/product/returns';
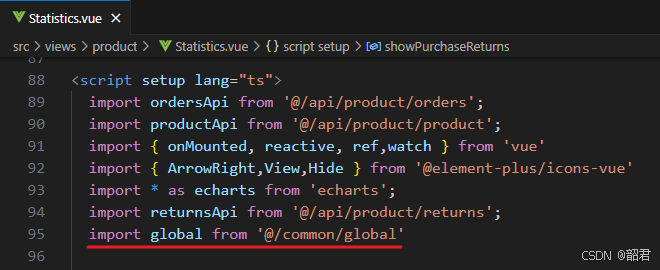
  import global from '@/common/global'


  const now = new Date();         // 当前日期
  const year = now.getFullYear(); // 获取当前年份
  let date=ref(`${year}-01-01`)

  // 1:年成本(采购总额+销售邮费+退货邮费),2:年销售额,3:年利润
  let maps=reactive(new Map()) as any;
  // 1:年采购退货总额,2:年销售退货总额,3:年退货邮费
  let returnsMap=reactive(new Map()) as any;

  // 年成本(-):采购总额+销售邮费+退货邮费
  const cost=ref(0.00)
  // 年销售额(+)
  const sale=ref(0.00)
  // 年利润
  const profit=ref(0.0)
  // 年销售退货额(-)
  const saleReturns=ref(0.00)
  // 年采购退货额(+)
  const purchaseReturns=ref(0.00)

  const costVisible=ref(false)
  const saleVisible=ref(false)
  const profitVisible=ref(false)
  const saleReturnsVisible=ref(false)
  const purchaseReturnsVisible=ref(false)

  const showCost= ()=>{
    costVisible.value = !costVisible.value;
  }
  const showSale= ()=>{
    saleVisible.value = !saleVisible.value;
  }
  const showProfit= ()=>{
    profitVisible.value = !profitVisible.value;
  }
  const showSaleReturns= ()=>{
    saleReturnsVisible.value = !saleReturnsVisible.value;
  }
  const showPurchaseReturns= ()=>{
    purchaseReturnsVisible.value = !purchaseReturnsVisible.value;
  }

  const init= ()=>{
    cost.value=maps.get("1");
    sale.value=maps.get("2");
    saleReturns.value=returnsMap.get("2");
    purchaseReturns.value=returnsMap.get("1");
    profit.value=(sale.value+purchaseReturns.value)-(cost.value+saleReturns.value);
  }

  // 1:年成本(采购总额+销售邮费+退货邮费),2:年销售额,3:年利润
  const getData= async()=>{
    const response = await ordersApi.yearStatistics(date.value);
     Object.entries()函数时,它会将对象的键转换为字符串类型
    for (const [key, value] of Object.entries(response.data)) {
      // 将字符串键转换回数字
      // const Key = Number(key);
      maps.set(key, value);
    }
    // 成本增加退货邮费
    maps.set("1",maps.get("1")+returnsMap.get("3"));

    init();
  }

  // 1:年采购退货总额,2:年销售退货总额,3:年退货邮费
  const getReturnsData= async()=>{
    const response = await returnsApi.yearStatistics(date.value);
     Object.entries()函数时,它会将对象的键转换为字符串类型
    for (const [key, value] of Object.entries(response.data)) {
      // 将字符串键转换回数字
      // const Key = Number(key);
      returnsMap.set(key, value);
    }
    getData();
  }

  let saleVolumeOption=reactive({}) as any;

  // 1、各产品月销量 折线图
  const drawSaleVolume= async()=>{
    // 配置项
    saleVolumeOption=reactive({
        title: {
          text: '月销量',
          top: 5,
          // 设置标题文字样式
          textStyle: {
            color: global.setThemeStyle()
          }
        },
        // 设置图例
        legend:{
          data: [],
          top: 10,
          // 设置图例文字样式
          textStyle: {
            color: global.setThemeStyle()
          }
        },
        tooltip: {
          trigger:"axis", // 坐标轴触发
        },
        xAxis: {
          type: 'category',
          data: [],
          axisLabel: {
            // 设置坐标轴字体颜色
            color: global.setThemeStyle()
          }
        },
        yAxis: {
          // name: '各产品月销量',
          type: 'value',
          axisLabel: {
            // 设置坐标轴字体颜色
            color: global.setThemeStyle()
          }
        },
        // 选中高亮
        emphasis:{
          focus:"series"
        },
        series: []
      });

    // xAxisData 与后端返回的数据适配
    const xAxisData=reactive(['JANUARY', 'FEBRUARY', 'MARCH', 'APRIL', 'MAY', 'JUNE', 'JULY', 'AUGUST', 'SEPTEMBER', 'OCTOBER', 'NOVEMBER', 'DECEMBER']) as any
    // xData 用于前端展示
    const xData=reactive(['1月', '2月', '3月', '4月','5月', '6月', '7月', '8月','9月', '10月', '11月', '12月']) as any

    // series数据
    const seriesData = reactive([]) as any;
    // 图例
    let legendData = reactive([]) as any;


    // 后端返回的map数据
    let map=reactive(new Map()) as any;

    // 初始化 Echarts 实例
    const myEchart=echarts.init(document.getElementById("saleVolume"));

    // 折线图 填充x轴数据
    saleVolumeOption.xAxis.data=xData;

    // 将后端数据转换为y轴适配的数据(map->list),定义了一个匿名的异步函数,并立即执行
    (async() => {
      const response = await ordersApi.saleStatistics(date.value);
       Object.entries()函数时,它会将对象的键转换为字符串类型
      for (const [key, value] of Object.entries(response.data)) {
        map.set(key, value);
      }
      return map;
    })().then(async()=>{
      // map.forEach(async(value:any, key:any) => {
      //   seriesData.push({
      //     name: key,
      //     type: 'line',
      //     // 然后,为这个series填充data,data应该是对应月份的数值
      //     data: xAxisData.map((month:any) => value[month] || 0)
      //   });
      //   keys.push(key);
      // })
      // // 填充 折线图 y轴数据
      // option.series=seriesData;
      // // option.legend.data=legendData;

      // 创建一个Promise数组,用于等待所有产品名称的获取
      const promises = Array.from(map.entries()).map(async ([key, value] : any) => {
        const res = await productApi.getNameById(key);
        seriesData.push({
          name: res.data,
          type: 'line',
          smooth: true,
          data: xAxisData.map((month:any) => value[month]),
        });
        // 同时添加到图例数据
        legendData.push(res.data);
      });

      // 等待所有Promise完成
      await Promise.all(promises);

      // 更新图表配置
      saleVolumeOption.series = seriesData;
      saleVolumeOption.legend.data = legendData;

      // 绘制图表
      myEchart.setOption(saleVolumeOption);
    });
  }

  let saleRevenueOption=reactive({}) as any
  // 2、月销售总额 折线图
  const drawSaleRevenue= async()=>{
    // 配置项
    saleRevenueOption=reactive({
        title: {
          text: '月销售额',
          top: 5,
          // 设置文字样式
          textStyle: {
            color: global.setThemeStyle()
          }
        },
        // 设置图例
        legend:{
          data: [],
          top: 10,
          // 设置文字样式
          textStyle: {
            color: global.setThemeStyle()
          }
        },
        tooltip: {
          trigger:"axis", // 坐标轴触发
        },
        xAxis: {
          type: 'category',
          data: [],
          axisLabel: {
            // 设置坐标轴字体颜色
            color: global.setThemeStyle()
          }
        },
        yAxis: {
          // name: '月销售总额',
          type: 'value',
          axisLabel: {
            // 设置坐标轴字体颜色
            color: global.setThemeStyle()
          }
        },
        // 选中高亮
        emphasis:{
          focus:"series"
        },
        series: []
      });

    // xAxisData 与后端返回的数据适配
    const xAxisData=reactive(['JANUARY', 'FEBRUARY', 'MARCH', 'APRIL', 'MAY', 'JUNE', 'JULY', 'AUGUST', 'SEPTEMBER', 'OCTOBER', 'NOVEMBER', 'DECEMBER']) as any
    // xData 用于前端展示
    const xData=reactive(['1月', '2月', '3月', '4月','5月', '6月', '7月', '8月','9月', '10月', '11月', '12月']) as any

    // series数据
    let seriesData = reactive([]) as any;
    // 图例
    let legendData = reactive([]) as any;


    // 后端返回的map数据
    let map=reactive(new Map()) as any;

    // 初始化 Echarts 实例
    const myEchart=echarts.init(document.getElementById("saleRevenue"));

    // 折线图 填充x轴数据
    saleRevenueOption.xAxis.data=xData;

    // 将后端数据转换为y轴适配的数据(map->list),定义了一个匿名的异步函数,并立即执行
    (async() => {
      const response = await ordersApi.totalStatistics(date.value);
       Object.entries()函数时,它会将对象的键转换为字符串类型
      for (const [key, value] of Object.entries(response.data)) {
        map.set(key, value);
      }
      return map;
    })().then(()=>{
      seriesData.push({
        name: '月销售额',
        type: 'line',
        smooth: true,
        data: xAxisData.map((month:any) => map.get(month)),
        label:{
          show:true,
          position:'top',
          formatter:function(data:any){
            return data.value === 0 ? '' : data.value
          },
          // 设置图例文字样式
          textStyle: {
            color: global.setThemeStyle()
          }
        }
      });
      // 设置图例数据
      legendData.push('月销售额');

      // 更新图表配置
      saleRevenueOption.series = seriesData;
      saleRevenueOption.legend.data = legendData;

      // 绘制图表
      myEchart.setOption(saleRevenueOption);
    });
  }

  let stockOption=reactive({}) as any

  // 3、库存 饼图
  const drawStock= async()=>{
    // 配置项
    stockOption=reactive({
      title: {
        text: '库存',
        top: 5,
        // 设置文字样式
        textStyle: {
          color: global.setThemeStyle()
        }
      },
      // 设置图例
      legend:{
        data: [],
        top: 40,
        left:"left",
        orient:"vertical", // 竖直排列
        // 设置文字样式
        textStyle: {
          color: global.setThemeStyle()
        }
      },
      tooltip: {},
      // 选中高亮
      emphasis:{
        focus:"series"
      },
      series: []
    });

    // series数据
    let seriesData = reactive([]) as any;
    // 图例
    let legendData = reactive([]) as any;

    // 后端返回的map数据
    let map=reactive(new Map()) as any;

    // 初始化 Echarts 实例
    const myEchart=echarts.init(document.getElementById("stock"));

    // 将后端数据转换为y轴适配的数据(map->list),定义了一个匿名的异步函数,并立即执行
    (async() => {
      const response = await productApi.stockStatistics();
       Object.entries()函数时,它会将对象的键转换为字符串类型
      for (const [key, value] of Object.entries(response.data)) {
        map.set(key, value);
      }
      return map;
    })().then(()=>{
      seriesData.push({
        // name: '库存',
        type: 'pie',
        data: [],
        radius: '70%',
        label:{
          show:true,
          formatter: `{b}:{c}`,
          position: "outside", //outside 外部显示  inside 内部显示
          // 设置文字样式
          textStyle: {
            color: global.setThemeStyle()
          }
        }
      });

      map.forEach((value:any, key:any) => {
        seriesData[0].data.push({ name: key, value: value });
        // 设置图例
        legendData.push(key);
      });

      // 更新图表配置
      stockOption.series = seriesData;
      stockOption.legend.data = legendData;

      // 绘制图表
      myEchart.setOption(stockOption);
    });
  }

  let returnsOption=reactive({}) as any

  // 4、各产品月销售退货量 折线图
  const drawReturns= async()=>{
    // 配置项
    returnsOption=reactive({
        title: {
          text: '月销售退货量',
          top: 5,
          // 设置文字样式
          textStyle: {
            color: global.setThemeStyle()
          }
        },
        // 设置图例
        legend:{
          data: [],
          top: 10,
          // 设置文字样式
          textStyle: {
            color: global.setThemeStyle()
          }
        },
        tooltip: {
          trigger:"axis", // 坐标轴触发
        },
        xAxis: {
          type: 'category',
          data: [],
          axisLabel: {
            // 设置坐标轴字体颜色
            color: global.setThemeStyle()
          }
        },
        yAxis: {
          // name: '各产品月销量',
          type: 'value',
          axisLabel: {
            // 设置坐标轴字体颜色
            color: global.setThemeStyle()
          }
        },
        // 选中高亮
        emphasis:{
          focus:"series"
        },
        series: []
      });

    // xAxisData 与后端返回的数据适配
    const xAxisData=reactive(['JANUARY', 'FEBRUARY', 'MARCH', 'APRIL', 'MAY', 'JUNE', 'JULY', 'AUGUST', 'SEPTEMBER', 'OCTOBER', 'NOVEMBER', 'DECEMBER']) as any
    // xData 用于前端展示
    const xData=reactive(['1月', '2月', '3月', '4月','5月', '6月', '7月', '8月','9月', '10月', '11月', '12月']) as any

    // series数据
    const seriesData = reactive([]) as any;
    // 图例
    let legendData = reactive([]) as any;


    // 后端返回的map数据
    let map=reactive(new Map()) as any;

    // 初始化 Echarts 实例
    const myEchart=echarts.init(document.getElementById("returns"));

    // 折线图 填充x轴数据
    returnsOption.xAxis.data=xData;

    // 将后端数据转换为y轴适配的数据(map->list),定义了一个匿名的异步函数,并立即执行
    (async() => {
      const response = await returnsApi.statistics(date.value);
       Object.entries()函数时,它会将对象的键转换为字符串类型
      for (const [key, value] of Object.entries(response.data)) {
        map.set(key, value);
      }
      return map;
    })().then(async()=>{
      // 创建一个Promise数组,用于等待所有产品名称的获取
      const promises = Array.from(map.entries()).map(async ([key, value] : any) => {
        const res = await productApi.getNameById(key);
        seriesData.push({
          name: res.data,
          type: 'line',
          smooth: true,
          data: xAxisData.map((month:any) => value[month]),
        });
        // 同时添加到图例数据
        legendData.push(res.data);
      });

      // 等待所有Promise完成
      await Promise.all(promises);

      // 更新图表配置
      returnsOption.series = seriesData;
      returnsOption.legend.data = legendData;

      // 绘制图表
      myEchart.setOption(returnsOption);
    });
  }


  // 监听 global.IS_DARK.value 变化,更新 ECharts 的配置
  watch(()=>global.IS_DARK.value, (newValue:boolean) => {
    draw();
  });

  const draw= ()=>{
    drawSaleVolume();
    drawSaleRevenue();
    drawStock();
    drawReturns();
    getReturnsData();
  }

  onMounted(()=>{
    draw();
  })

</script>

<style scoped lang="less">
  .container{
    height: 100%;
    box-sizing: border-box;
  }
  .header{
    display: flex;
    align-items: center;
    justify-content: space-between;
  }
  .title{
    font-size: large;
    font-weight: 600;
  }

  .mycharts{
    display: flex;
  }

  /* 要设置宽高,否则无法显示 */
  .mychart{
    width: 100%;
    height: 320px;
    border: 1px solid pink;
    margin: 5px;
  }

  .date-picker{
    margin-left: 5px;
    margin-bottom: 5px;
    margin-right: 20px;
  }

  .statistics .el-form .el-form-item .el-input{
    width: 150px;
  }

  .top{
    display: flex;
    justify-content: space-between;
    height: 40px;
  }

</style>
