prometheus
Prometheus 是一个开源的服务监控系统和时序数据库,它提供了通用的数据模型和快捷的数据采集、存储和查询接口。
- 监控和告警框架
- 时序数据库(TSDB)
特点
- 多维数据模型,由指标名称和键/值对标识的时间序列数据。
- 灵活的查询语言 PromQL。
- 不依赖分布式存储,单个服务器节点是自主的。
- 通过基于HTTP的pull方式采集时序数据。
- 可以通过中间网关(Pushgateway)进行时序列数据推送。
- 通过服务发现或者静态配置来发现目标服务对象。
- 支持多种多样的图表和界面展示,比如Grafana等
Grafana:是一个跨平台的开源的度量分析和可视化工具,可以将采集的数据可视化的展示,并及时通知给告警接收方。其官方库中具有丰富的仪表盘插件。
核心组件
- Prometheus Server(用于抓取数据和存储时序数据)
- client libraries(用于对接 Prometheus Server)
- push gateway(用于批量,短期的监控数据的汇总节点)
- exporters(例如 node_exporter, MongoDB exporter 等)(用于各种汇报数据)
- alertmanager(用于告警通知管理)
工作流程
- Prometheus server 定期从配置好的 jobs 或者 exporters 中拉取 metrics,或者接收来自 Pushgateway 发送过来的metrics,或者从其它的 Prometheus server 中拉取 metrics。
- Prometheus server 在本地存储收集到的 metrics,并运行定义好的 alerts.rules,记录新的时间序列或者向 Alert manager 推送警报。
- Alertmanager 根据配置文件,对接收到的警报进行处理,发出告警。
- 在图形界面中,可视化采集数据。
安装prometheus
Go
brew install prometheus启动
brew services start prometheus访问
Go
http://localhost:9090效果

安装grafana
Go
brew install grafana启动
Go
brew services start grafana访问
Go
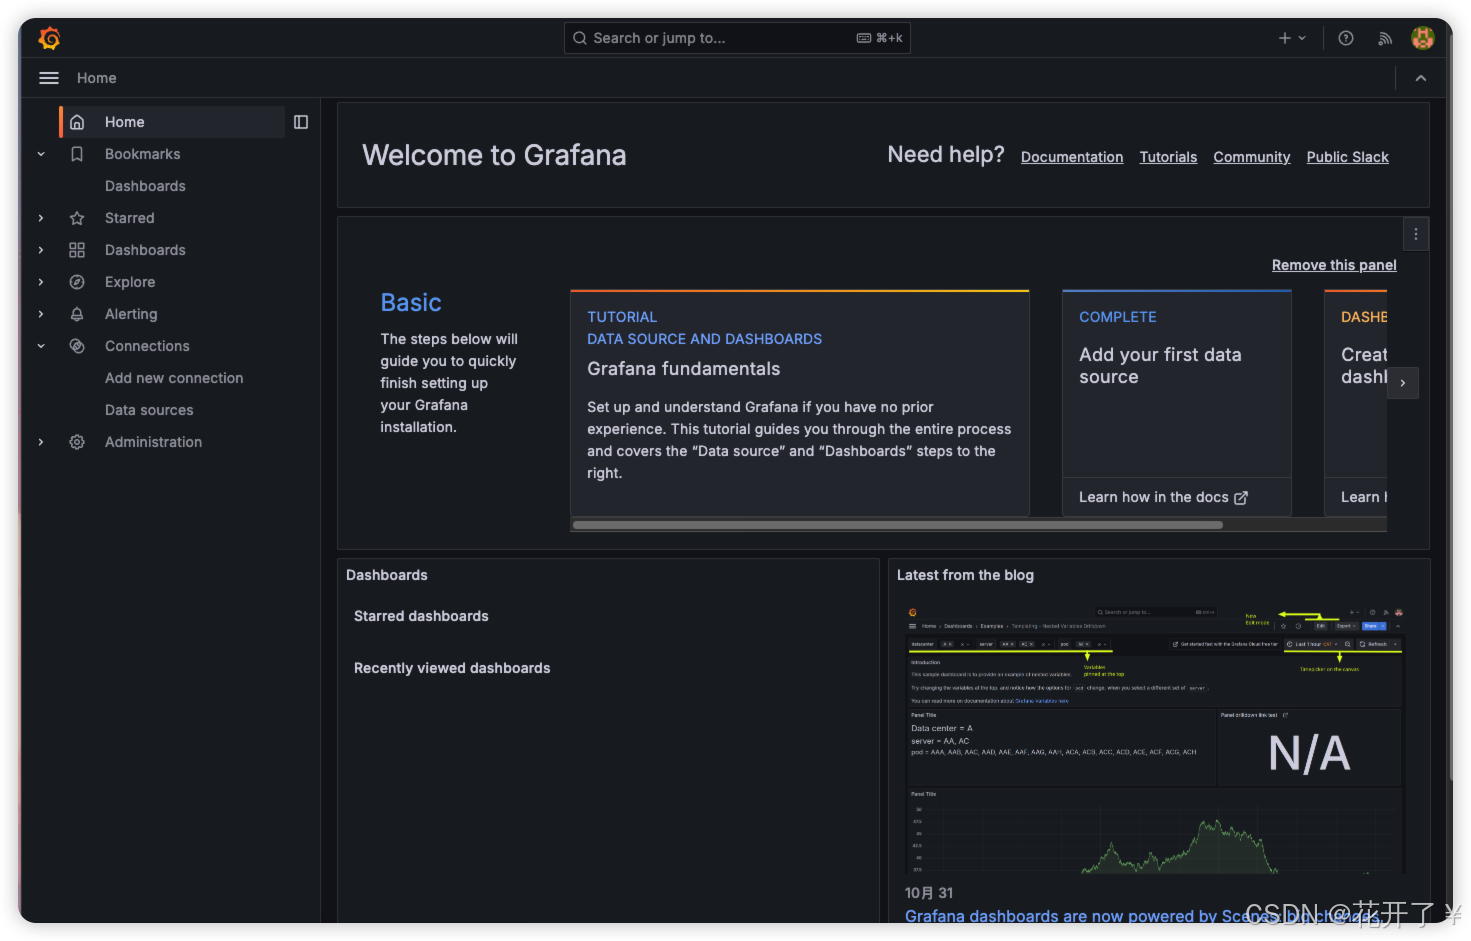
http://localhost:3000效果

默认账号密码:admin/admin
添加prometheus数据源
- Configuration
- Add data source
- Prometheus
- Add HTTP:URL(http://localhost:9090)
- Save&test
Reference
Mac下更新brew及安装Prometheus+Grafana
接入go语言代码测试:监控cpu
Go
package main

import (
	"github.com/prometheus/client_golang/prometheus"
	"github.com/prometheus/client_golang/prometheus/promhttp"
	"log"
	"net/http"
)

type metrics struct {
	cpuTemp    prometheus.Gauge
	hdFailures *prometheus.CounterVec
}

func NewMetrics(reg prometheus.Registerer) *metrics {
	m := &metrics{
		cpuTemp: prometheus.NewGauge(prometheus.GaugeOpts{
			Name: "cpu_temperature_celsius",
			Help: "Current temperature of the CPU.",
		}),
		hdFailures: prometheus.NewCounterVec(
			prometheus.CounterOpts{
				Name: "hd_errors_total",
				Help: "Number of hard-disk errors.",
			},
			[]string{"device"},
		),
	}
	reg.MustRegister(m.cpuTemp)
	reg.MustRegister(m.hdFailures)
	return m
}

func main() {
	// Create a non-global registry.
	reg := prometheus.NewRegistry()

	// Create new metrics and register them using the custom registry.
	m := NewMetrics(reg)
	// Set values for the new created metrics.
	m.cpuTemp.Set(65.3)
	m.hdFailures.With(prometheus.Labels{"device": "/dev/sda"}).Inc()

	// Expose metrics and custom registry via an HTTP server
	// using the HandleFor function. "/metrics" is the usual endpoint for that.
	http.Handle("/metrics", promhttp.HandlerFor(reg, promhttp.HandlerOpts{Registry: reg}))
	log.Fatal(http.ListenAndServe(":8080", nil))
}
运行效果

实际使用:
Prometheus的数据模型
指标名称 标签 时间戳 值
Prometheus 存储的是时序数据, 即按照相同时序(相同的名字和标签),以时间维度存储连续的数据的集合。Prometheus 中,每个时间序列都由指标名称(Metric Name)和标签(Label)来唯一标识格式为:{=,...}
(1)指标名称:通常用于描述系统上要测定的某个特征,例如
Go
prometheus_http_requests_total表示接收到的HTTP请求总数(2)标签:键值型数据,附加在指标名称之上,从而让指标能够支持多纬度特征;可选项
Go
// 代表着两个不同的时间序列
prometheus_http_requests_total{code="200"}

prometheus_http_requests_total{code="302"}
双下划线的标签是Prometheus系统默认标签,是不会显示在/metrics页面里面的;
系统默认标签在target页面中也是不显示的,需要鼠标放到Labels字段上才会显示。
Go
 // 常见的系统默认标签
__address:当前target 实例的套接字地址:

__scheme:采集当前target 上指标数据时使用的协议(http或https)

__metrics_path:采集当前target 上的指标数据时使用URI路径,默认为/metrics

___param:传递的URL参数中第一个名称为的参数的值

__name:此标签是标识指标名称的预留标签,能够使用标签选择器对指标名称进行过滤
(3)时序样本
按照某个时序以时间维度采集的数据,称之为样本,其值包含:
一个 float64 值 和 一个毫秒级的 unix 时间戳
格式及命名要求
Prometheus 时序格式与 OpenTSDB 相似,其中包含时序指标名字以及时序的标签:
<metric name>{<label name>=<label value>, ...}
例:指标名称为 api_http_requests_total 和的时间序列标签为method="POST" 和 handler="/messages"
api_http_requests_total{method="POST", handler="/messages"}
注:Prometheus监控指标名称和标签名称可以包含ASCII字母、数字、下划线和冒号。它必须匹配正则表达式 [a-zA-Z_:][a-zA-Z0-9_:]*
Metrics指标类型
(1)Counter
计数器,单调地表示单个的累积度量递增计数器,值只能在重启时增加或重置为零。从0开始不断累加计算,正常情况下是只能一直增长,不会降低。(例如累积访问量)
通常,Counter 的总数并没有直接作用,而是需要借助于 rate、topk、increase 和 irate 等函数来生成样本数据的变化状况(增长率)
rate(prometheus_http_requests_total[1h])
获取 1 小内,该指标下各时间序列上的 http 总请求数的增长速率
irate(prometheus_http_requests_total[1h])
irate 为高灵敏度函数,用于计算指标的瞬时速率,基于样本范围内的最后两个样本进行计算,相较于 rate 函数来说,irate 更适用于短期时间范围内的变化速率分析。
(2)Gauge
仪表盘,1个简单的返回值,可以上下浮动的"计数",没有规律变化的值。(例如CPU使用率、队列数)
Gauge 用于存储其值可增可减的指标的样本数据,常用于进行求和、取平均值、最小值、最大值等聚合计算;也会经常结合 PromQL 的 delta 和 predict_linear 函数使用
delta(cpu_temp_celsius{host="node01"}[2h])
返回该服务器上的CPU温度与2小时之前的差异
predict_linear(node_filesystem_free{job="node"}[2h], 4 * 3600)
基于 2 小时的样本数据,来预测主机可用磁盘空间在 4 个小时之后的剩余情况
(3)Histogram
直方图,将时间范围内的数据划分成不同的时间段,并各自评估其样本个数及样本值之和,因而可计算出分位数。( 可用于分析因异常值而引起的平均值过大的问题;分位数计算要使用专用的 histogram_quantile 函数;)
对于 Prometheus 来说,Histogram 会在一段时间范围内对数据进行采样(通常是请求持续时长或响应大小等),并将其计入可配置的 bucket(存储桶)中 ,后续可通过指定区间筛选样本,也可以统计样本总数,最后一般将数据展示为直方图。
Prometheus 取值间隔的划分采用的是累积区间间隔机制,即每个 bucket 中的样本均包含了其前面所有 bucket 中的样本,因而也称为累积直方图。
Histogram 类型的每个指标有一个基础指标名称 ,它会提供多个时间序列:
- _sum :所有样本值的总和
- _count :总的采样次数,它自身本质上是一个 Counter 类型的指标
- _bucket{le="<上边界>"} :观测桶的上边界,即样本统计区间,表示样本值小于等于上边界的所有样本数量
- _bucket{le="+Inf"} :最大区间(包含所有样本)的样本数量
例如,统计延迟在 0~10 ms 之间的请求数有多少,而 10~20 ms 之间的请求数又有多少。通过这种方式可以快速分析系统慢的原因。Histogram和Summary都是为了能够解决这样问题的存在,通过 Histogram 和 Summary 类型的监控指标,我们可以快速了解监控样本的分布情况。
http 请求响应时间 <= 0.005 秒 的请求次数为 10
prometheus_http_request_duration_seconds_bucket{handler="/metrics",le="0.005"} 10
http 请求响应时间 <= 0.01 秒 的请求次数为 15
prometheus_http_request_duration_seconds_bucket{handler="/metrics",le="0.01"} 15
http 请求响应时间 <= 0.025 秒 的请求次数为 18
prometheus_http_request_duration_seconds_bucket{handler="/metrics",le="0.025"} 18
prometheus_http_request_duration_seconds_bucket{handler="/metrics",le="0.05"} 18
所有样本值的大小总和,命名为 _sum
prometheus_http_request_duration_seconds_sum{handler="/metrics"} 10.107670803000001
样本总数,命名为 _count ,效果与 _bucket{le="+Inf"} 相同
prometheus_http_request_duration_seconds_count{handler="/metrics"} 20
注意:
bucket 可以理解为是对数据指标值域的一个划分,划分的依据应该基于数据值的分布。注意后面的样本是包含前面的样本,假设
prometheus_http_request_duration_seconds_bucket{...,le="0.01"} 的值为 10
prometheus_http_request_duration_seconds_bucket{...,le="0.05"} 的值为 30
那么意味着这 30 个样本中,有 10 个是小于 0.01s 的,其余 20 个采样点的响应时间是介于 0.01s 和 0.05s 之间的。
累积间隔机制生成的样本数据需要额外使用内置的 histogram_quantile 函数即可根据 Histogram 指标来计算相应的分位数(quantile),即某个 bucket 的样本数在所有样本数中占据的比例。
●histogram_quantile 函数在计算分位数时会假定每个区间内的样本满足线性分布状态,因而它的结果仅是一个预估值,并不完全准确
●预估的准确度取决于bucket区间划分的粒度;粒度越大,准确度越低
例如,假设 http 请求响应时间的样本的 9 分位数(quantile=0.9)的上边界为 0.01,即表示小于等于 0.01 的样本值的数量占总体样本值的 90%
histogram_quantile(prometheus_http_request_duration_seconds_bucket{handler="/metrics",le="0.01"}) 0.9
(4)Summary
概略图,类似于 Histogram,但会在客户端直接计算并上报分位数;
Histogram 在客户端仅是简单的桶划分和分桶计数,分位数计算由 Prometheus Server 基于样本数据进行估算,因而其结果未必准确,甚至不合理的 bucket 划分会导致较大的误差。
Summary 是一种类似于 Histogram 的指标类型,但它在客户端于一段时间内(默认为 10 分钟)的每个采样点进行统计,计算并存储了分位数数值,Server 端直接抓取相应值即可。
对于每个指标,Summary 以指标名称 为前缀,生成如下几个指标序列:
- _sum :统计所有样本值之和
- _count :统计所有样本总数
- {quantile="x"} :统计样本值的分位数分布情况,分位数范围:0 ≤ x ≤ 1
示例:
prometheus_tsdb_wal_fsync_duration_seconds{quantile="0.5"} 0.012352463
prometheus_tsdb_wal_fsync_duration_seconds{quantile="0.9"} 0.014458005
prometheus_tsdb_wal_fsync_duration_seconds{quantile="0.99"} 0.017316173
prometheus_tsdb_wal_fsync_duration_seconds_sum 2.888716127000002
prometheus_tsdb_wal_fsync_duration_seconds_count 216
从上面的样本中可以得知当前Promtheus Server进行 wal_fsync 操作的总次数为 216 次,耗时 2.888716127000002s。 其中中位数(quantile=0.5)的耗时为 0.012352463s,9分位数(quantile=0.9)的耗时为0.014458005s。
Histogram 与 Summary 的异同:
它们都包含了 _sum 和 _count 指标,Histogram 需要通过 _bucket 来计算分位数,而 Summary 则直接存储了分位数的值。
总结图
