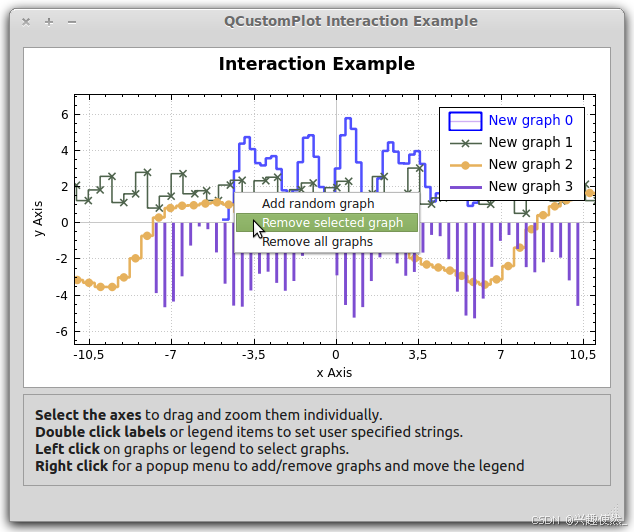
本文是官方例子的分析: Interaction Example
推荐笔记: qcustomplot使用教程--基本绘图
推荐笔记: 4.QCustomPlot使用-坐标轴常用属性
- 官方例子需要用到很多槽函数, 这里先一次性列举, 自行加入到
qt的.h中.下面开始从简单的开始一个个分析.
cpp
    void qcustomplot_main_init(void);       // 初始化
    void titleDoubleClick(QMouseEvent* event); // 标题 双击
    void axisLabelDoubleClick(QCPAxis *axis, QCPAxis::SelectablePart part); // 标签 双击
    void legendDoubleClick(QCPLegend *legend, QCPAbstractLegendItem *item); // 图例 双击
    void selectionChanged(void);            // 选择已更改
    void mousePress(void);                  // 鼠标按下
    void mouseWheel(void);                  // 鼠标滚轮
    void addRandomGraph(void);              // 添加随机图
    void removeSelectedGraph(void);         // 删除选定图形
    void removeAllGraphs(void);             // 删除所有图形
    void contextMenuRequest(QPoint pos);    // 上下文菜单请求
    void moveLegend(void);                  // 移动图例
    void graphClicked(QCPAbstractPlottable *plottable, int dataIndex); // 图表点击
1.图表点击
cpp
// 图表点击
void MainWindow::graphClicked(QCPAbstractPlottable *plottable, int dataIndex)
{
    //由于我们知道图中只有QCPG图,我们可以立即访问interface1D()
    //通常最好先检查interface1D()是否返回非零,然后再使用它。

    // plottable 表示绘图中对象的所有数据的抽象基类。更多。。。

    // 如果此plottable是一维plottable,即它实现了QCPPlottableInterface1D,则返回具有该类型的this指针。否则(例如在QCPColorMap的情况下)返回零。
    // interface1D() 您可以使用此方法获得对数据坐标的读取权限,同时只持有指向抽象基类的指针。

    // dataMainValue() 返回给定索引处数据点的主值。 主要值是什么,由plottable的数据类型定义。

    double dataValue = plottable->interface1D()->dataMainValue(dataIndex);
    QString message = QString("Clicked on graph '%1' at data point #%2 with value %3.").arg(plottable->name()).arg(dataIndex).arg(dataValue);
    // ui->statusBar->showMessage(message, 2500);
    qDebug() << message;
}- 当鼠标点击图标中的曲线时, 会回调该函数, 函数内可以获取曲线的名称和数据等. 并打印出最近的点坐标. 如果之后要显示文本游标,可以在这里显示;
2.移动图例
cpp
// 图像 移动图例
void MainWindow::moveLegend(void)
{
    QCustomPlot * customPlot = ui->customPlot;

    // 确保此插槽确实由上下文菜单操作调用,以便它携带我们需要的数据
    if (QAction* contextAction = qobject_cast<QAction*>(sender())) // 通过上下文菜单传入
    {
        bool ok;
        int dataInt = contextAction->data().toInt(&ok); // 获取传入的参数
        if (ok) // 数据解析正确, 这里应该添加确保位置枚举正确
        {
            customPlot->axisRect()->insetLayout()->setInsetAlignment(0, static_cast<Qt::Alignment>(dataInt)); // 设置图例的位置
            customPlot->replot(); // 重绘图像
        }
    }
}- 这个函数是用于移动图例时调用, 在右键菜单中点击选项后调用.
3.右键菜单/上下文菜单请求
cpp
// 图像 上下文菜单请求
void MainWindow::contextMenuRequest(QPoint pos)
{
    QCustomPlot * customPlot = ui->customPlot;

    QMenu *menu = new QMenu(this);              // 创建一个菜单
    menu->setAttribute(Qt::WA_DeleteOnClose);   // 当小部件接受关闭事件时,使Qt删除此小部件

    if (customPlot->legend->selectTest(pos, false) >= 0) // 请求图例的上下文菜单, 调用了上一个移动图例函数
    {
        menu->addAction("Move to top left", this, SLOT(moveLegend()))->setData(static_cast<int>(Qt::AlignTop|Qt::AlignLeft));           // 移动图例到左上角
        menu->addAction("Move to top center", this, SLOT(moveLegend()))->setData(static_cast<int>(Qt::AlignTop|Qt::AlignHCenter));      // 移动图例到中上角
        menu->addAction("Move to top right", this, SLOT(moveLegend()))->setData(static_cast<int>(Qt::AlignTop|Qt::AlignRight));         // 移动图例到右上角
        menu->addAction("Move to bottom right", this, SLOT(moveLegend()))->setData(static_cast<int>(Qt::AlignBottom|Qt::AlignRight));   // 移动图例到左下角
        menu->addAction("Move to bottom left", this, SLOT(moveLegend()))->setData(static_cast<int>(Qt::AlignBottom|Qt::AlignLeft));     // 移动图例到右下角
    }
    else  // 所需图形上的通用上下文菜单
    {
        menu->addAction("Add random graph", this, SLOT(addRandomGraph()));                  // 添加一条曲线
        if (customPlot->selectedGraphs().size() > 0)                                        // 如果选择的曲线数量大于0
            menu->addAction("Remove selected graph", this, SLOT(removeSelectedGraph()));    // 删除曲线
        if (customPlot->graphCount() > 0)                                                   // 如果全部曲线数量大于0
            menu->addAction("Remove all graphs", this, SLOT(removeAllGraphs()));            // 删除所有曲线
    }

    // 将小部件坐标pos转换为全局屏幕坐标。例如,mapToGlobal(QPoint(0,0))将给出小部件左上角像素的全局坐标。
    // 显示菜单,使动作atAction位于指定的全局位置p。要将小部件的局部坐标转换为全局坐标,
    menu->popup(customPlot->mapToGlobal(pos));
}- 在图像内右键时调用, 设定弹出的上下文菜单.
- 先是判断点击位置是否在图例内, 如果是就弹出图例菜单, 否者就弹出曲线菜单;注意
- 注意选择 菜单后调用的函数,传参的方法.
4.删除所有曲线
cpp
// 图像 删除所有图形
void MainWindow::removeAllGraphs()
{
    QCustomPlot * customPlot = ui->customPlot;

    customPlot->clearGraphs();  // 删除所有曲线, 坐标轴等内容是保留的
    customPlot->replot();       // 重绘图像
}- 注意是删除所有
graphs,我发现其他例子中貌似有些曲线不算graphs;
5.删除选择曲线
cpp
// 图像 删除选定图形
void MainWindow::removeSelectedGraph()
{
    QCustomPlot * customPlot = ui->customPlot;

    if (customPlot->selectedGraphs().size() > 0) // 选择的曲线数量大于0
    {
        customPlot->removeGraph(customPlot->selectedGraphs().first()); // 删除特定的曲线, 选择曲线列表中的第一条
        customPlot->replot(); // 重绘图像
    }
}
6.添加随机曲线
cpp
// 图像 添加图像
void MainWindow::addRandomGraph()
{
    QCustomPlot * customPlot = ui->customPlot;

    int n = 50; // 图中的点数
    double xScale = (rand()/static_cast<double>(RAND_MAX) + 0.5)*2;
    double yScale = (rand()/static_cast<double>(RAND_MAX) + 0.5)*2;
    double xOffset = (rand()/static_cast<double>(RAND_MAX) - 0.5)*4;
    double yOffset = (rand()/static_cast<double>(RAND_MAX) - 0.5)*10;
    double r1 = (rand()/static_cast<double>(RAND_MAX) - 0.5)*2;
    double r2 = (rand()/static_cast<double>(RAND_MAX) - 0.5)*2;
    double r3 = (rand()/static_cast<double>(RAND_MAX) - 0.5)*2;
    double r4 = (rand()/static_cast<double>(RAND_MAX) - 0.5)*2;
    QVector<double> x(n), y(n);
    for (int i=0; i<n; i++)
    {
        x[i] = (i/static_cast<double>(n)-0.5)*10.0*xScale + xOffset;
        y[i] = (qSin(x[i]*r1*5)*qSin(qCos(x[i]*r2)*r4*3)+r3*qCos(qSin(x[i])*r4*2))*yScale + yOffset;
    }

    customPlot->addGraph(); // 添加曲线
    customPlot->graph()->setName(QString("New graph %1").arg(customPlot->graphCount()-1)); // 设置曲线图例名字
    customPlot->graph()->setData(x, y); // 设置数据
    customPlot->graph()->setLineStyle(static_cast<QCPGraph::LineStyle>(rand()%5+1)); // 设置曲线类型
    if (rand()%100 > 50)
        customPlot->graph()->setScatterStyle(QCPScatterStyle(static_cast<QCPScatterStyle::ScatterShape>(rand()%14+1))); // 设置点的类型
    QPen graphPen;
    graphPen.setColor(QColor(rand()%245+10, rand()%245+10, rand()%245+10)); // 设置颜色
    graphPen.setWidthF(rand()/static_cast<double>(RAND_MAX)*2+1); // 设置粗细
    customPlot->graph()->setPen(graphPen); // 设置线的颜色等
    customPlot->replot(); // 重绘
}- 这就是添加一些随机数据然后显示.设置了图线的显示样式;
7.鼠标滚轮缩放图像
cpp
// 图像 鼠标滚轮
void MainWindow::mouseWheel()
{
    QCustomPlot * customPlot = ui->customPlot;

    //如果选择了一个轴,则只允许缩放该轴的方向
    //如果未选择轴,则可以缩放两个方向

    if (customPlot->xAxis->selectedParts().testFlag(QCPAxis::spAxis))               // 如果选择了坐标轴
        customPlot->axisRect()->setRangeZoom(customPlot->xAxis->orientation());     // 只缩放一个坐标轴
    else if (customPlot->yAxis->selectedParts().testFlag(QCPAxis::spAxis))          // 如果选择了坐标轴
        customPlot->axisRect()->setRangeZoom(customPlot->yAxis->orientation());     // 只缩放一个坐标轴
    else
        customPlot->axisRect()->setRangeZoom(Qt::Horizontal|Qt::Vertical);          // 同时缩放两个坐标轴
}- 通过点击坐标来判断选择坐标轴的缩放,非常好的思路,就是不太习惯;
8.鼠标按下移动图像
cpp
// 图像 鼠标被按下
void MainWindow::mousePress()
{
    QCustomPlot * customPlot = ui->customPlot;

    //如果选择了轴,则只允许拖动该轴的方向
    //如果未选择轴,则可以拖动两个方向

    if (customPlot->xAxis->selectedParts().testFlag(QCPAxis::spAxis))                 // 如果选择了坐标轴
        customPlot->axisRect()->setRangeDrag(customPlot->xAxis->orientation());       // 只移动一个坐标轴
    else if (customPlot->yAxis->selectedParts().testFlag(QCPAxis::spAxis))            // 如果选择了坐标轴
        customPlot->axisRect()->setRangeDrag(customPlot->yAxis->orientation());       // 只移动一个坐标轴
    else
        customPlot->axisRect()->setRangeDrag(Qt::Horizontal|Qt::Vertical);            // 同时移动两个坐标轴
}
9.选择坐标轴或图例或曲线
cpp
// 图像 选择被修改
void MainWindow::selectionChanged(void)
{
    QCustomPlot * customPlot = ui->customPlot;

    /*
    通常,坐标轴基线、坐标轴刻度标签和坐标轴标签是可以单独选择的,但我们希望用户只能将整个坐标轴作为一个整体来选择,因此我们将刻度标签和坐标轴基线的选中状态绑定在一起。然而,坐标轴标签仍然可以单独选择。

    左侧和右侧坐标轴的选中状态应该同步,底部和顶部坐标轴的选中状态也应该同步。

    此外,我们希望将图形的选中状态与其对应的图例项的选中状态同步。这样,用户既可以通过点击图形本身来选择图形,也可以通过点击其图例项来选择图形。
    */

    //使上下轴同步选择,并将轴和刻度标签作为一个可选对象处理:
    if (customPlot->xAxis->selectedParts().testFlag(QCPAxis::spAxis) || customPlot->xAxis->selectedParts().testFlag(QCPAxis::spTickLabels) ||
        customPlot->xAxis2->selectedParts().testFlag(QCPAxis::spAxis) || customPlot->xAxis2->selectedParts().testFlag(QCPAxis::spTickLabels))
    {
        customPlot->xAxis2->setSelectedParts(QCPAxis::spAxis|QCPAxis::spTickLabels); // 如果其中一边坐标轴被选择, 那另一边的坐标轴也被同步选择
        customPlot->xAxis->setSelectedParts(QCPAxis::spAxis|QCPAxis::spTickLabels);
    }

    //使左右轴同步选择,并将轴和刻度标签作为一个可选对象处理:
    if (customPlot->yAxis->selectedParts().testFlag(QCPAxis::spAxis) || customPlot->yAxis->selectedParts().testFlag(QCPAxis::spTickLabels) ||
        customPlot->yAxis2->selectedParts().testFlag(QCPAxis::spAxis) || customPlot->yAxis2->selectedParts().testFlag(QCPAxis::spTickLabels))
    {
        customPlot->yAxis2->setSelectedParts(QCPAxis::spAxis|QCPAxis::spTickLabels); // 如果其中一边坐标轴被选择, 那另一边的坐标轴也被同步选择
        customPlot->yAxis->setSelectedParts(QCPAxis::spAxis|QCPAxis::spTickLabels);
    }

    //将图形的选择与相应图例项的选择同步:
    for (int i=0; i<customPlot->graphCount(); ++i)
    {
        QCPGraph *graph = customPlot->graph(i); // 获取图像对象
        QCPPlottableLegendItem *item = customPlot->legend->itemWithPlottable(graph); // 获取图例对象
        if (item->selected() || graph->selected()) // 如果图例或图像被选择, 就同步两个都被选择
        {
            item->setSelected(true);
            graph->setSelection(QCPDataSelection(graph->data()->dataRange()));
        }
    }
}- 用于同步选择对象, 选择了一边坐标轴就同时设置另一边也被选择.图例和曲线同理;
- 注意函数的调用,暂时无法理解的话就照抄微改;
10.双击图例修改名字
cpp
// 图像 图例双击
void MainWindow::legendDoubleClick(QCPLegend *legend, QCPAbstractLegendItem *item)
{
    QCustomPlot * customPlot = ui->customPlot;

    //双击图例项重命名图形
    Q_UNUSED(legend) // 消除报错
    if (item) //仅当项目被点击时才会做出反应(用户本可以在没有项目的地方点击图例的边框填充,则项目为0)
    {
        QCPPlottableLegendItem *plItem = qobject_cast<QCPPlottableLegendItem*>(item); // 对象类型转换
        bool ok;
        QString newName = QInputDialog::getText(this, "QCustomPlot example", "New graph name:", QLineEdit::Normal, plItem->plottable()->name(), &ok); // 使用弹窗获取文本
        if (ok) // 获取成功
        {
            plItem->plottable()->setName(newName); // 重新设置图例名字
            customPlot->replot(); // 重绘图像
        }
    }
}- 注意函数调用,其他不赘述了;
11.双击坐标轴修改名字
cpp
// 图像 标签双击
void MainWindow::axisLabelDoubleClick(QCPAxis *axis, QCPAxis::SelectablePart part)
{
    QCustomPlot * customPlot = ui->customPlot;

    // Set an axis label by double clicking on it
    if (part == QCPAxis::spAxisLabel) // only react when the actual axis label is clicked, not tick label or axis backbone
    {
        bool ok;
        QString newLabel = QInputDialog::getText(this, "QCustomPlot example", "New axis label:", QLineEdit::Normal, axis->label(), &ok);
        if (ok)
        {
            axis->setLabel(newLabel);
            customPlot->replot();
        }
    }
}- 注意函数调用,和上一个功能类似,其他不赘述了;
12.双击标题修改名字
cpp
// 图像 标题双击
void MainWindow::titleDoubleClick(QMouseEvent* event)
{
    QCustomPlot * customPlot = ui->customPlot;

    Q_UNUSED(event)
    if (QCPTextElement *title = qobject_cast<QCPTextElement*>(sender()))
    {
        // Set the plot title by double clicking on it
        bool ok;
        QString newTitle = QInputDialog::getText(this, "QCustomPlot example", "New plot title:", QLineEdit::Normal, title->text(), &ok);
        if (ok)
        {
            title->setText(newTitle);
            customPlot->replot();
        }
    }
}- 注意函数调用,和上一个功能类似,其他不赘述了;
13.初始化图表内容
cpp
// 图像 初始化
void MainWindow::qcustomplot_main_init(void)
{
    QCustomPlot * customPlot = ui->customPlot; // 方便调用

    customPlot->setInteractions(QCP::iRangeDrag | QCP::iRangeZoom | QCP::iSelectAxes | QCP::iSelectLegend | QCP::iSelectPlottables); // 允许拖动,缩放,选择坐标轴,选择图例,选择曲线;
    customPlot->xAxis->setRange(-8, 8);         // 设置初始范围
    customPlot->yAxis->setRange(-5, 5);         // 设置初始范围
    customPlot->axisRect()->setupFullAxesBox(); // 相当于开启右和上的坐标轴, 方便功能,在每侧创建一个还没有轴的轴,并将其可见性设置为true。此外,顶部/右侧轴被分配了底部/左侧轴的以下属性:

    customPlot->plotLayout()->insertRow(0);     // 插入一行?
    QCPTextElement *title = new QCPTextElement(customPlot, "Interaction Example", QFont("sans", 17, QFont::Bold));
    customPlot->plotLayout()->addElement(0, 0, title); // 在上面插入的那一行中? 添加标题

    customPlot->xAxis->setLabel("x Axis"); // 设置坐标轴名字
    customPlot->yAxis->setLabel("y Axis");
    customPlot->legend->setVisible(true); // 显示图例
    QFont legendFont = font();
    legendFont.setPointSize(10); // 设置字体大小
    customPlot->legend->setFont(legendFont);  // 设置字体
    customPlot->legend->setSelectedFont(legendFont); // 设置选择后的字体
    customPlot->legend->setSelectableParts(QCPLegend::spItems); // 图例框不可选择,只能选择图例项

    addRandomGraph(); // 添加随机曲线
    addRandomGraph();
    addRandomGraph();
    addRandomGraph();
    customPlot->rescaleAxes(); // 自适应坐标轴范围

    // 连接将某些轴选择连接在一起的插槽(特别是相对的轴):
    connect(customPlot, SIGNAL(selectionChangedByUser()), this, SLOT(selectionChanged())); // 选择时调用
    // 连接插槽时,请注意在选择轴时,只能拖动和缩放该方向:
    connect(customPlot, SIGNAL(mousePress(QMouseEvent*)), this, SLOT(mousePress())); // 缩放时调用
    connect(customPlot, SIGNAL(mouseWheel(QWheelEvent*)), this, SLOT(mouseWheel())); // 拖动时调用

    // 使底部和左侧轴将其范围转移到顶部和右侧轴:
    connect(customPlot->xAxis, SIGNAL(rangeChanged(QCPRange)), customPlot->xAxis2, SLOT(setRange(QCPRange))); // 同步显示范围
    connect(customPlot->yAxis, SIGNAL(rangeChanged(QCPRange)), customPlot->yAxis2, SLOT(setRange(QCPRange)));

    //连接一些交互插槽:
    connect(customPlot, SIGNAL(axisDoubleClick(QCPAxis*,QCPAxis::SelectablePart,QMouseEvent*)), this, SLOT(axisLabelDoubleClick(QCPAxis*,QCPAxis::SelectablePart))); // 双击时修改
    connect(customPlot, SIGNAL(legendDoubleClick(QCPLegend*,QCPAbstractLegendItem*,QMouseEvent*)), this, SLOT(legendDoubleClick(QCPLegend*,QCPAbstractLegendItem*)));
    connect(title, SIGNAL(doubleClicked(QMouseEvent*)), this, SLOT(titleDoubleClick(QMouseEvent*)));

    //当单击图形时,连接插槽会在状态栏中显示一条消息:
    connect(customPlot, SIGNAL(plottableClick(QCPAbstractPlottable*,int,QMouseEvent*)), this, SLOT(graphClicked(QCPAbstractPlottable*,int)));

    //为上下文菜单弹出设置策略和连接槽:
    customPlot->setContextMenuPolicy(Qt::CustomContextMenu); // 小部件如何显示上下文菜单
    connect(customPlot, SIGNAL(customContextMenuRequested(QPoint)), this, SLOT(contextMenuRequest(QPoint)));
}- 初始化内容, 设置初始的允许操作,设置初始化的图例, 添加初始化的曲线,连接交互用的槽函数;
- 注意拖动和缩放的交互是如何实现的.
14.总结
- 至此已经能实现一些基本的交互和操作, 接下来就是显示游标和文字.