一、Jmeter自带插件监控
下载地址:https://jmeter-plugins.org/install/Install/
安装:下载后文件为jmeter-plugins-manager-1.3.jar,将其放入jmeter安装目录下的lib/ext目录,然后重启jmeter,即可。
启动Jmeter,测试计划-->选择监听器jp@gc - Transactions per Second 、jp@gc - Response Times Over Time,测试接口性能
jp@gc - Transactions per Second ,接口的TPS

jp@gc - Response Times Over Time ,接口响应时间
二、Jmeter非GUI方式监控
cmd窗口执行非GUI方式: jmeter -n -t api.jmx -l \report\jtl -e -o \report\html


三、Jmeter+Influxdb+Grafana平台监控
1、背景
测试人员用Jmeter工具对相应的接口做负载测试和性能测试时,可以帮助我们发现应用程序中的性能瓶颈,但是Jmeter本身的聚合报告存在一些缺点,例如只能自己查看,无法实时共享,以及报告信息展示比较单一,不直观。
2、引入Grafana+Influxdb的作用及原理
2-1、grafana和Influxdb可以解决这个问题,grafana是一款采用Go语言编写的开源应用,主要用于大规模指标数据的可视化展示,Influxdb是一款时序性数据库,有时间戳组件,时间的方式去存储数据。
2-2、原理图
性能监控平台搭建中,可以将Jmeter获取的性能结果导入InfluxDB,再使用Grafana从InfluxDB中获取数据,用特定的模板进行展示,从而实现性能监控过程的可视化。
3、环境与配置
4、Influxdb数据库下载,启动,操作
4-1、下载Influxdb安装包(Influxdb2.0)
root@centos7 tools# wget https://dl.influxdata.com/influxdb/releases/influxdb-1.8.0_linux_amd64.tar.gz
4-2、解压Influxdb
root@centos7 tools# tar -xzvf influxdb-1.8.0_linux_amd64.tar.gz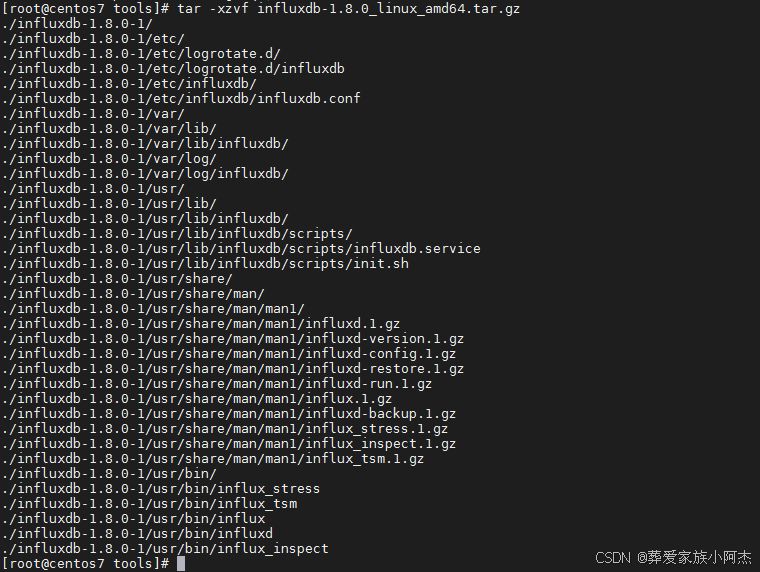
4-3、添加环境变量
root@centos7 tools# sudo ./influxdb/usr/bin/influxd /usr/local/bin/
4-4、启动Influxd
添加环境变量后,Influxd可以在任意目录下启动。默认启动的端口为8086
可以带配置启动:root@centos7 bin# ./influxd -config /home/tools/influxdb/etc/influxdb/influxdb.conf &
4-5、 添加数据库及配置
创建Jmeter数据库。--> Jmeter 数据存储到这里。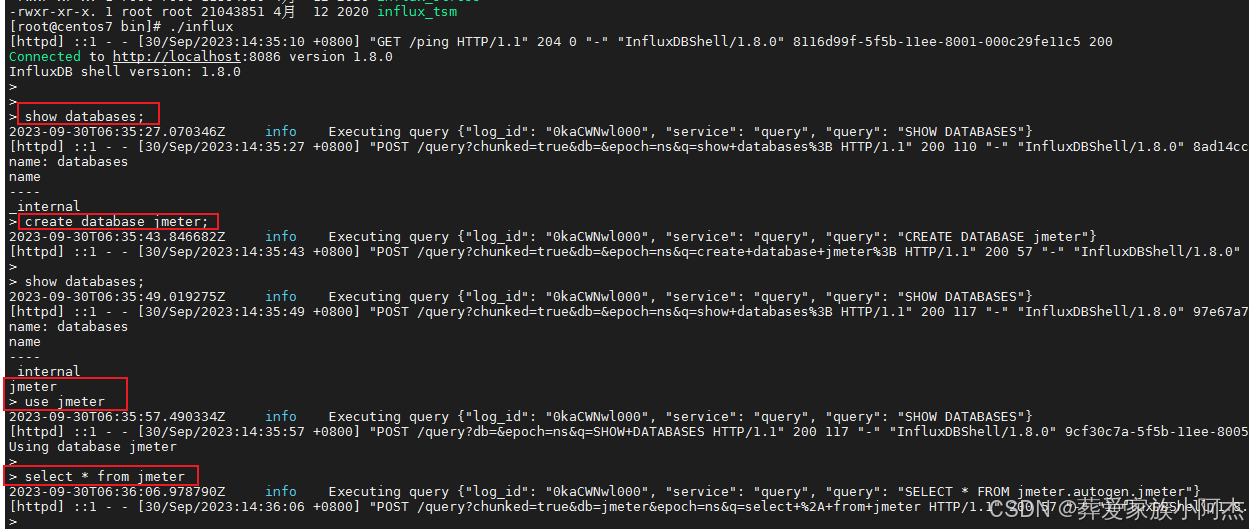
5、Grafana平台下载,启动及配置
5-1、下载Grafana安装包(版本:9.4.9)
root@centos71 tools# wget https://dl.grafana.com/enterprise/release/grafana-enterprise-9.4.9.linux-amd64.tar.gz
5-2、解压Grafana
root@centos71 tools# tar -xzvf grafana-enterprise-9.4.9.linux-amd64.tar.gz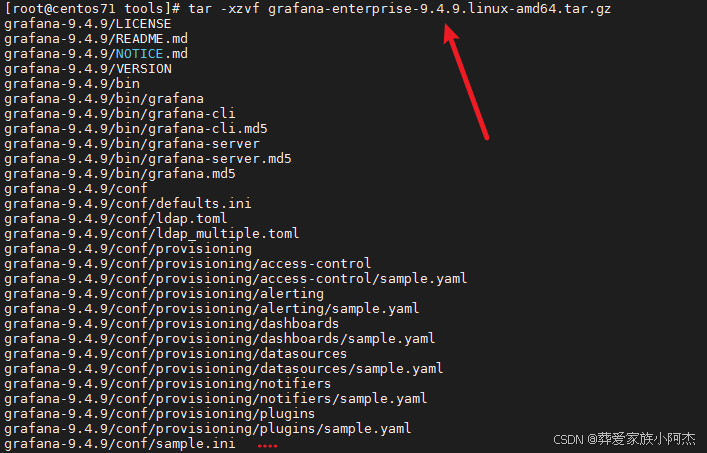
5-3、启动Grafana
默认端口为:3000,如果修改默认端口的话,进入grafana/conf;
root@centos71 conf# vi defaults.ini
修改 http_port = 8000,保存defaults.ini文件
root@centos71 bin# ./grafana-server &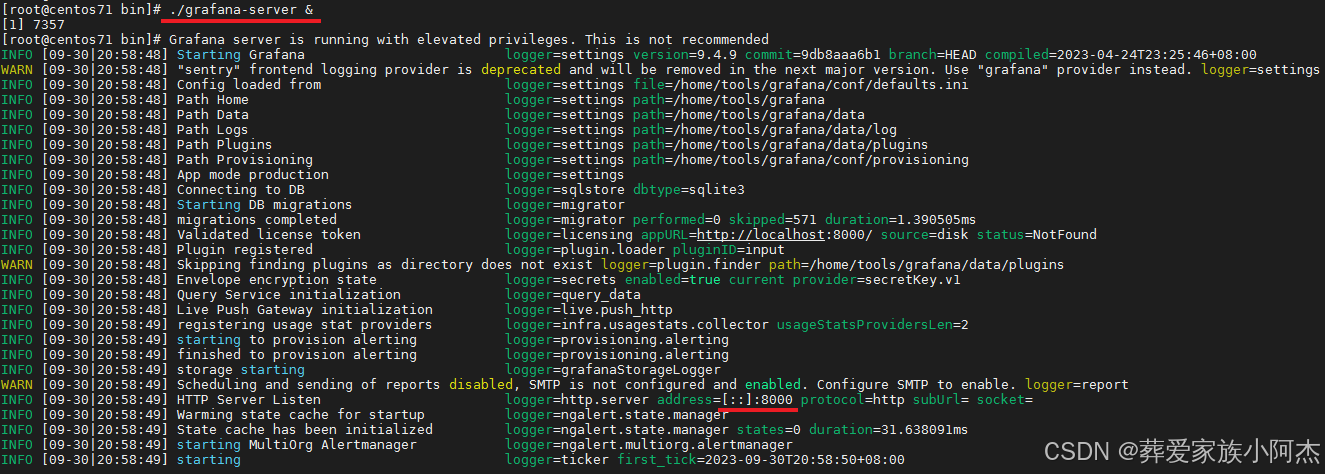

浏览器打开:http://192.168.124.130:8000/,如果打不开排查下是否Linux的防火墙是否打开,如果打开的话,我们直接关闭防火墙
root@centos71 bin# systemctl status firewalld ---查看防火墙状态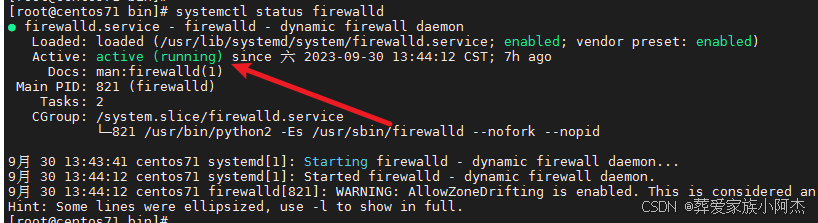
root@centos71 bin# systemctl stop firewalld ---关闭防火墙
打开后的页面,Grafana默认账号密码为admin / admin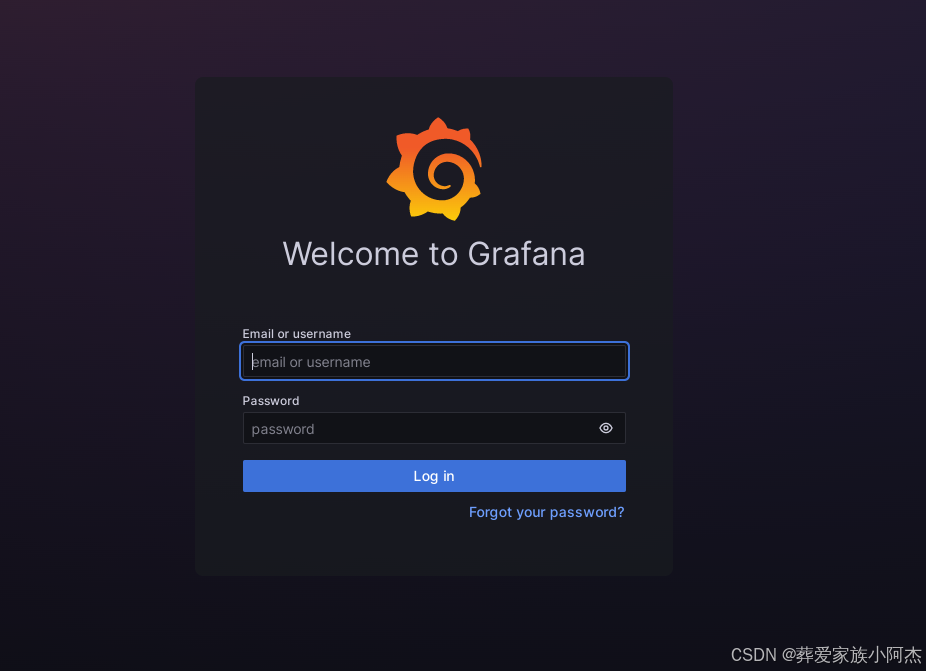
Grafana登录后的页面展示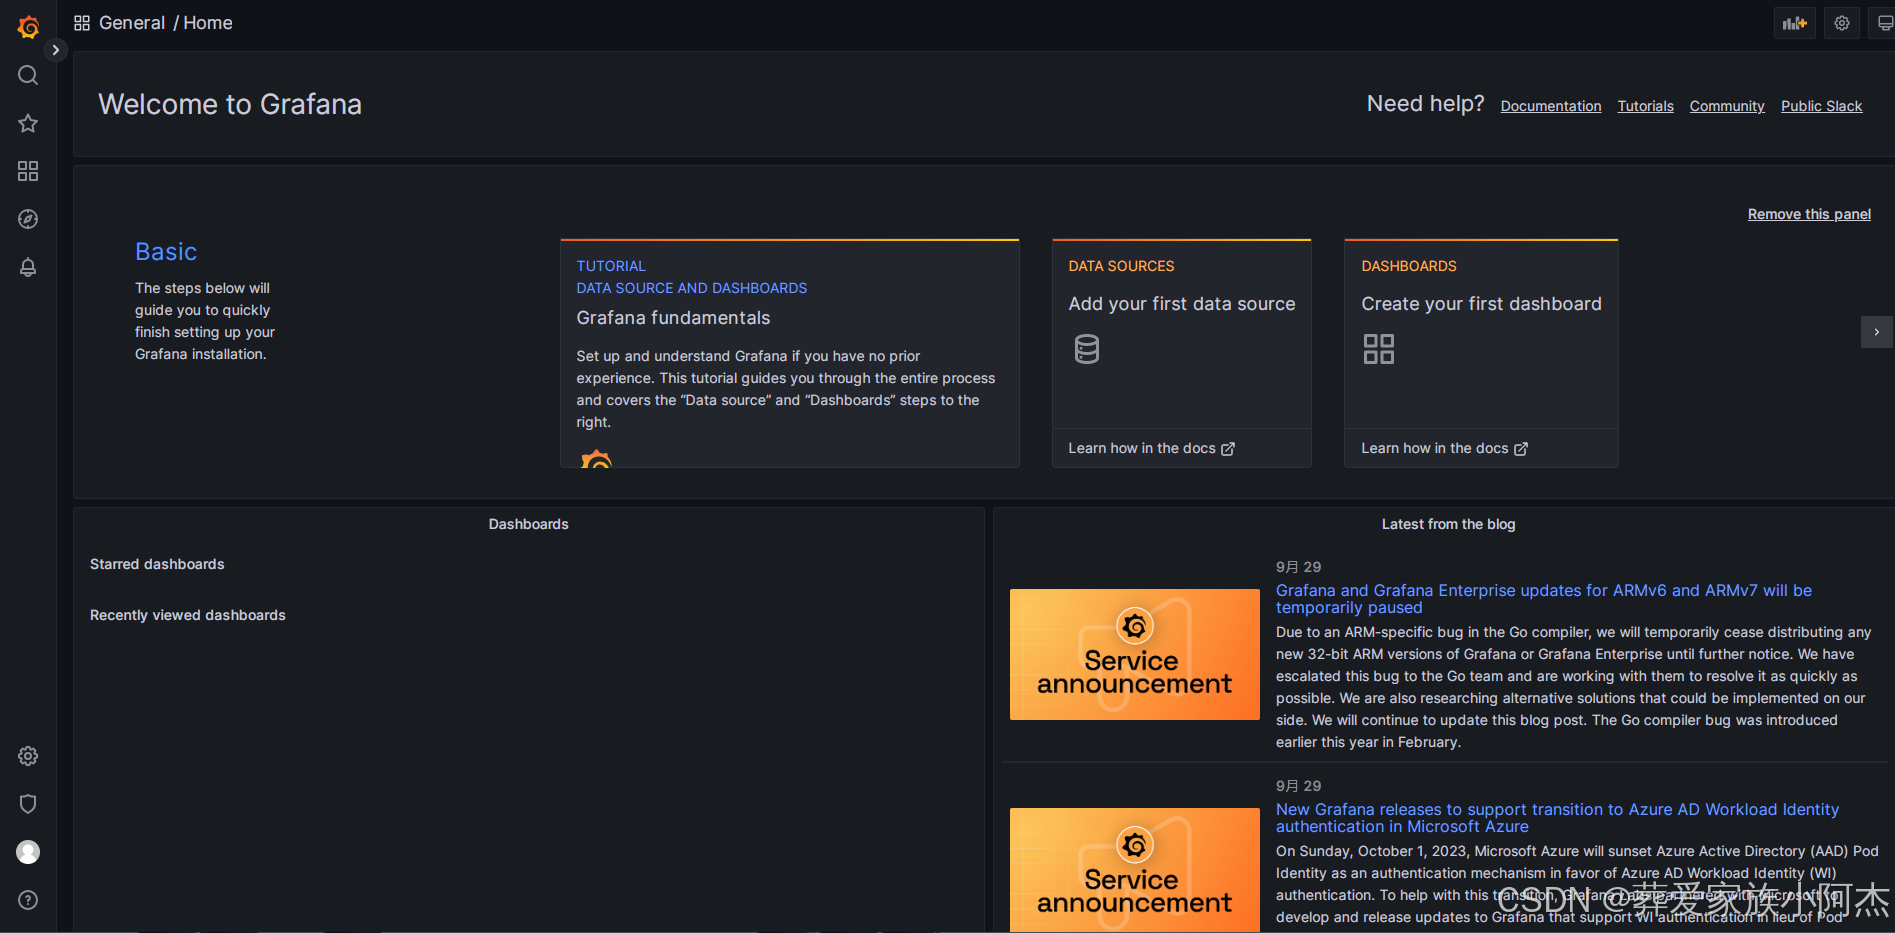
5-4、下载jmeter模板
下载模板的JOSN文件,地址:https://grafana.com/grafana/dashboards/5496-apache-jmeter-dashboard-by-ubikloadpack/ 或者复制模板ID:5496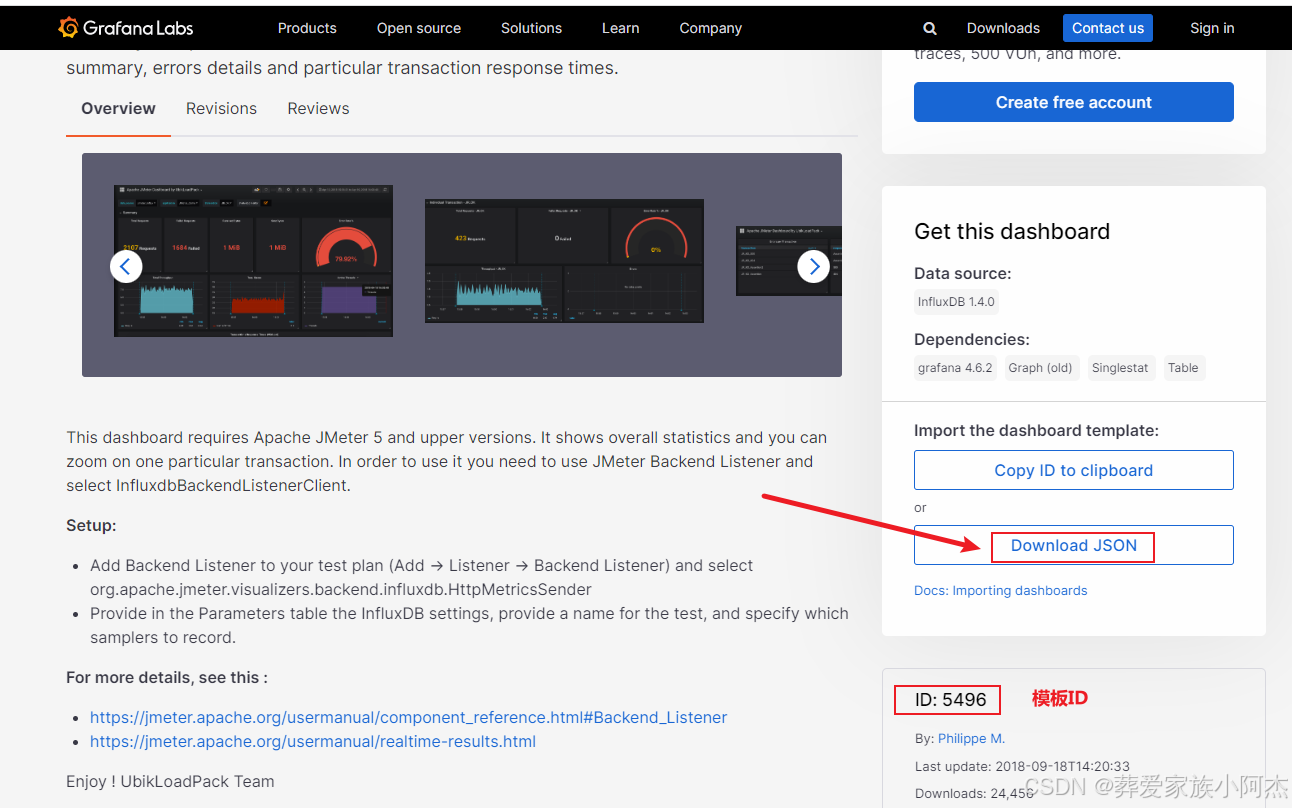
5-5、配置Influx数据源
进入Grafana首页,点击设置-> Configuration -> Data Sources -> Add data source 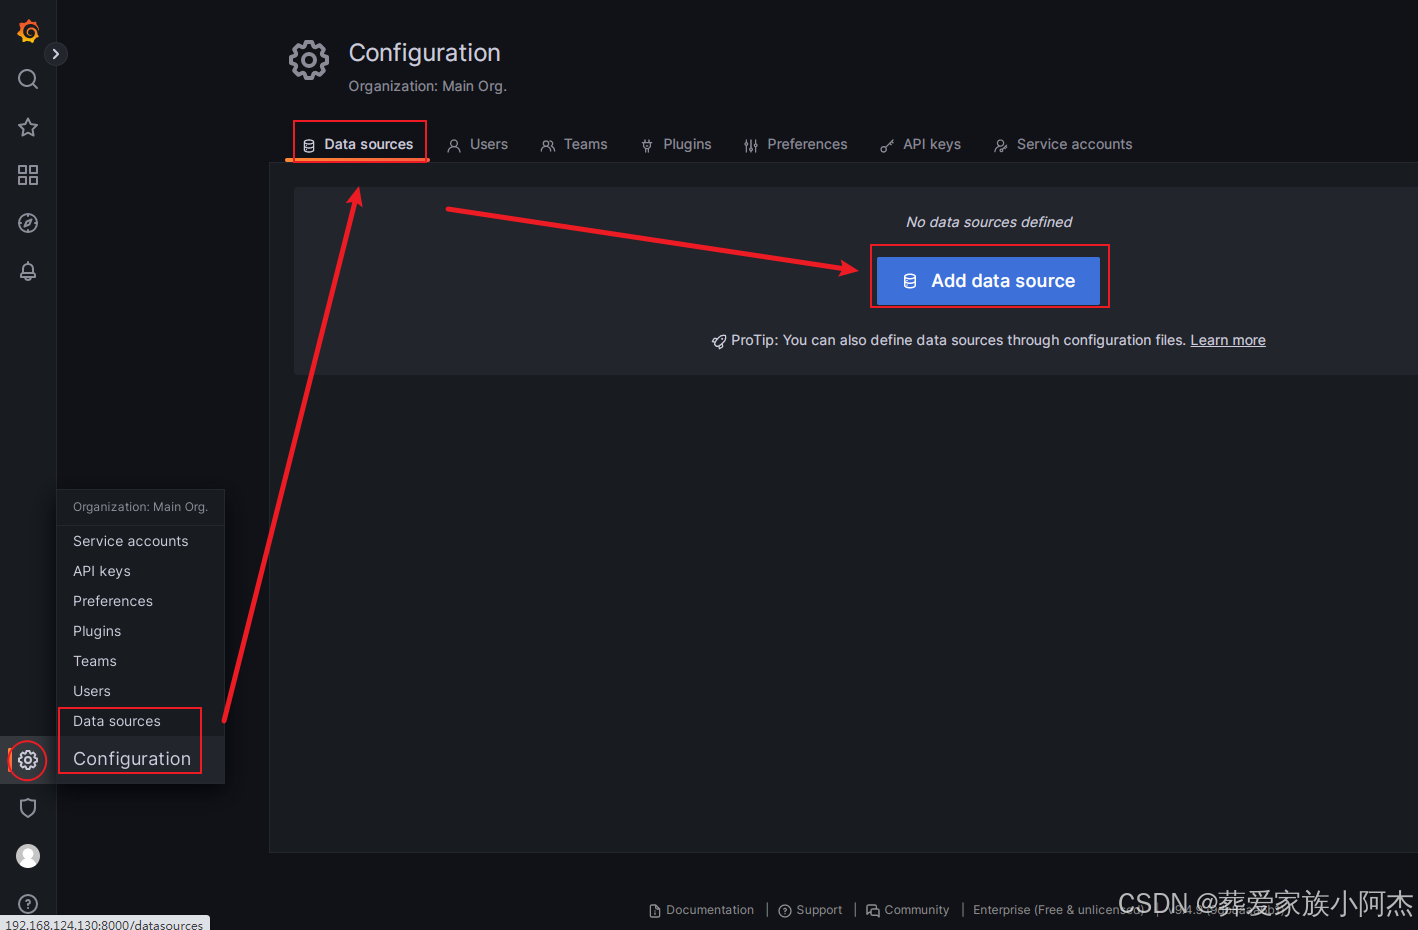
点击InfluxBD数据源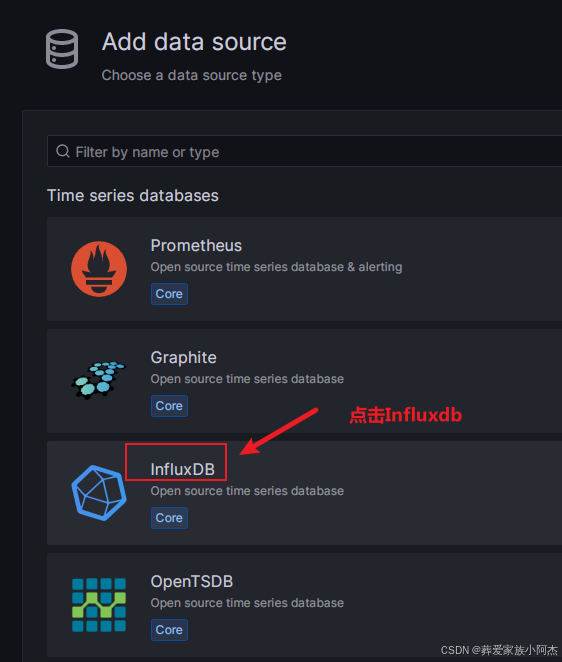
填写InfluxDB的信息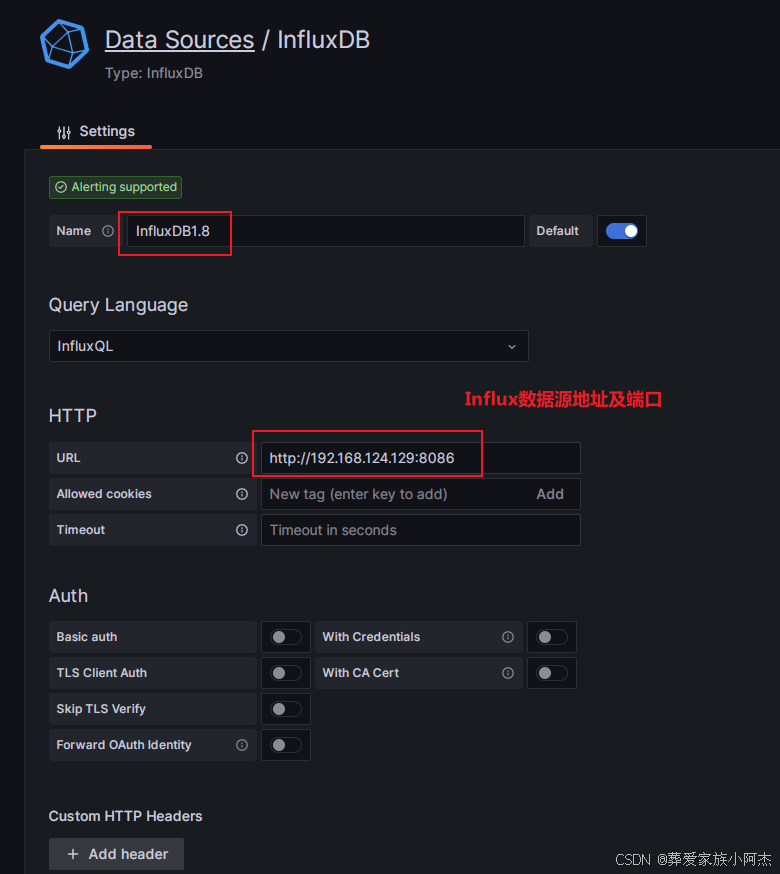

5-6、导入Jmeter模板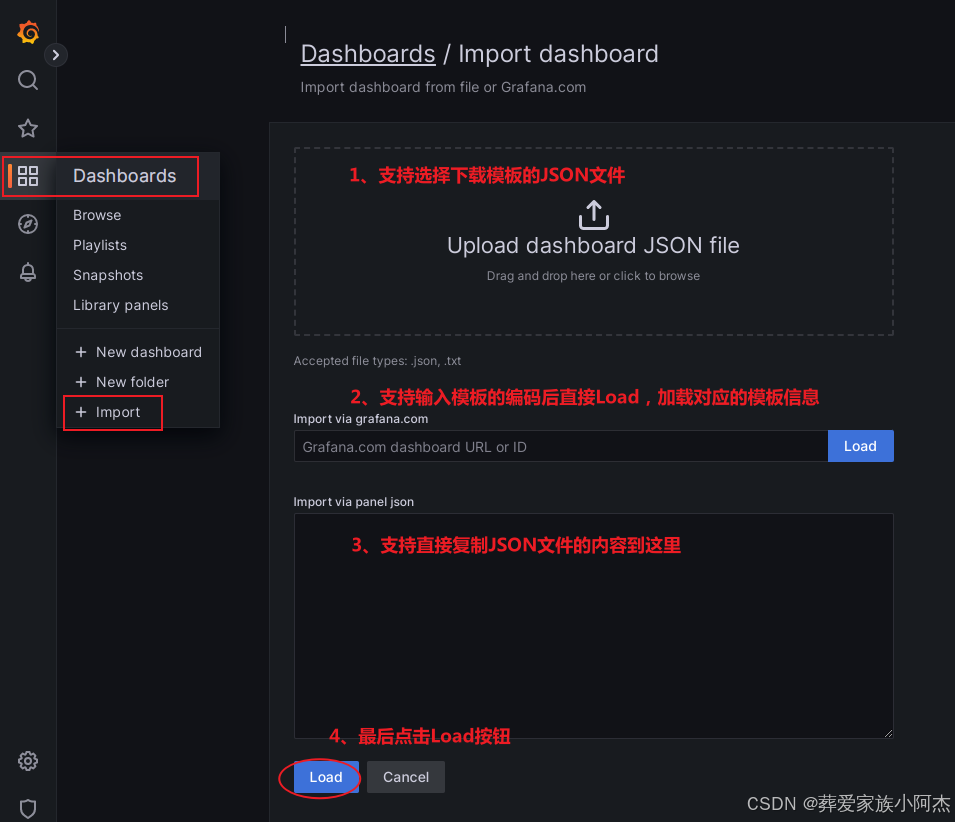
我使用的复制模板编码:5496,再点击Load按钮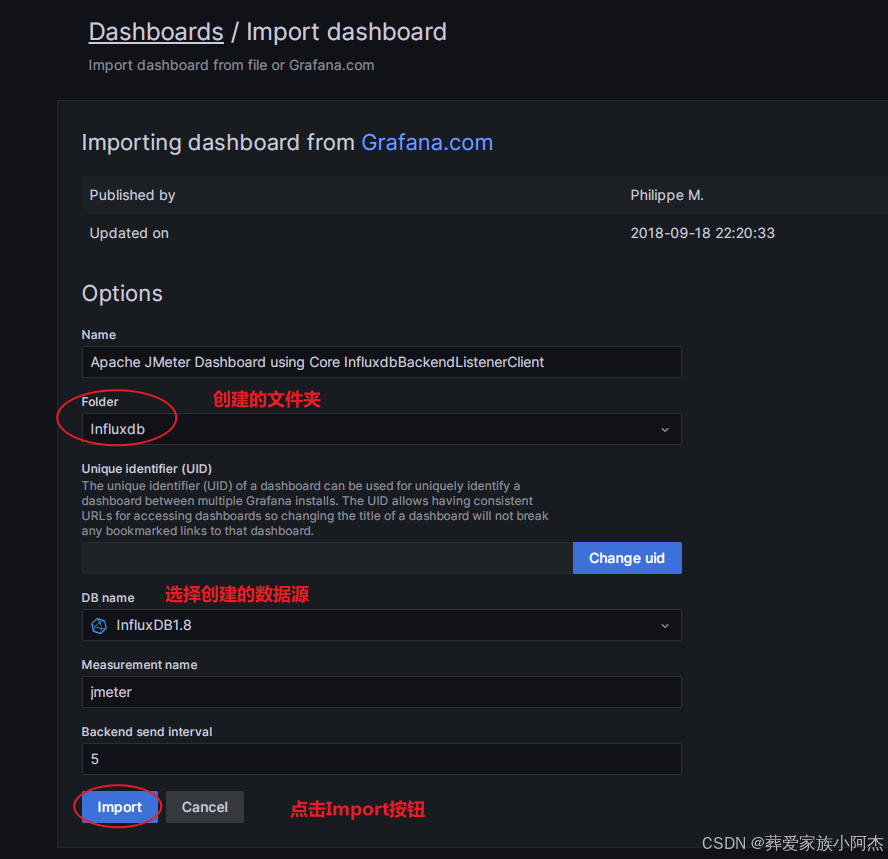
最终导入模板的效果显示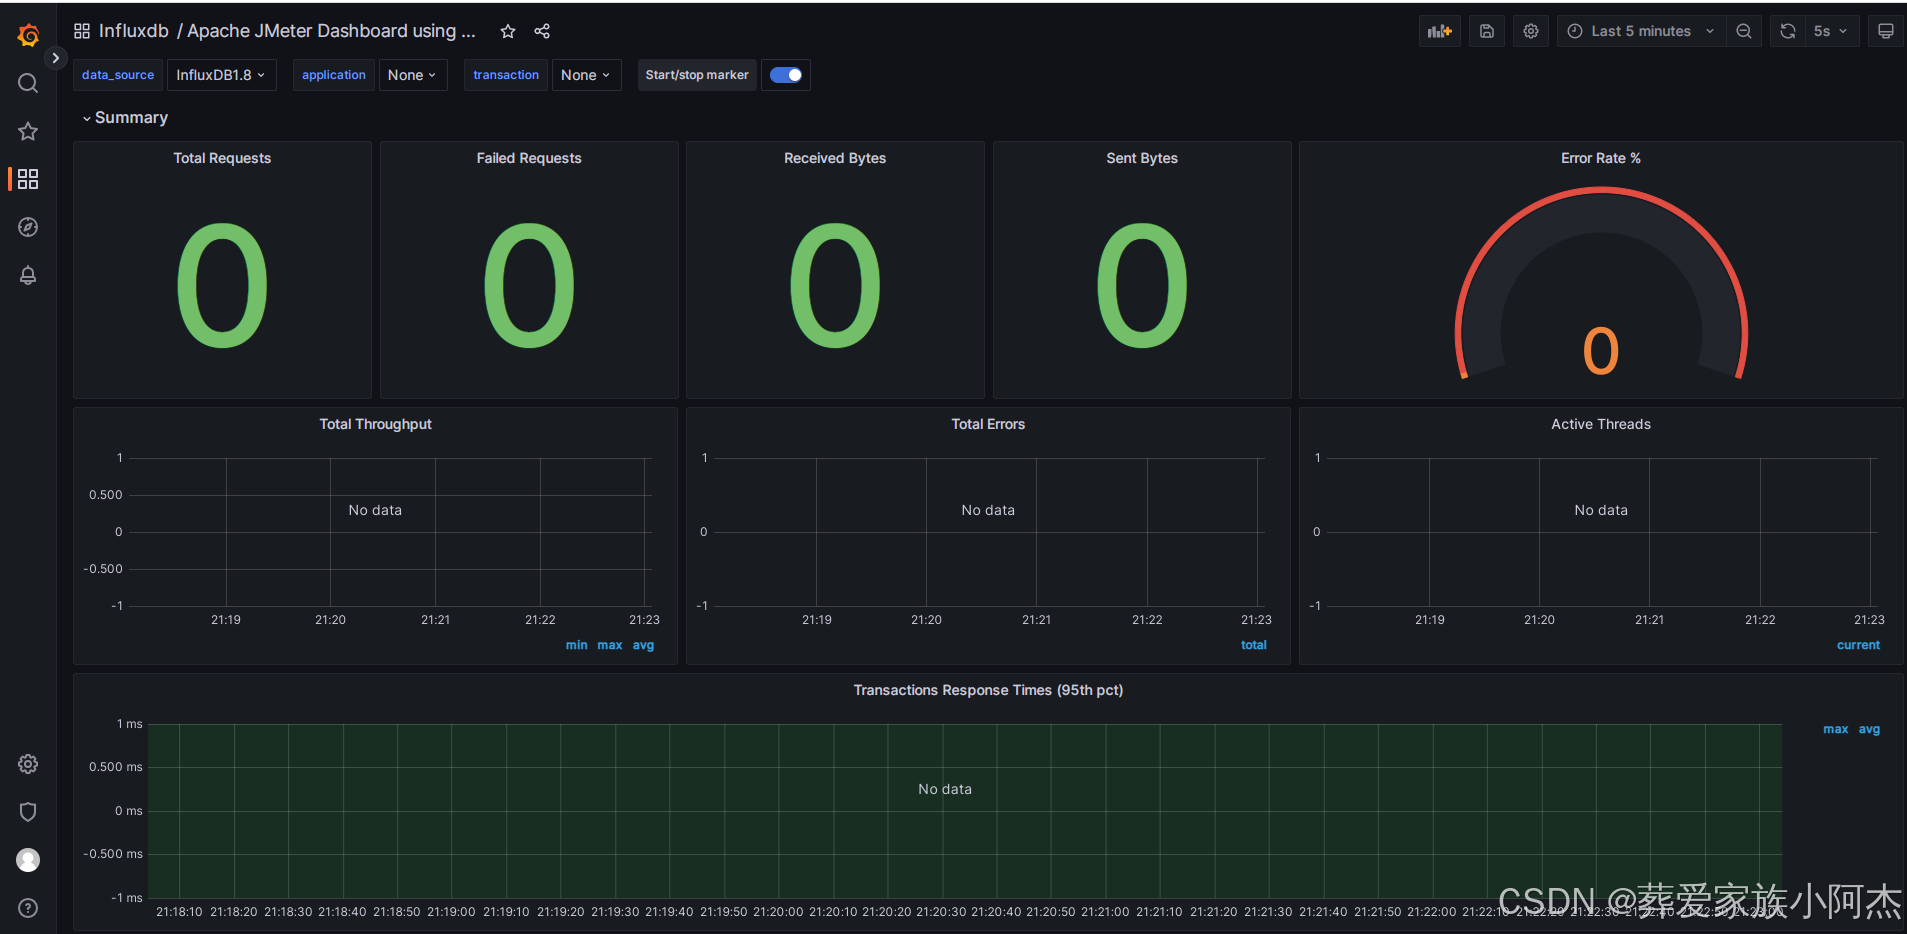
6、Jmeter配置执行
测试计划中添加:Add -> Listener -> Backend Listener(后端监听器)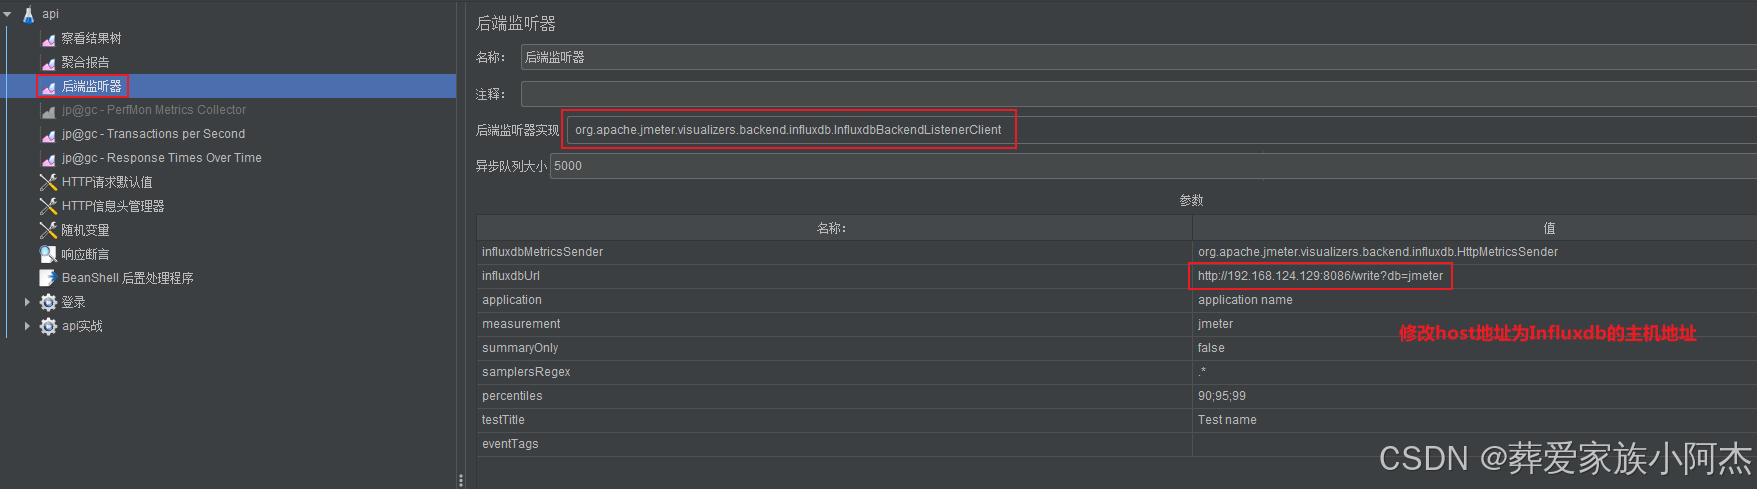
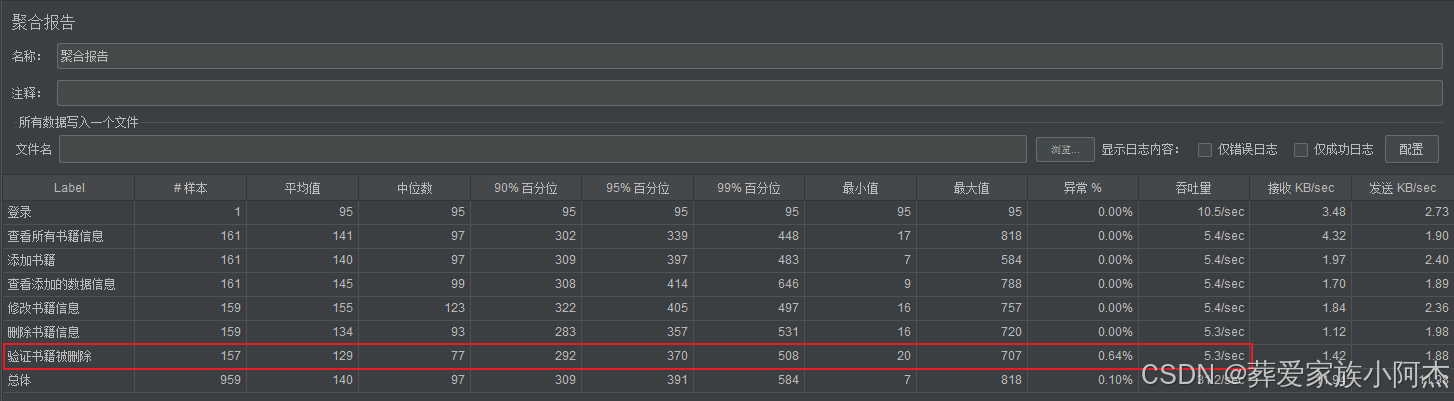
执行Api测试(总详情), 总的请求数据959,错误请求1个,错误率为0.10%,结果如下: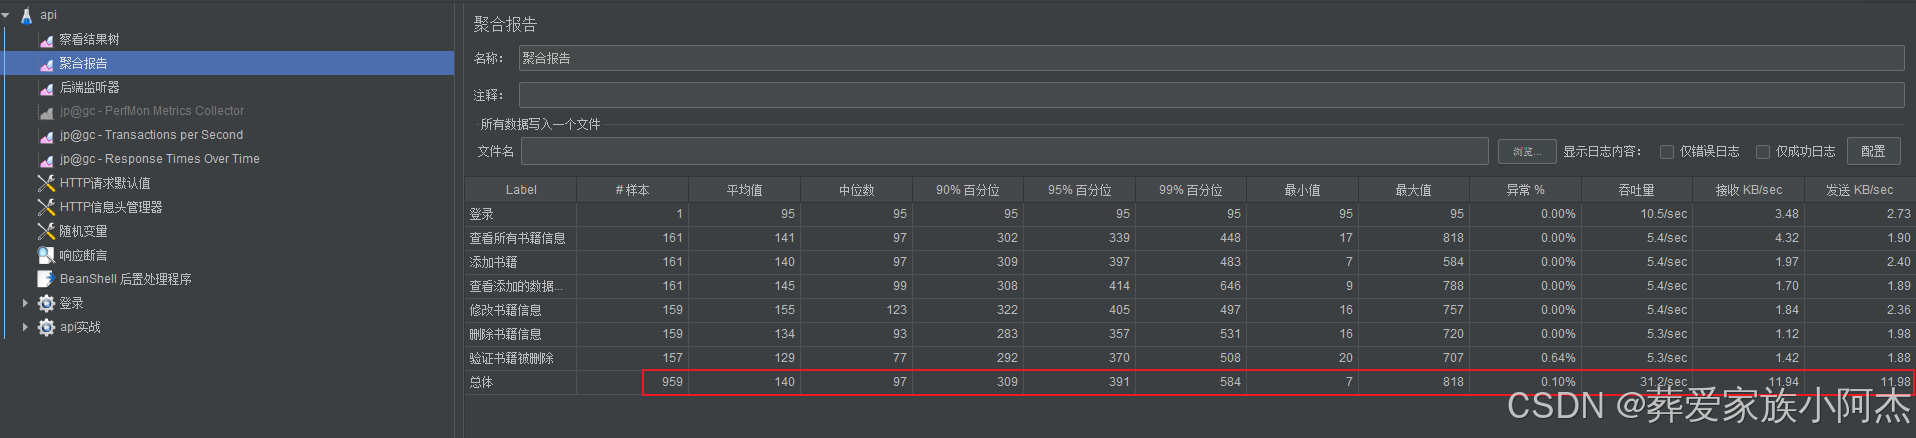
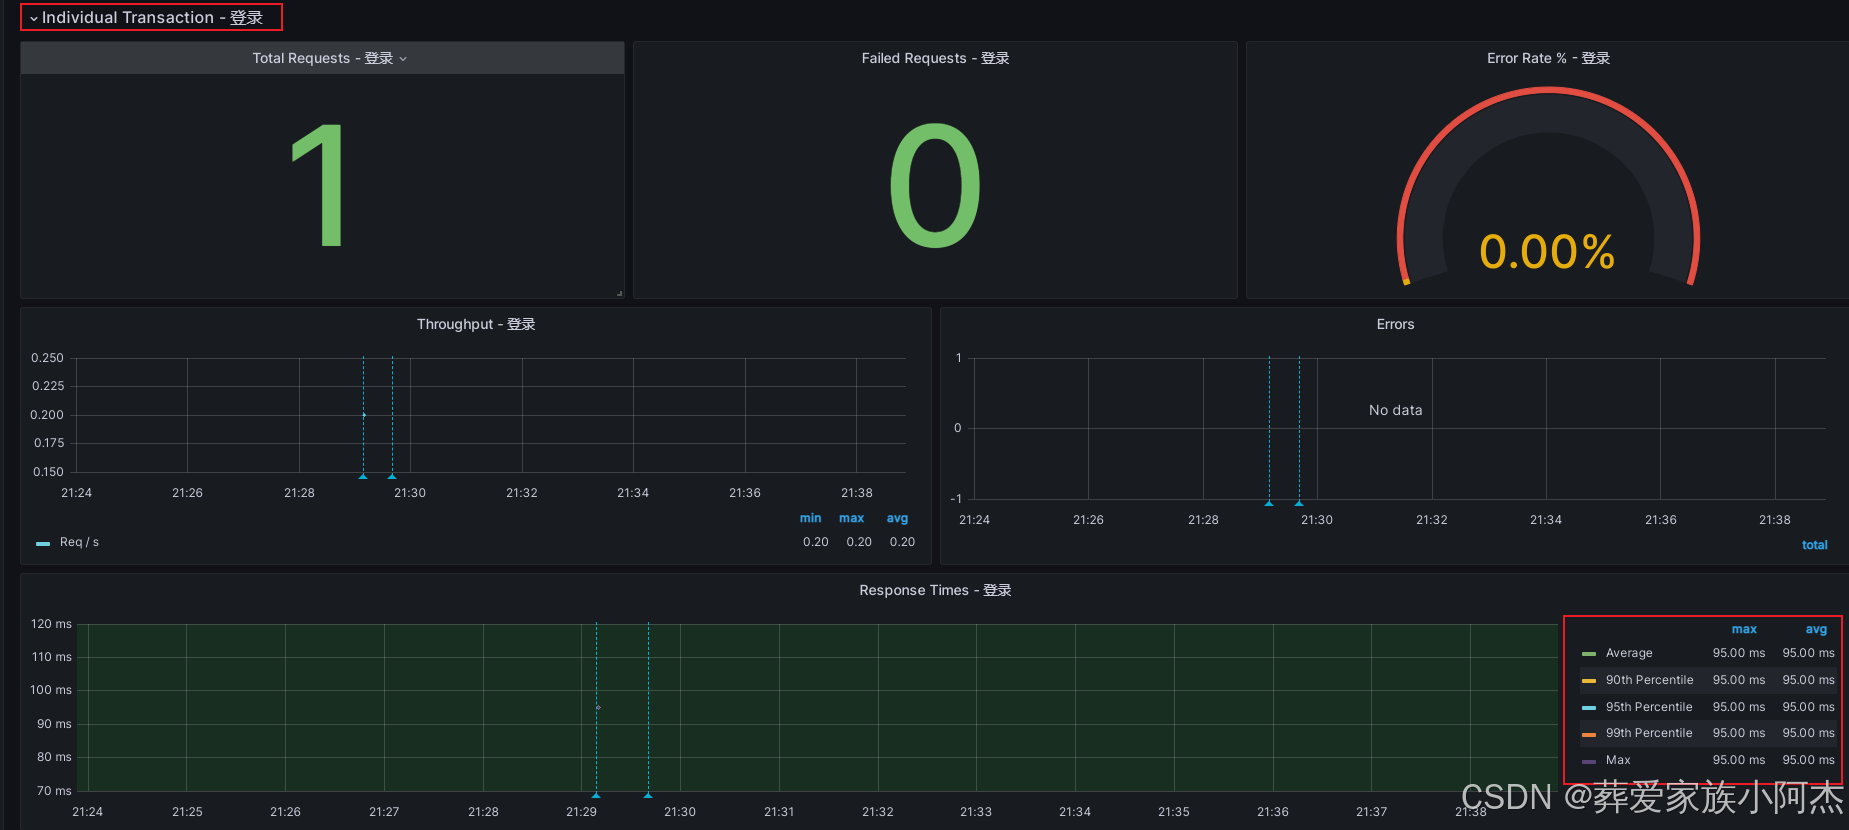
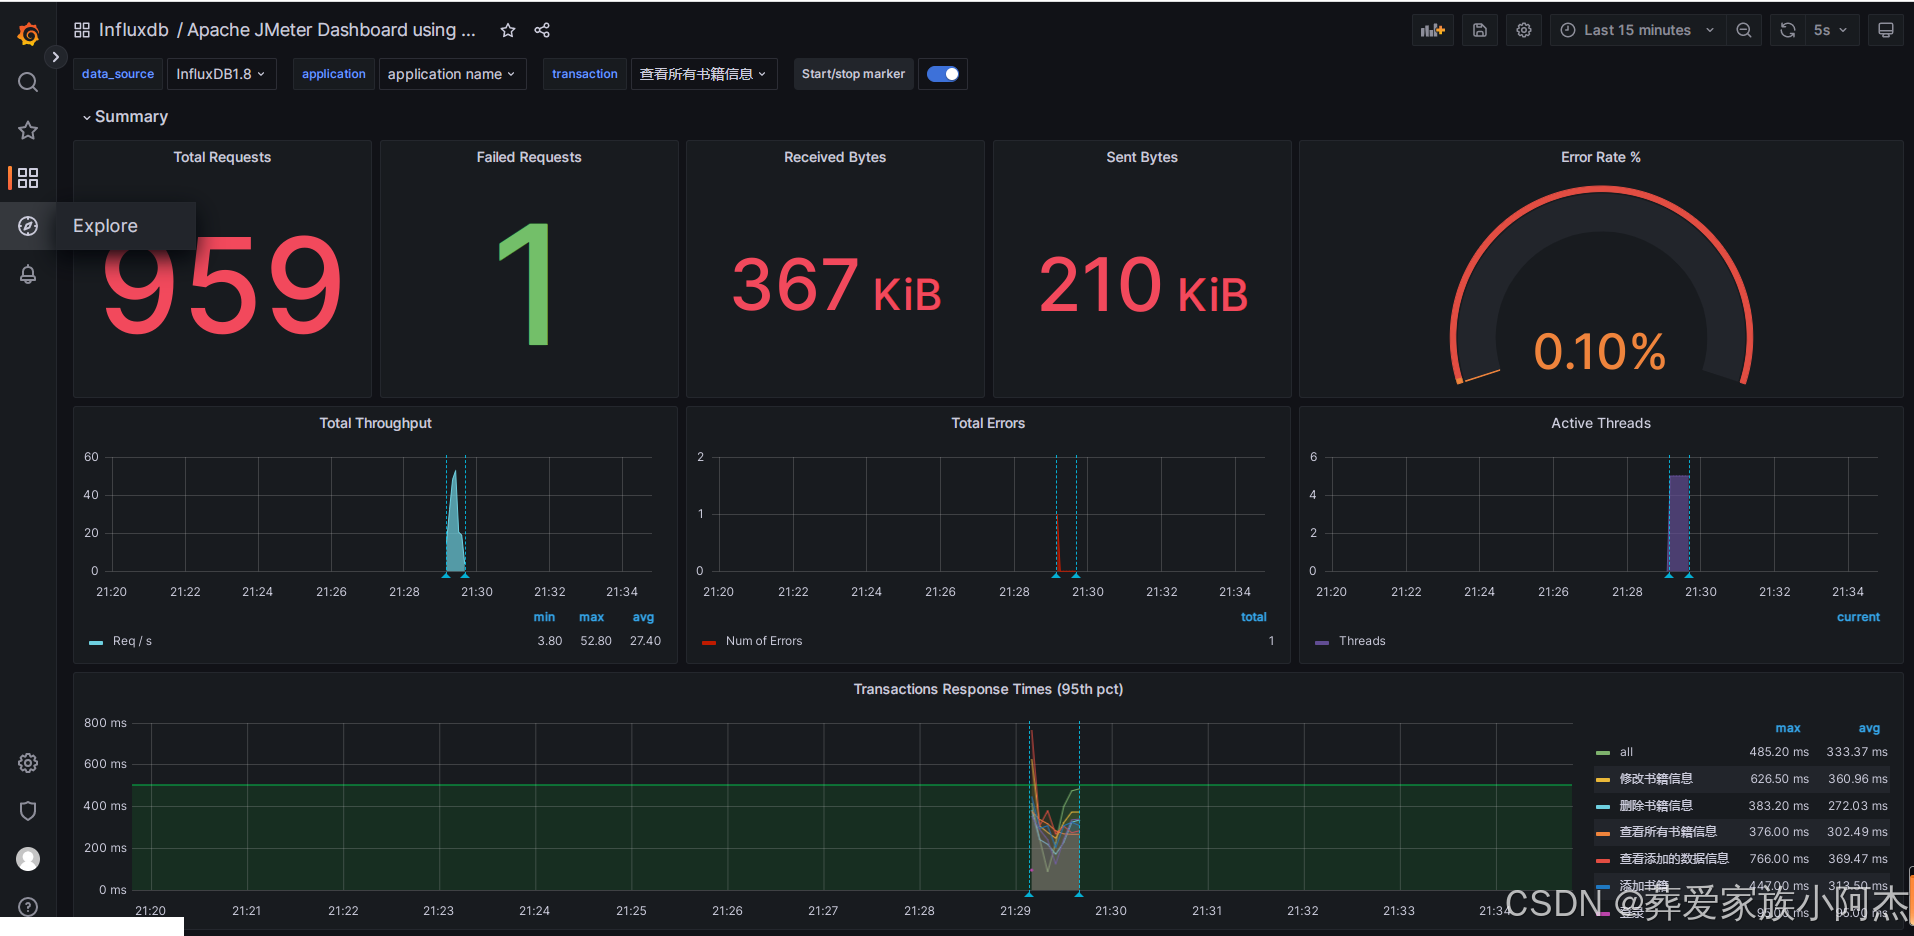 登录接口对比
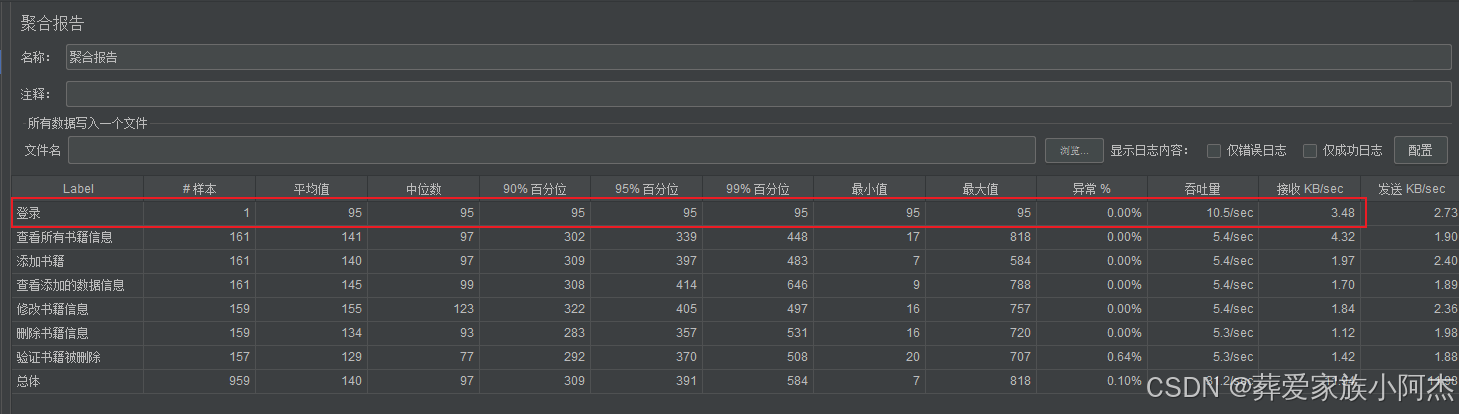
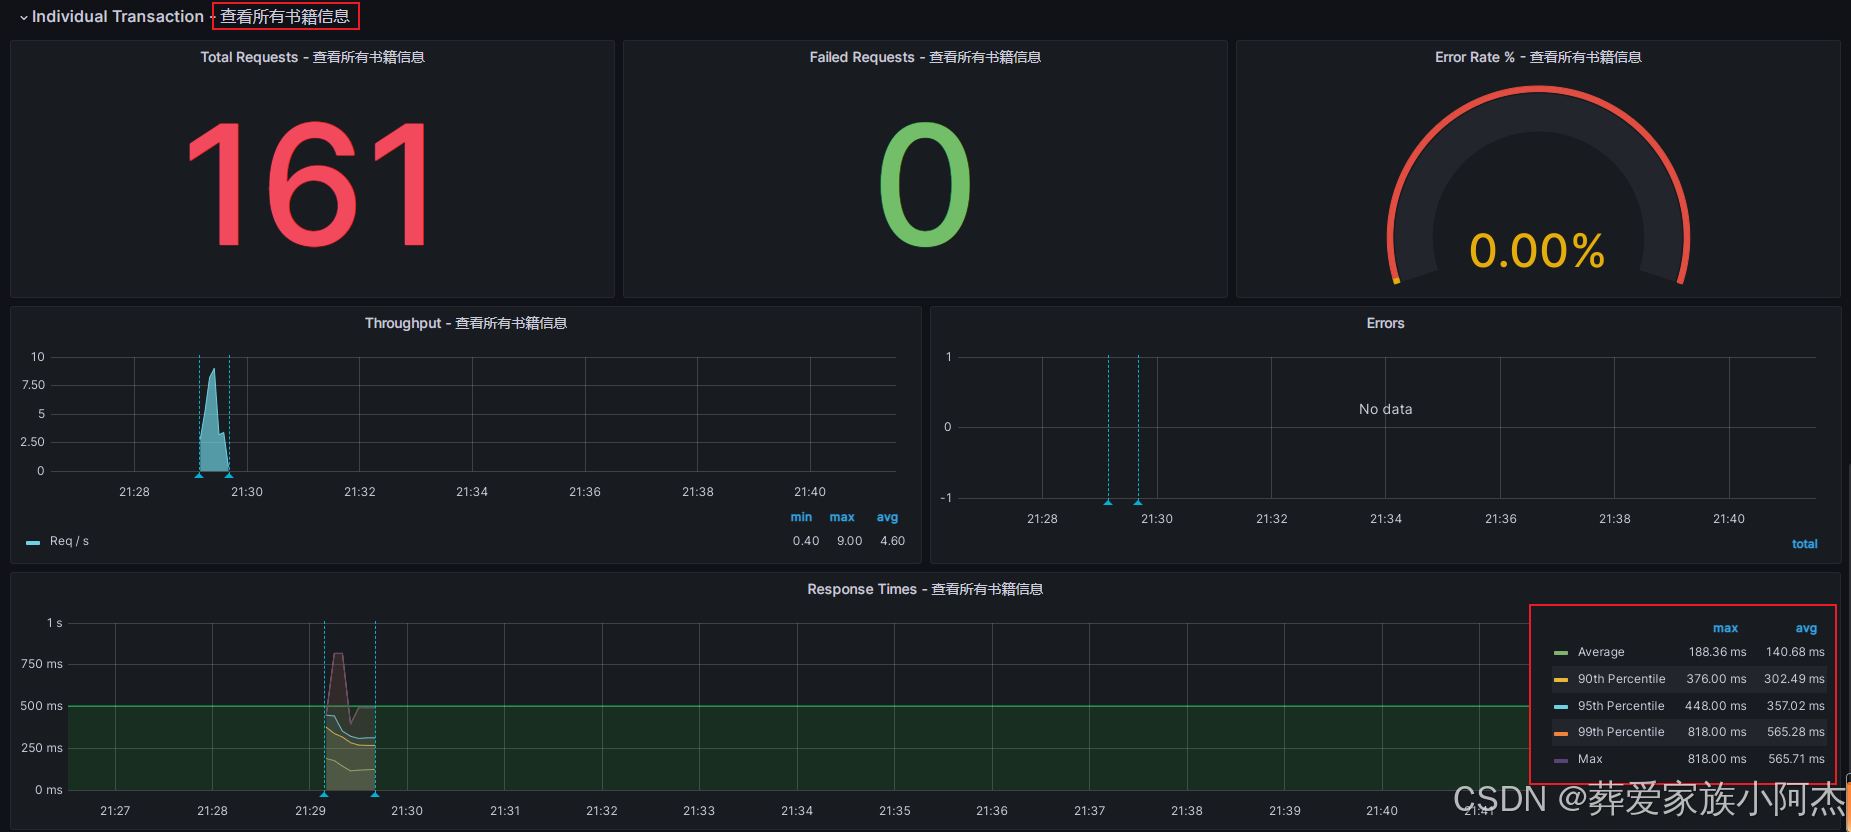
查看所有书籍信息接口对比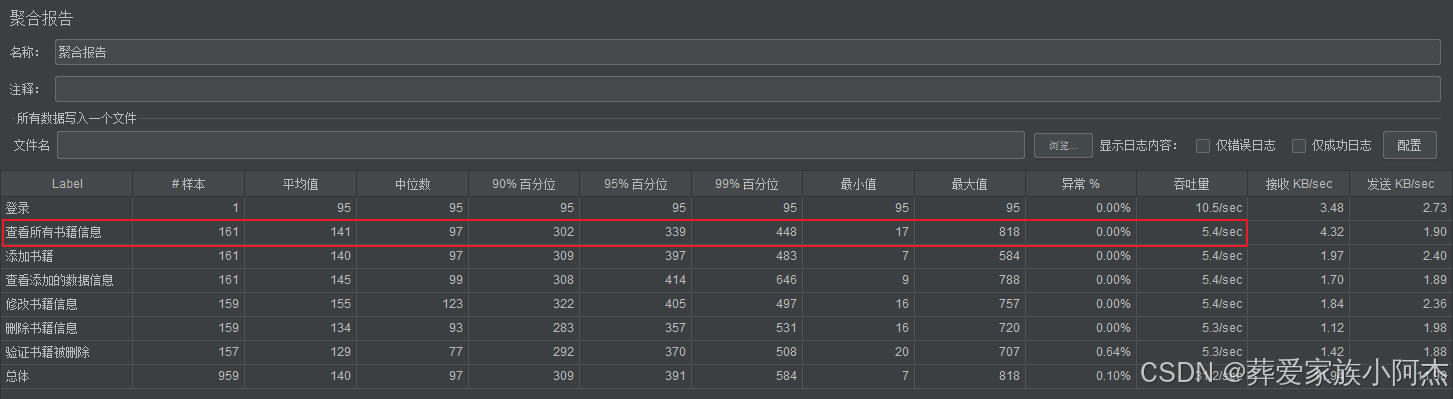
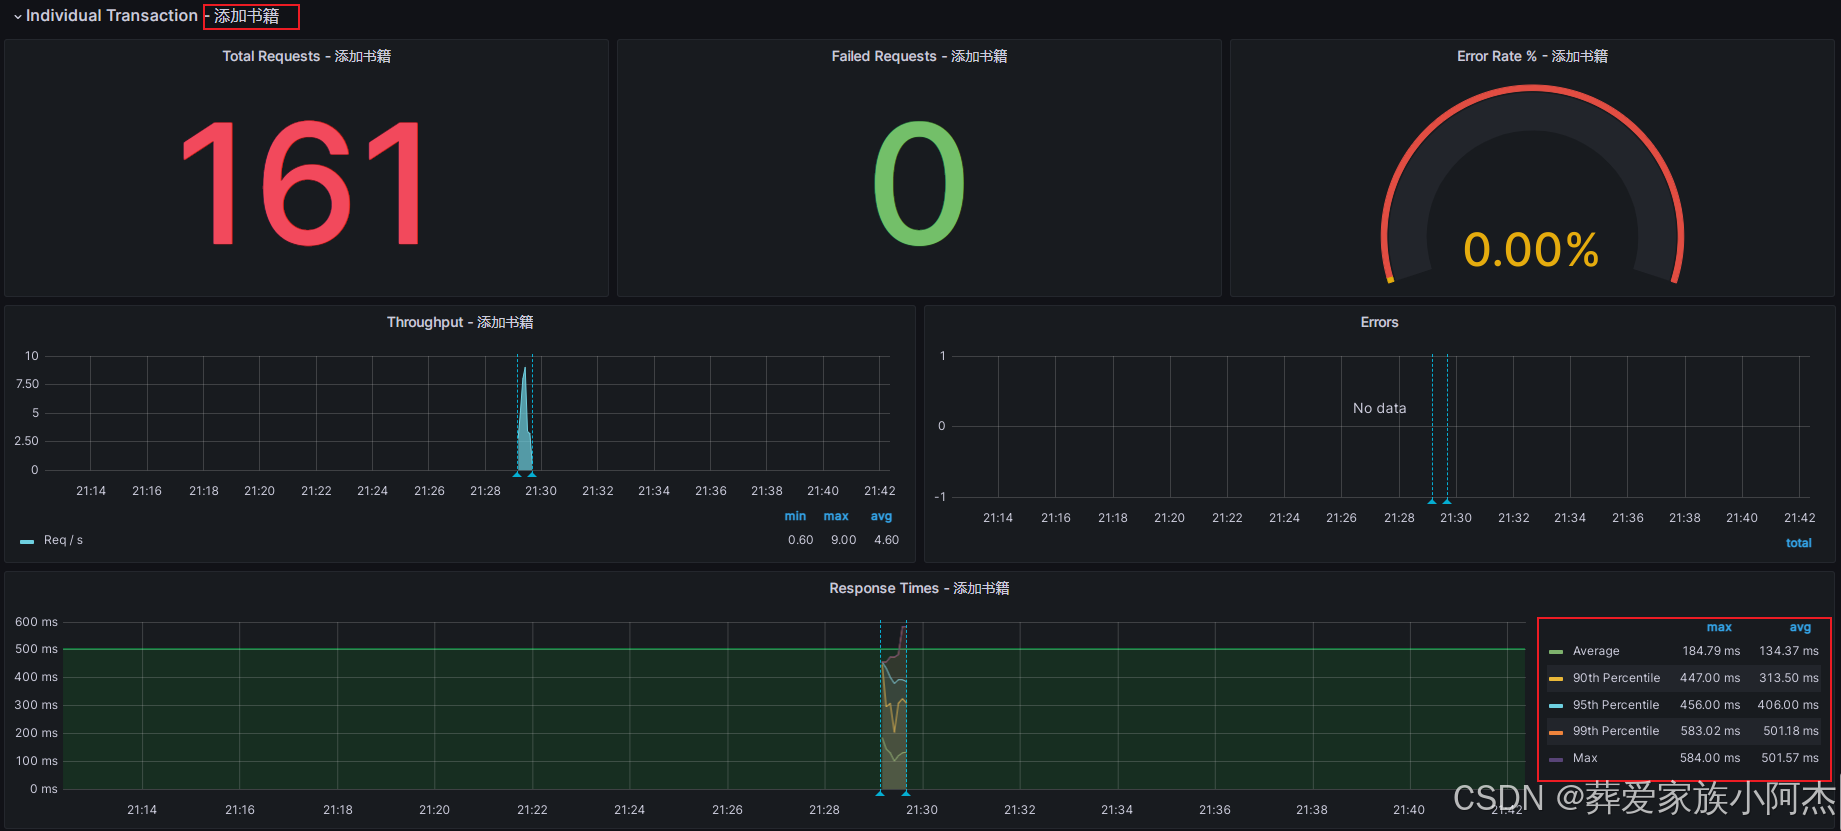
添加书籍接口对比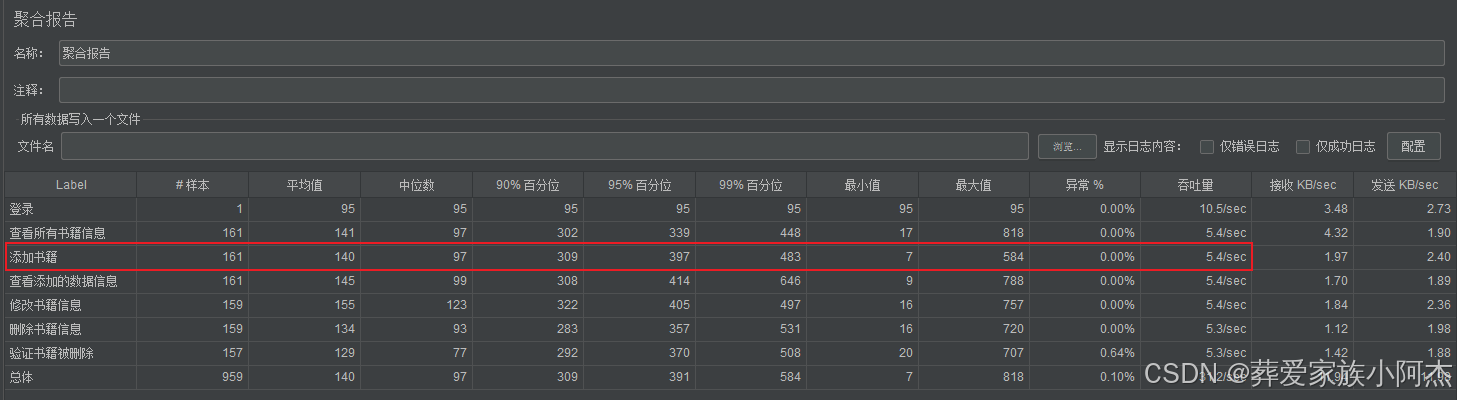
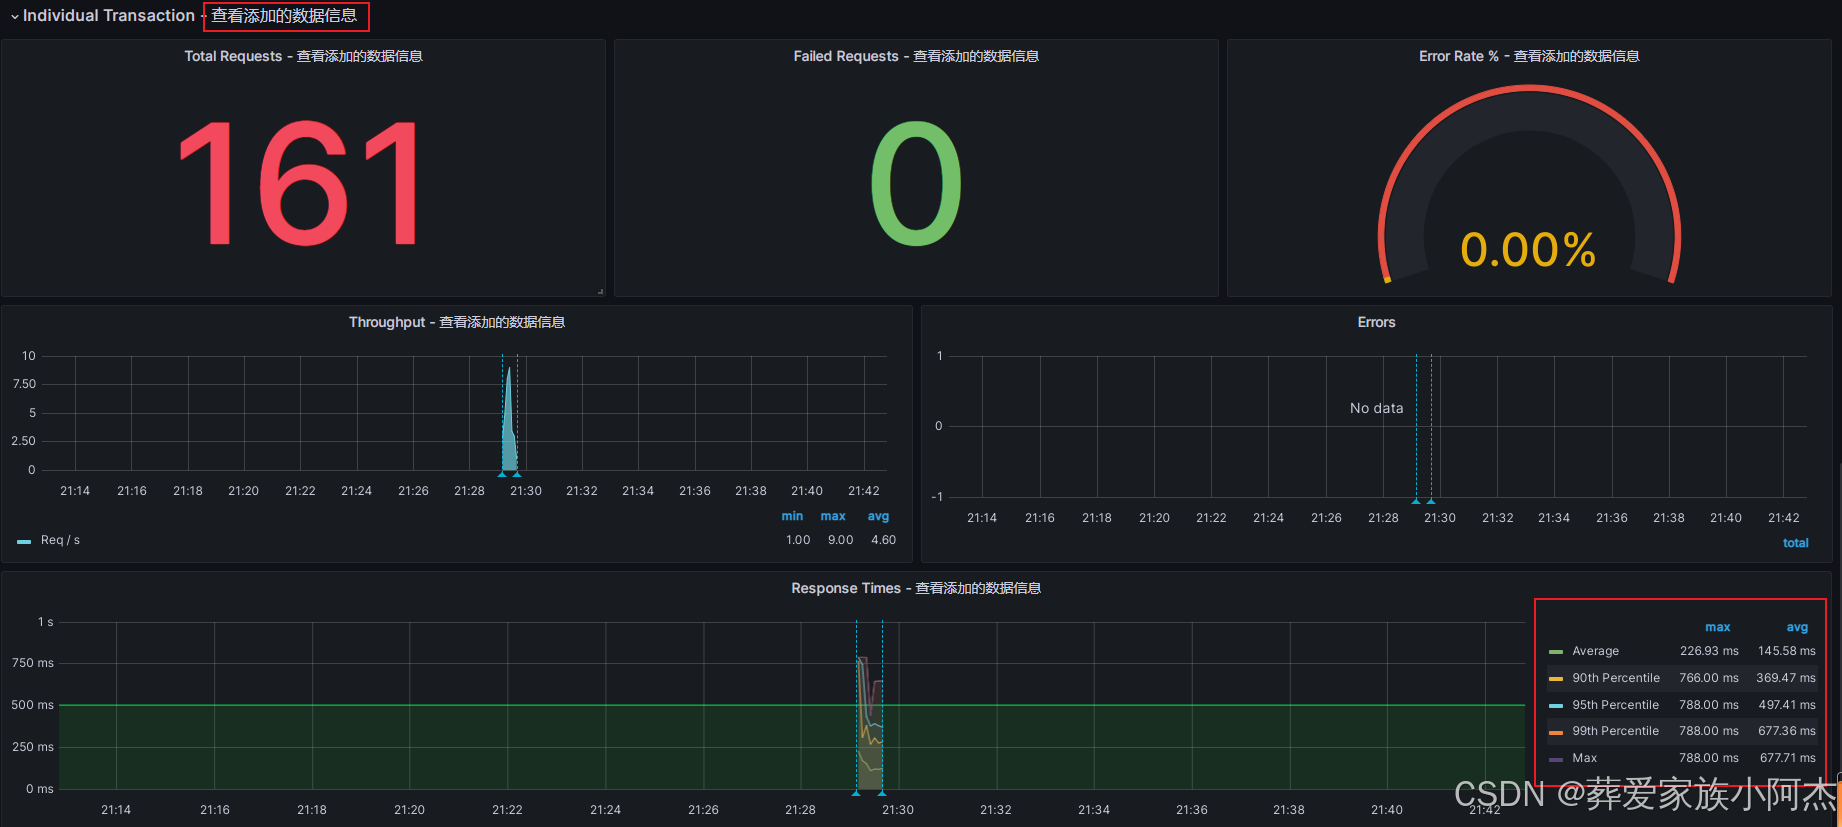
查看添加的数据信息接口对比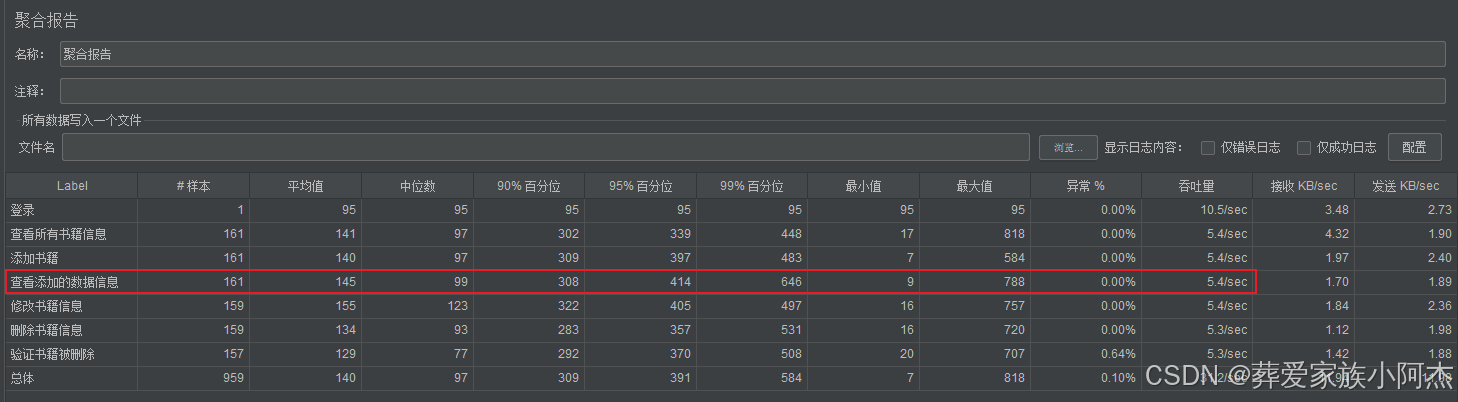
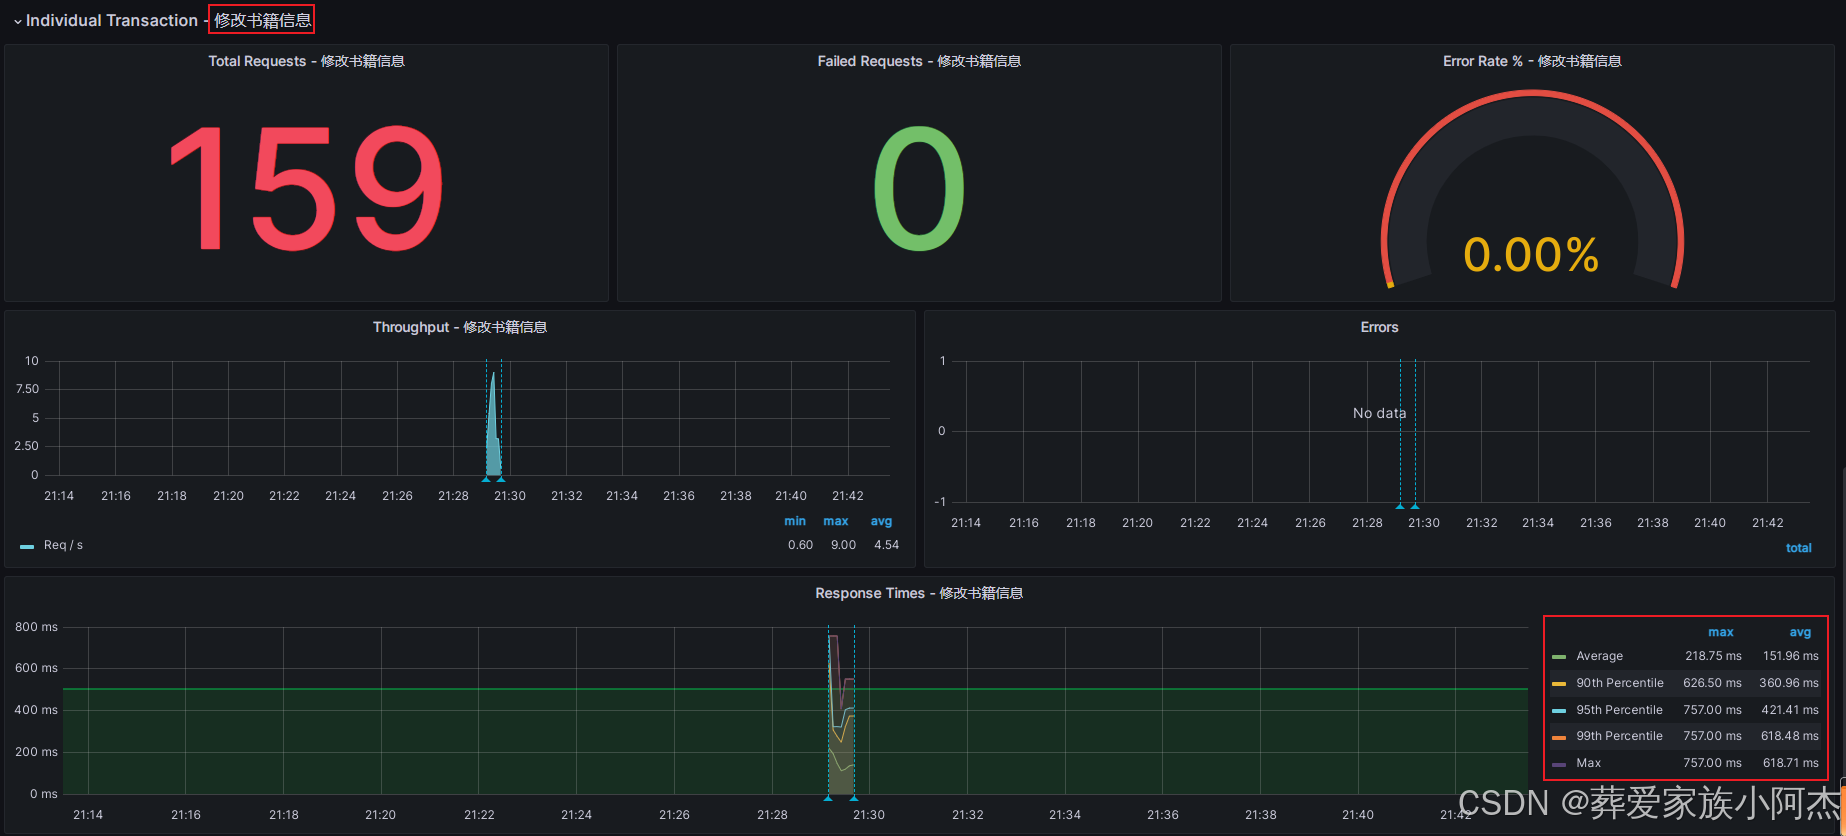
修改书籍信息接口对比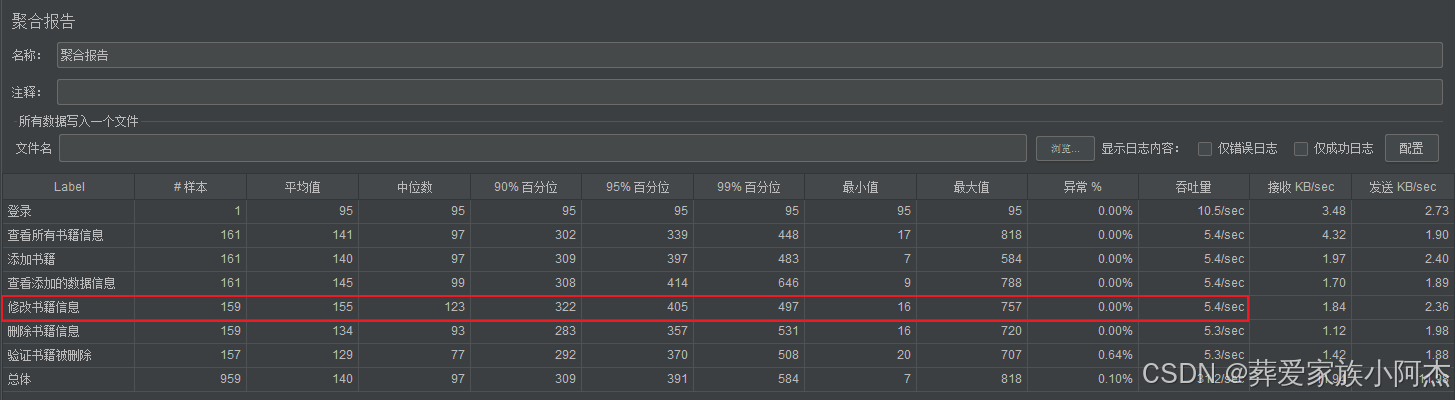
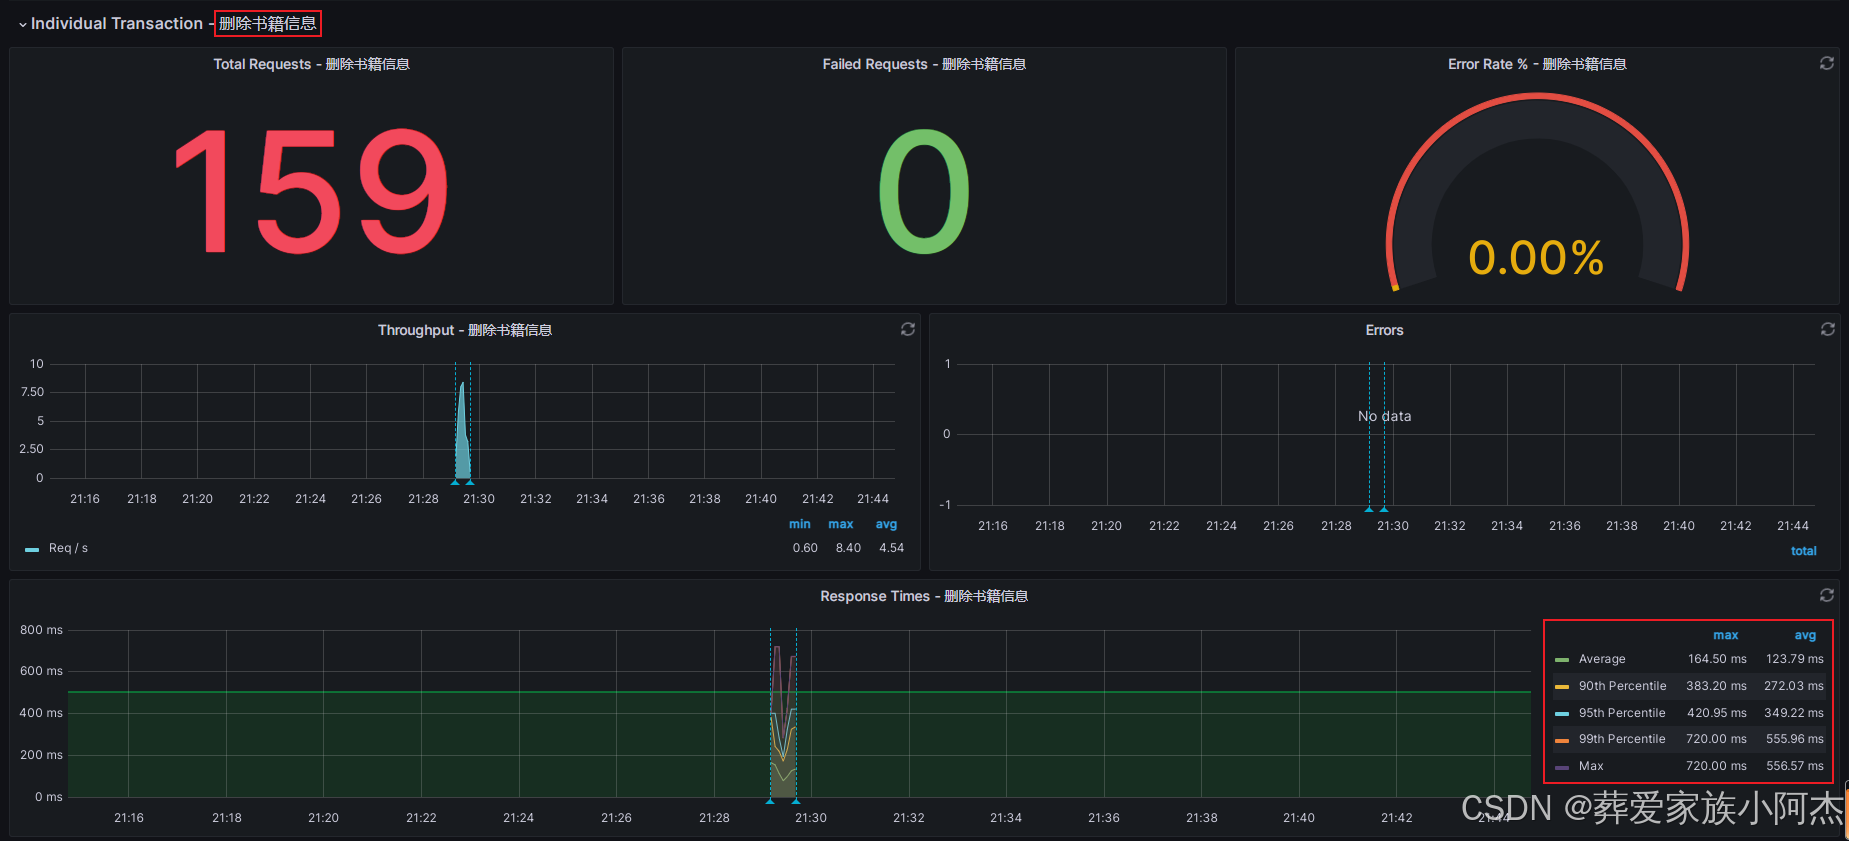
删除书籍信息接口对比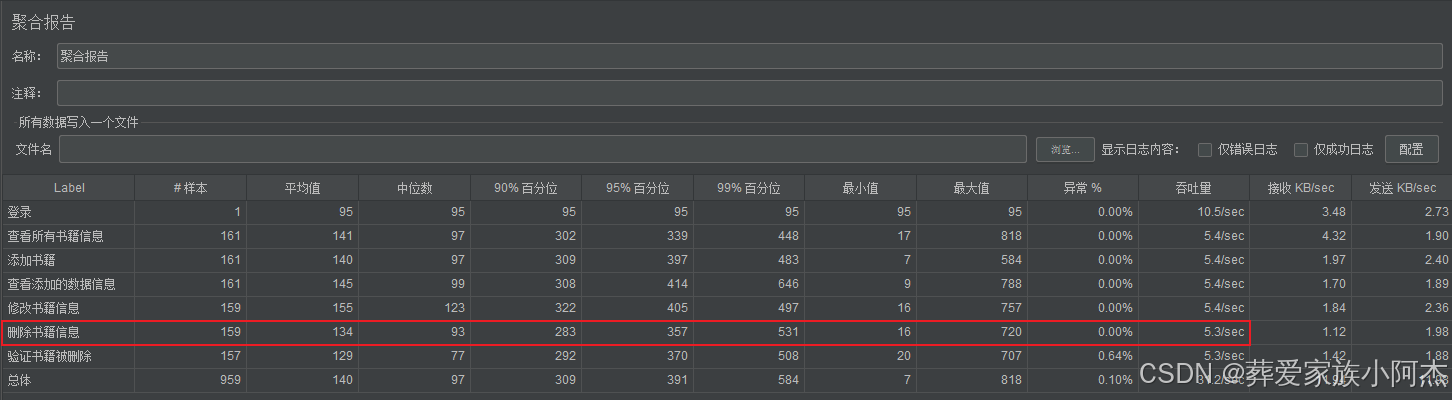
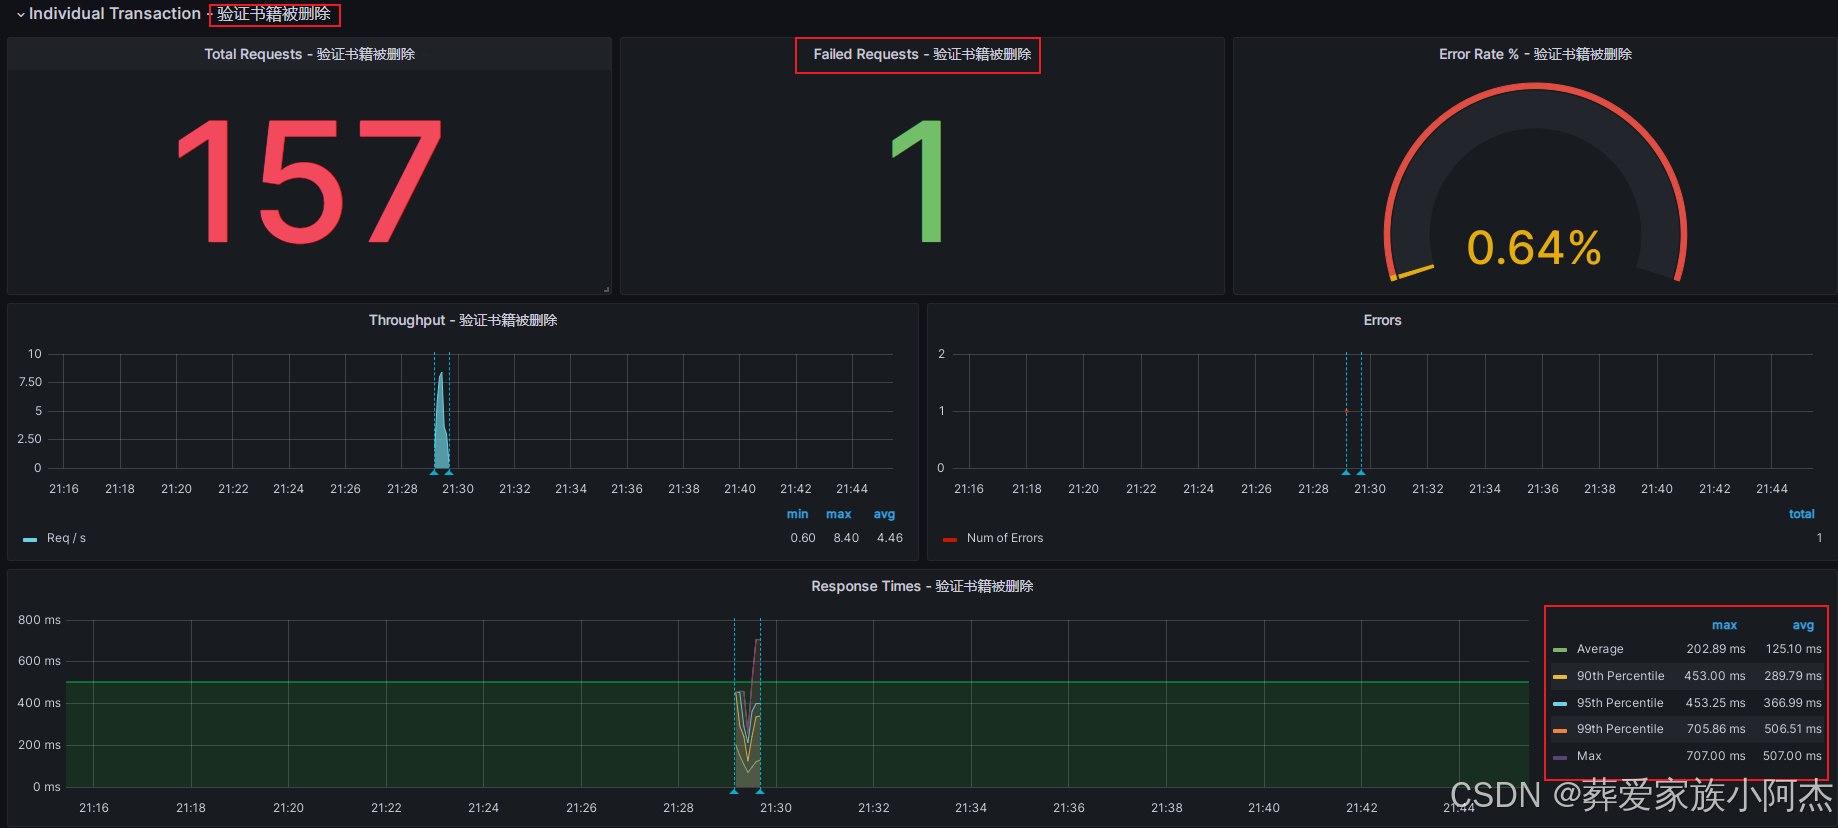
验证书籍被删除接口对比