pprof简介
pprof 是 Go 语言标准库提供的一个强大的性能分析工具,它能帮助开发者深入了解程序的运行时行为,找出性能瓶颈,进而对代码进行优化。下面从多个方面对 pprof 进行详细介绍:
主要功能
- CPU 性能分析:能够记录程序在运行期间 CPU 的使用情况,包括每个函数的执行时间、调用次数等信息,帮助开发者找出哪些函数消耗了大量的 CPU 时间。
- 内存性能分析:可以分析程序的内存分配情况,比如哪些函数分配了大量的内存,内存的增长趋势如何等,有助于发现内存泄漏或者内存使用不合理的问题。
- 阻塞分析:用于检测 goroutine 在哪些操作上被阻塞,以及阻塞的时长,这对于并发程序的性能优化非常有帮助。
- 锁分析:可以分析锁的竞争情况,找出哪些锁导致了性能瓶颈,从而优化锁的使用。
工作原理
pprof 通过采样的方式收集程序的运行时数据。在 CPU 分析中,它会以一定的时间间隔(通常是 10ms)对程序的调用栈进行采样,记录当前正在执行的函数。对于内存分析,它会记录内存分配的信息,包括分配的大小、分配的位置等。这些采样数据会被整理成分析报告,供开发者查看和分析。
使用方式
集成到 HTTP 服务
在代码中导入 net/http/pprof 包,该包会自动注册多个处理程序到默认的 HTTP 服务器,用于收集和提供性能分析数据。示例代码如下:
go
package main

import (
    "net/http"
   "github.com/gin-contrib/pprof"
)

func main() {

	r := routers.Routers()
	r.GET("/swagger/*any", ginSwagger.WrapHandler(swaggerFiles.Handler))
	// 启用 pprof 路由
	pprof.Register(r)

	r.Run("0.0.0.0:8080")
}
运行
go run main.go之后就可以通过访问 http://localhost:8080/debug/pprof/ 来查看性能分析数据。
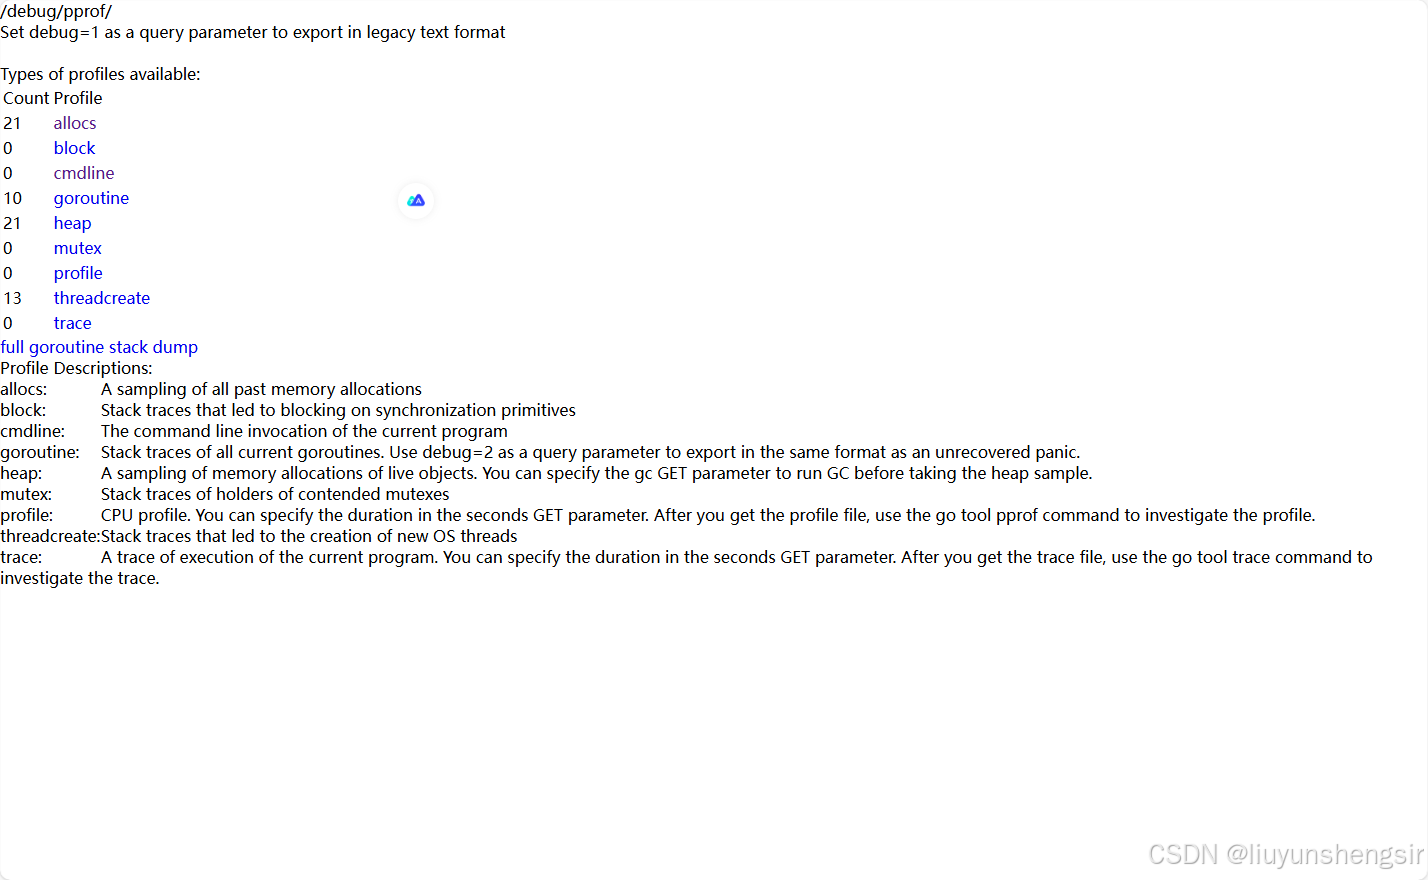
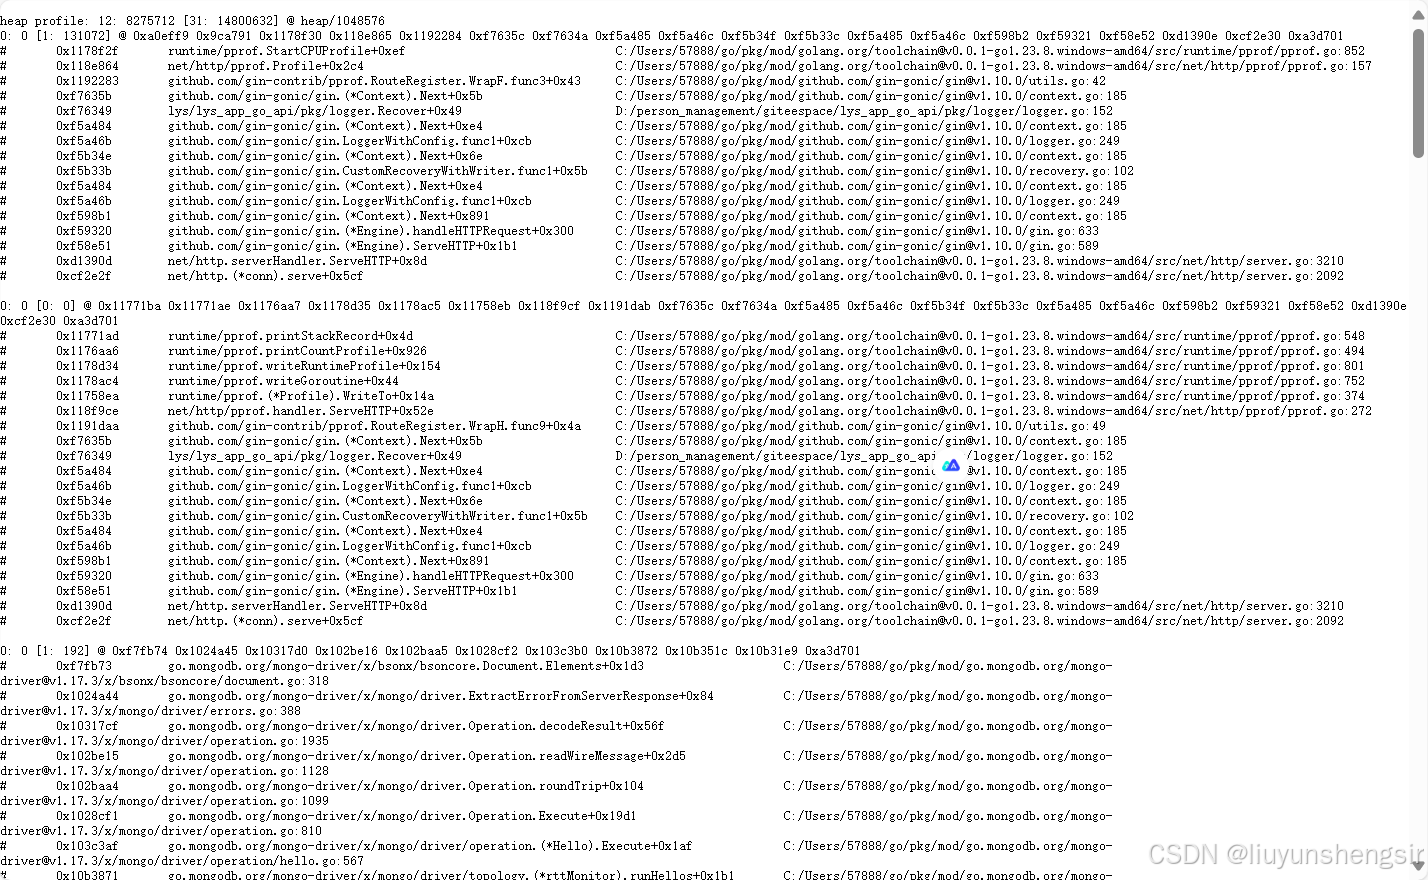
web 页面分析
allocs	$host/debug/pprof/allocs?debug=1	过去所有内存抽样情况
block	$host/debug/pprof/block?debug=1	同步阻塞时程序栈跟踪的一些情况
heap	$host/debug/pprof/heap?debug=1	活动对象的内存分配情况
mutex	$host/debug/pprof/mutex?debug=1	互斥锁持有者的栈帧情况
profile	$host/debug/pprof/profile	cpu profile,点击时会得到一个文件,然后可以用 go tool pprof 命令进行分析
threadcreate	$host/debug/pprof/threadcreate?debug=1	创建新 OS 线程的堆栈跟踪情况
trace	$host/debug/pprof/trace	当前程序执行的追踪情况,点击时会得到一个文件,可以用 go tool trace 命令来分析这个文件
http://localhost:8080/debug/pprof/
http://localhost:8080/debug/pprof/allocs?debug=1
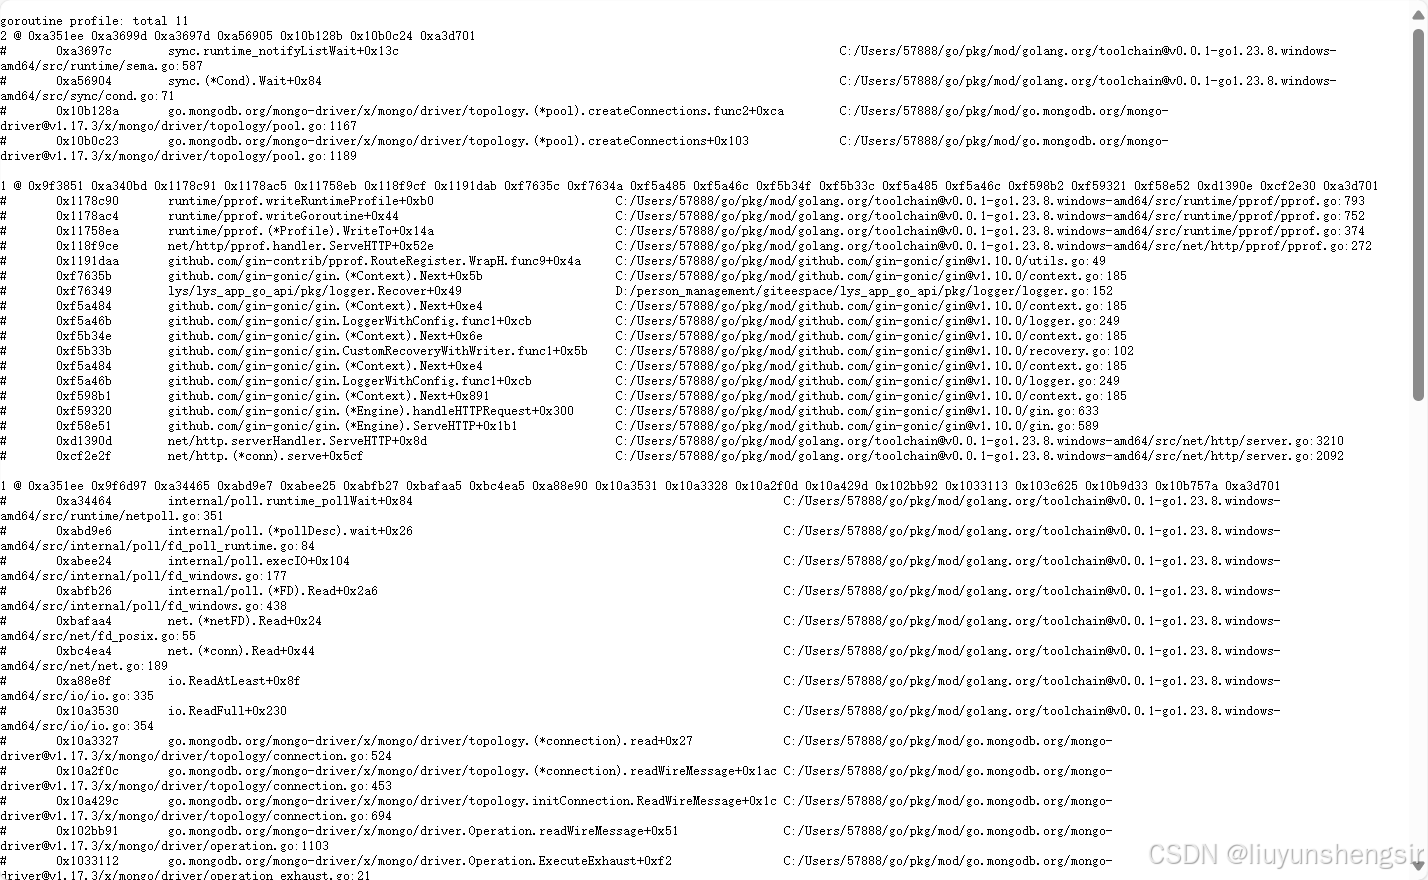
http://localhost:8080/debug/pprof/goroutine?debug=1
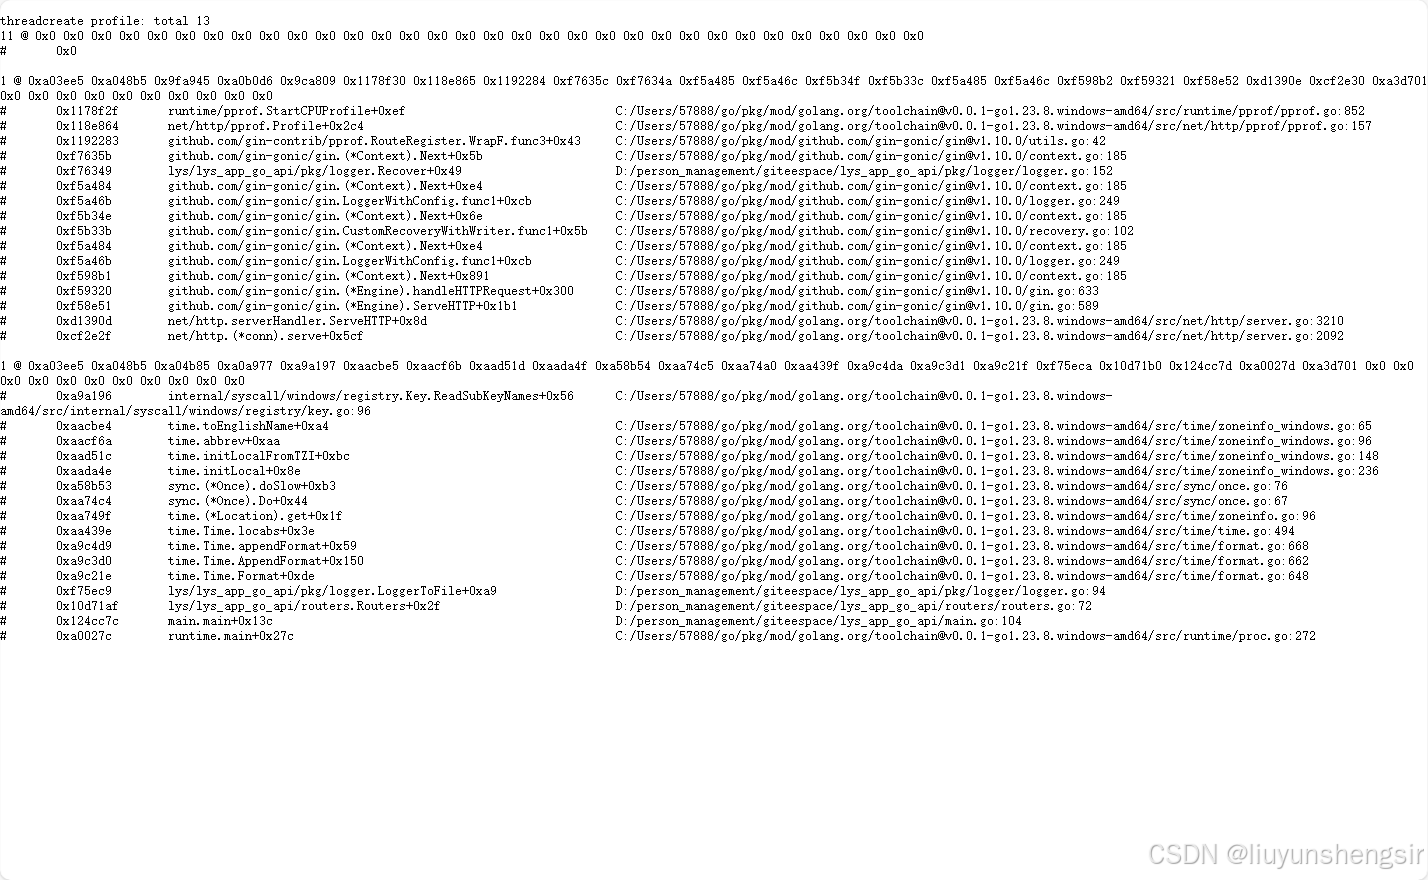
http://localhost:8080/debug/pprof/threadcreate?debug=1
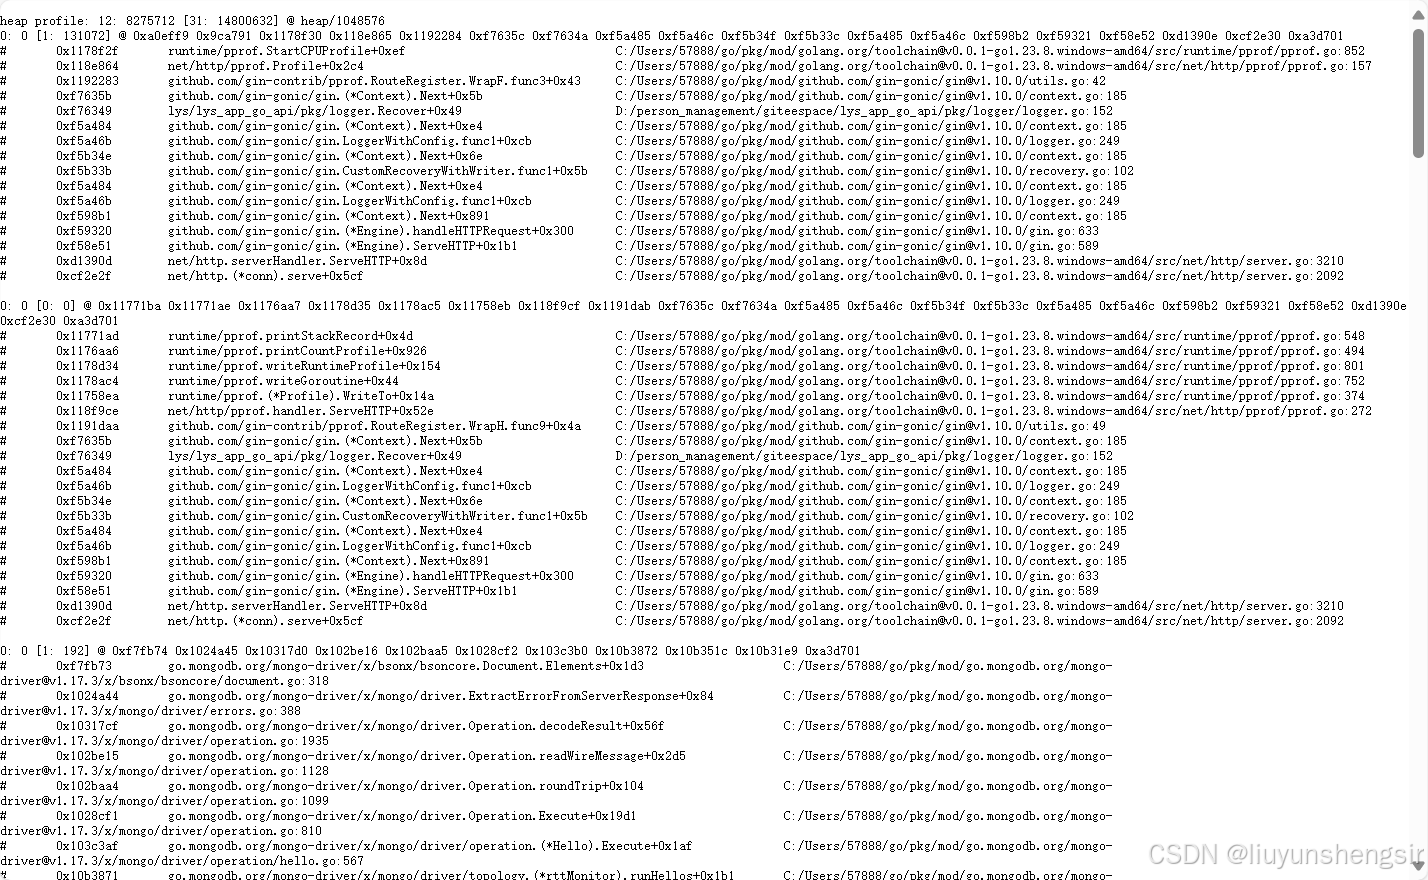
http://localhost:8080/debug/pprof/heap?debug=1
交互分析
cpu情况
go tool pprof http://localhost:8080/debug/pprof/profile?seconds=60
go tool pprof http://0.0.0.0:8080/debug/pprof/profile
Fetching profile over HTTP from http://0.0.0.0:8080/debug/pprof/profile
Saved profile in C:\Users\57888\pprof\pprof.main.exe.samples.cpu.002.pb.gz
File: main.exe
Build ID: C:\Users\57888\AppData\Local\Temp\go-build3667894591\b001\exe\main.exe2025-04-08 10:36:15.8743702 +0800 CST
Type: cpu
Time: Apr 8, 2025 at 10:50am (CST)
Duration: 30s, Total samples = 0
No samples were found with the default sample value type.
Try "sample_index" command to analyze different sample values.
Entering interactive mode (type "help" for commands, "o" for options)
(pprof) web
failed to execute dot. Is Graphviz installed? Error: exec: "dot": executable file not found in %PATH%
(pprof)
PS D:\person_management\giteespace\lys_app_go_api> go tool pprof http://localhost:8080/debug/pprof/profile?seconds=60
Fetching profile over HTTP from http://localhost:8080/debug/pprof/profile?seconds=60
Saved profile in C:\Users\57888\pprof\pprof.main.exe.samples.cpu.004.pb.gz
File: main.exe
Build ID: C:\Users\57888\AppData\Local\Temp\go-build3667894591\b001\exe\main.exe2025-04-08 10:36:15.8743702 +0800 CST
Type: cpu
Time: Apr 8, 2025 at 11:11am (CST)
Duration: 60s, Total samples = 30ms ( 0.05%)
Entering interactive mode (type "help" for commands, "o" for options)
(pprof) top
Showing nodes accounting for 30ms, 100% of 30ms total
Showing top 10 nodes out of 31
      flat  flat%   sum%        cum   cum%
      10ms 33.33% 33.33%       10ms 33.33%  runtime.cgocall
      10ms 33.33% 66.67%       10ms 33.33%  runtime.getitab
      10ms 33.33%   100%       10ms 33.33%  runtime.nextFreeFast
         0     0%   100%       10ms 33.33%  go.mongodb.org/mongo-driver/x/mongo/driver.Operation.Execute
         0     0%   100%       10ms 33.33%  go.mongodb.org/mongo-driver/x/mongo/driver.Operation.ExecuteExhaust
         0     0%   100%       10ms 33.33%  go.mongodb.org/mongo-driver/x/mongo/driver.Operation.roundTrip
         0     0%   100%       10ms 33.33%  go.mongodb.org/mongo-driver/x/mongo/driver/operation.(*Hello).Execute
         0     0%   100%       10ms 33.33%  go.mongodb.org/mongo-driver/x/mongo/driver/operation.(*Hello).StreamResponse
         0     0%   100%       10ms 33.33%  go.mongodb.org/mongo-driver/x/mongo/driver/topology.(*Server).check
         0     0%   100%       10ms 33.33%  go.mongodb.org/mongo-driver/x/mongo/driver/topology.(*Server).update
内存情况
PS D:\person_management\giteespace\lys_app_go_api> go tool pprof http://localhost:8080/debug/pprof/heap
Fetching profile over HTTP from http://localhost:8080/debug/pprof/heap
Saved profile in C:\Users\57888\pprof\pprof.main.exe.alloc_objects.alloc_space.inuse_objects.inuse_space.001.pb.gz
File: main.exe
Build ID: C:\Users\57888\AppData\Local\Temp\go-build3667894591\b001\exe\main.exe2025-04-08 10:36:15.8743702 +0800 CST
Type: inuse_space
Time: Apr 8, 2025 at 11:27am (CST)
Entering interactive mode (type "help" for commands, "o" for options)
(pprof) top
Showing nodes accounting for 11488.81kB, 100% of 11488.81kB total
Showing top 10 nodes out of 32
      flat  flat%   sum%        cum   cum%
10431.27kB 90.80% 90.80% 10431.27kB 90.80%  golang.org/x/net/webdav.(*memFile).Write
  544.67kB  4.74% 95.54%   544.67kB  4.74%  github.com/xdg-go/stringprep.map.init.2
  512.88kB  4.46%   100%   512.88kB  4.46%  sync.(*Map).LoadOrStore
         0     0%   100%  1347.38kB 11.73%  github.com/swaggo/files.init.10
         0     0%   100%  1197.01kB 10.42%  github.com/swaggo/files.init.11
         0     0%   100%  1588.17kB 13.82%  github.com/swaggo/files.init.12
         0     0%   100%   683.75kB  5.95%  github.com/swaggo/files.init.13
         0     0%   100%   794.19kB  6.91%  github.com/swaggo/files.init.14
         0     0%   100%   645.97kB  5.62%  github.com/swaggo/files.init.16
         0     0%   100%   664.70kB  5.79%  github.com/swaggo/files.init.18
web 可视化
go tool pprof -http=":8090" http://localhost:8080/debug/pprof/profile
需要安装 Graphviz
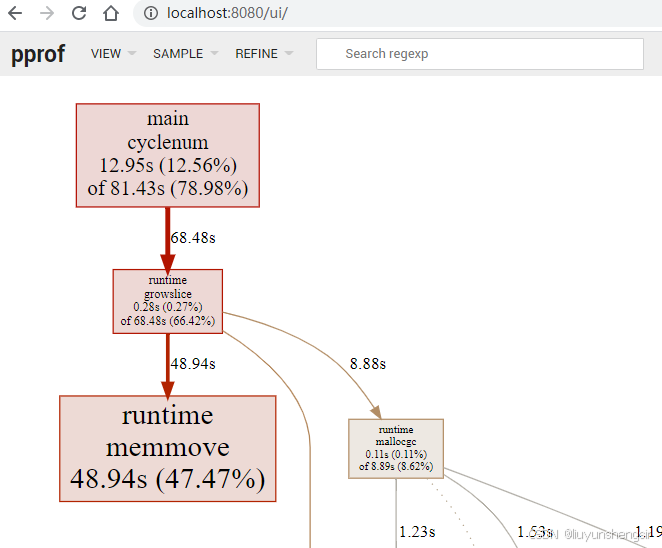
也可在线
总结
pprof 是 Go 语言开发中不可或缺的性能分析工具,它能帮助开发者深入了解程序的性能瓶颈,从而有针对性地进行优化,提高程序的性能和稳定性。