前言
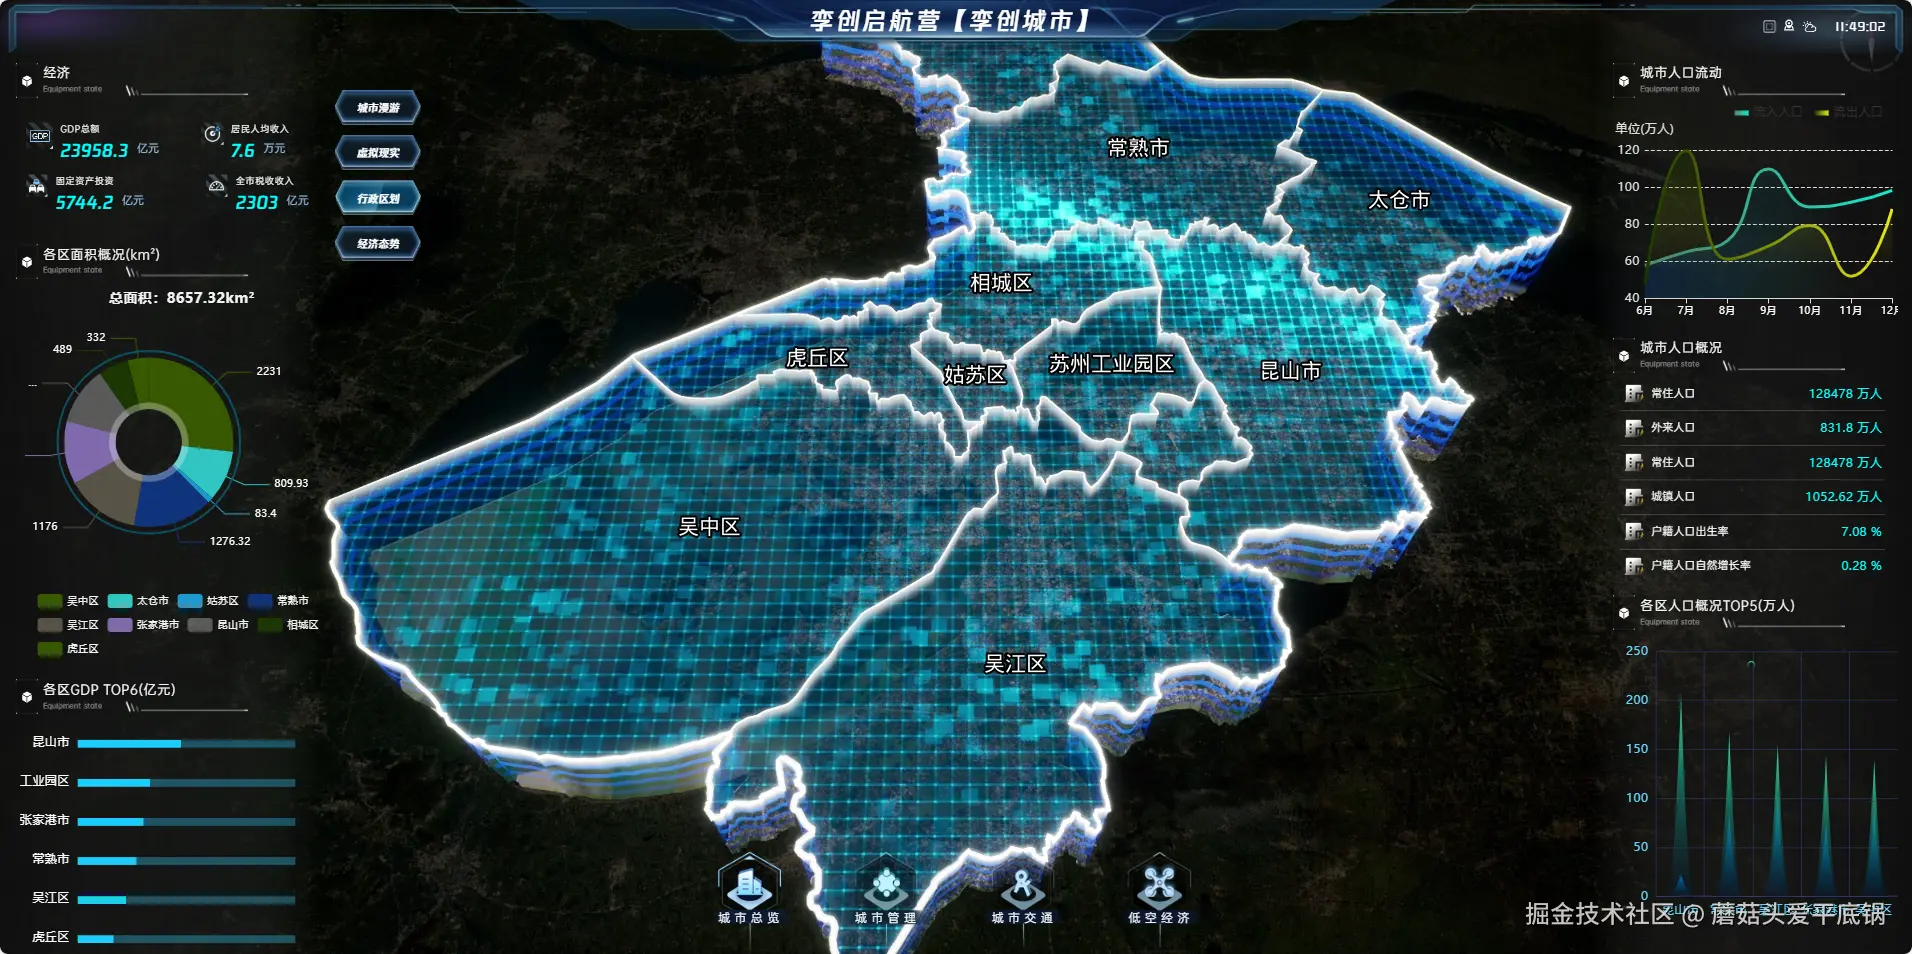
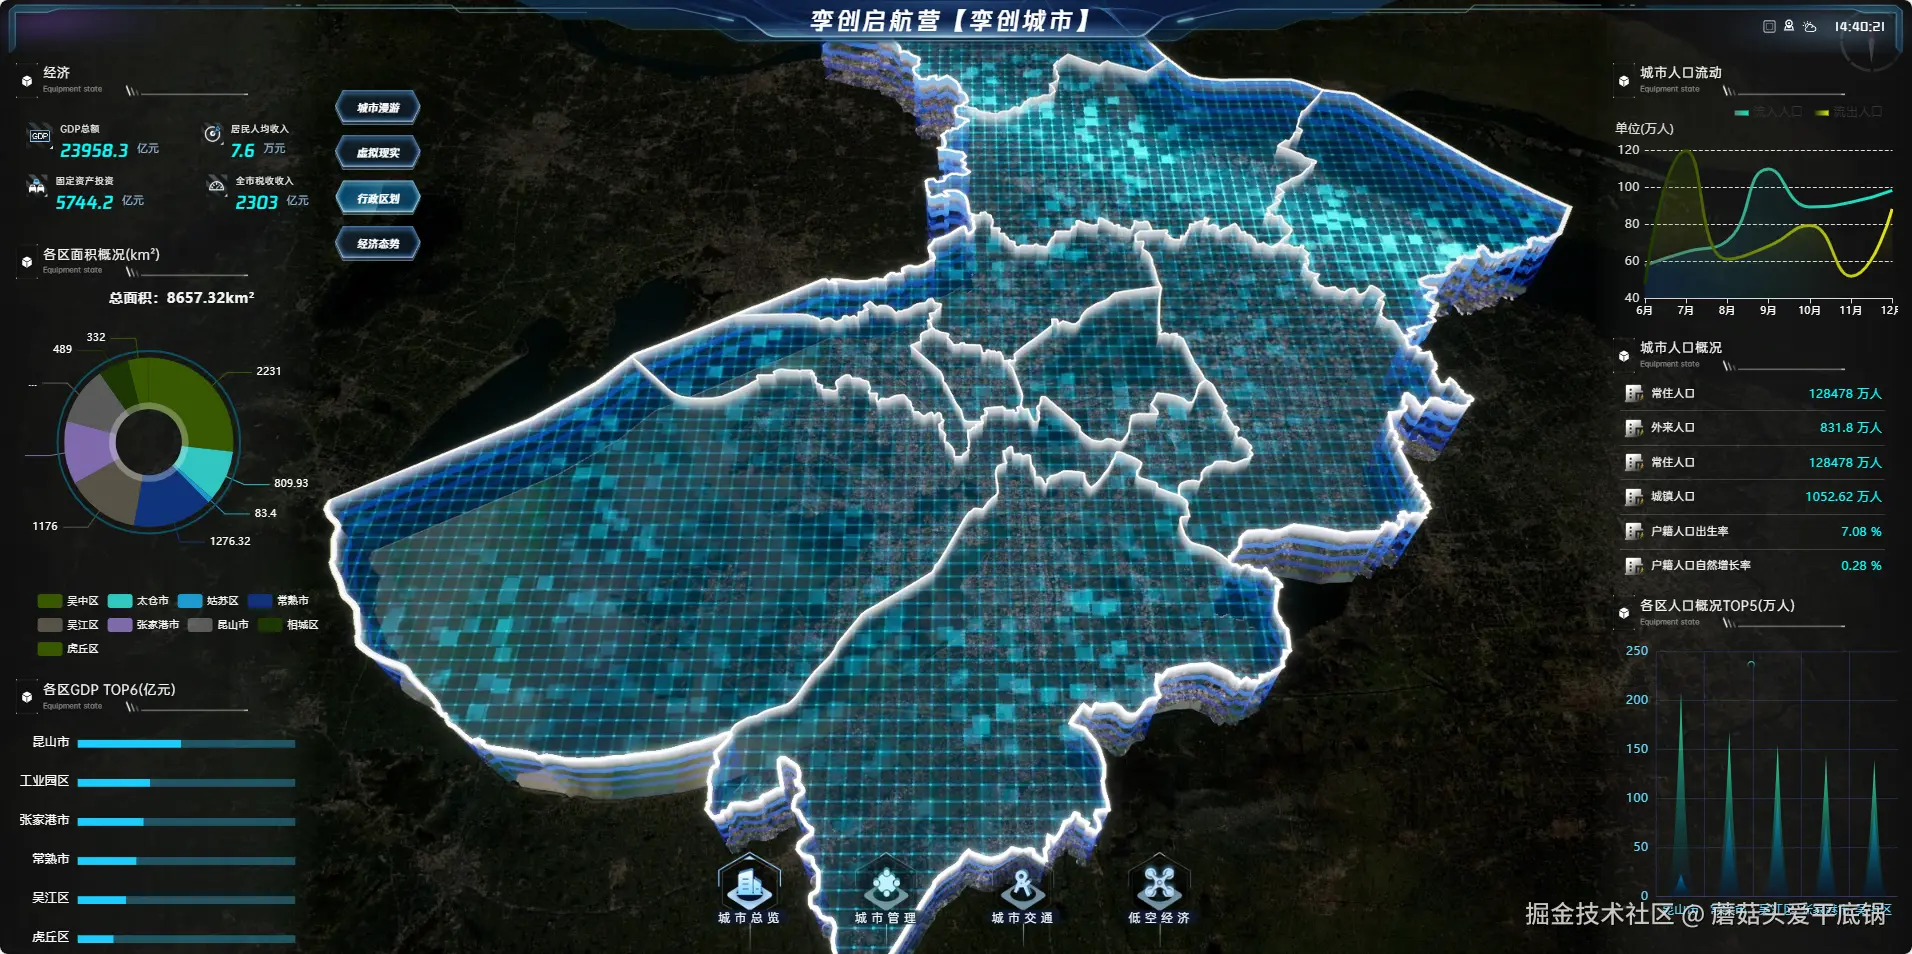
接下里我们实现一个重量级的内容,就是像这样子的行政区划分,十分的炫酷,非常的有科技风格,OK,废话少说,快来一起看看是如何实现的。
思路
这是一个较为复杂的需求,所以我们将这个功能分成4块内容。
- 首先可以看的见的就是我们的相机视角提升了。
- 接下来就是我们的一个样式发生了变化,场景变暗了,并且我们的手工模型被隐藏了,其次就是我们的地形影像亮度提高了
- 接下里就是一个市边界的一个绘制
- 然后是区县边界的绘制
- 然后就是行政区名称
一共5点内容。
步骤一
首先第一个步骤,改变相机视角,同样可以使用上篇文章提供的方法获取相机视角参数,这里我就不做过多的赘述。
c
fdapi.camera.set(cameraParam);步骤二
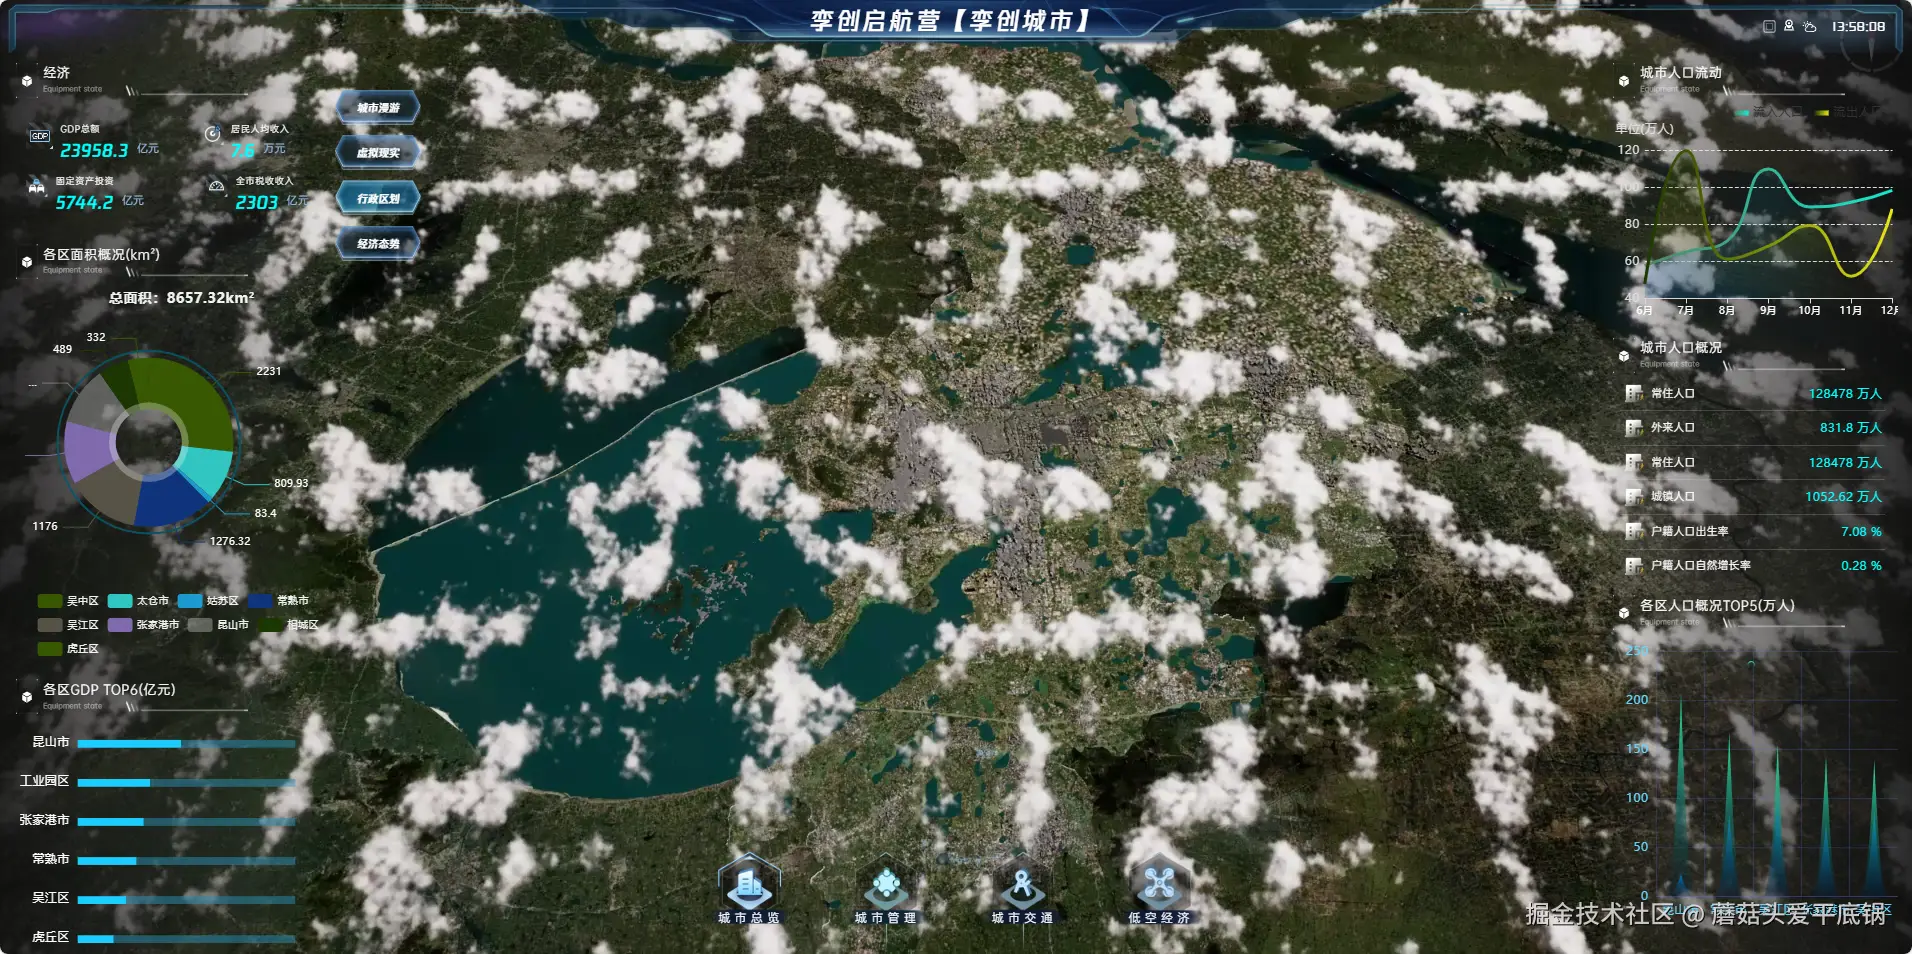
调整场景亮度,这里可以打开我们的暗黑模式。
arduino
fdapi.weather.setDarkMode(true)隐藏我们的手工模型,这里需要获取到所有的手工模型,包括一些cim2建筑,和一些水系,还记得我们在全局状态管理库中已经获取到了吗?这里我们直接拿来用即可。
ini
import {useDigitalTwinStore} from '@/stores/digitalTwin'
const digitalTwinStore = useDigitalTwinStore()
const hideLayer = ['手工模型', 'cim2建筑', '苏州地形影像_Water']
fdapi.infoTree.hide(hideLayer.map(name => digitalTwinStore.digitalTwin[name]))
接下来就是调整地形影像的亮度了,也是需要先拿到我们的对应的图层,不过我们已经获取到了,所以我们可以直接从paina中拿。
csharp
fdapi.tileLayer.setStyle(digitalTwinStore.digitalTwin['大地形影像'], null, null, null, 0.1)
fdapi.tileLayer.setStyle(digitalTwinStore.digitalTwin['苏州地形影像_Terrain'], null, null, null, 0.5)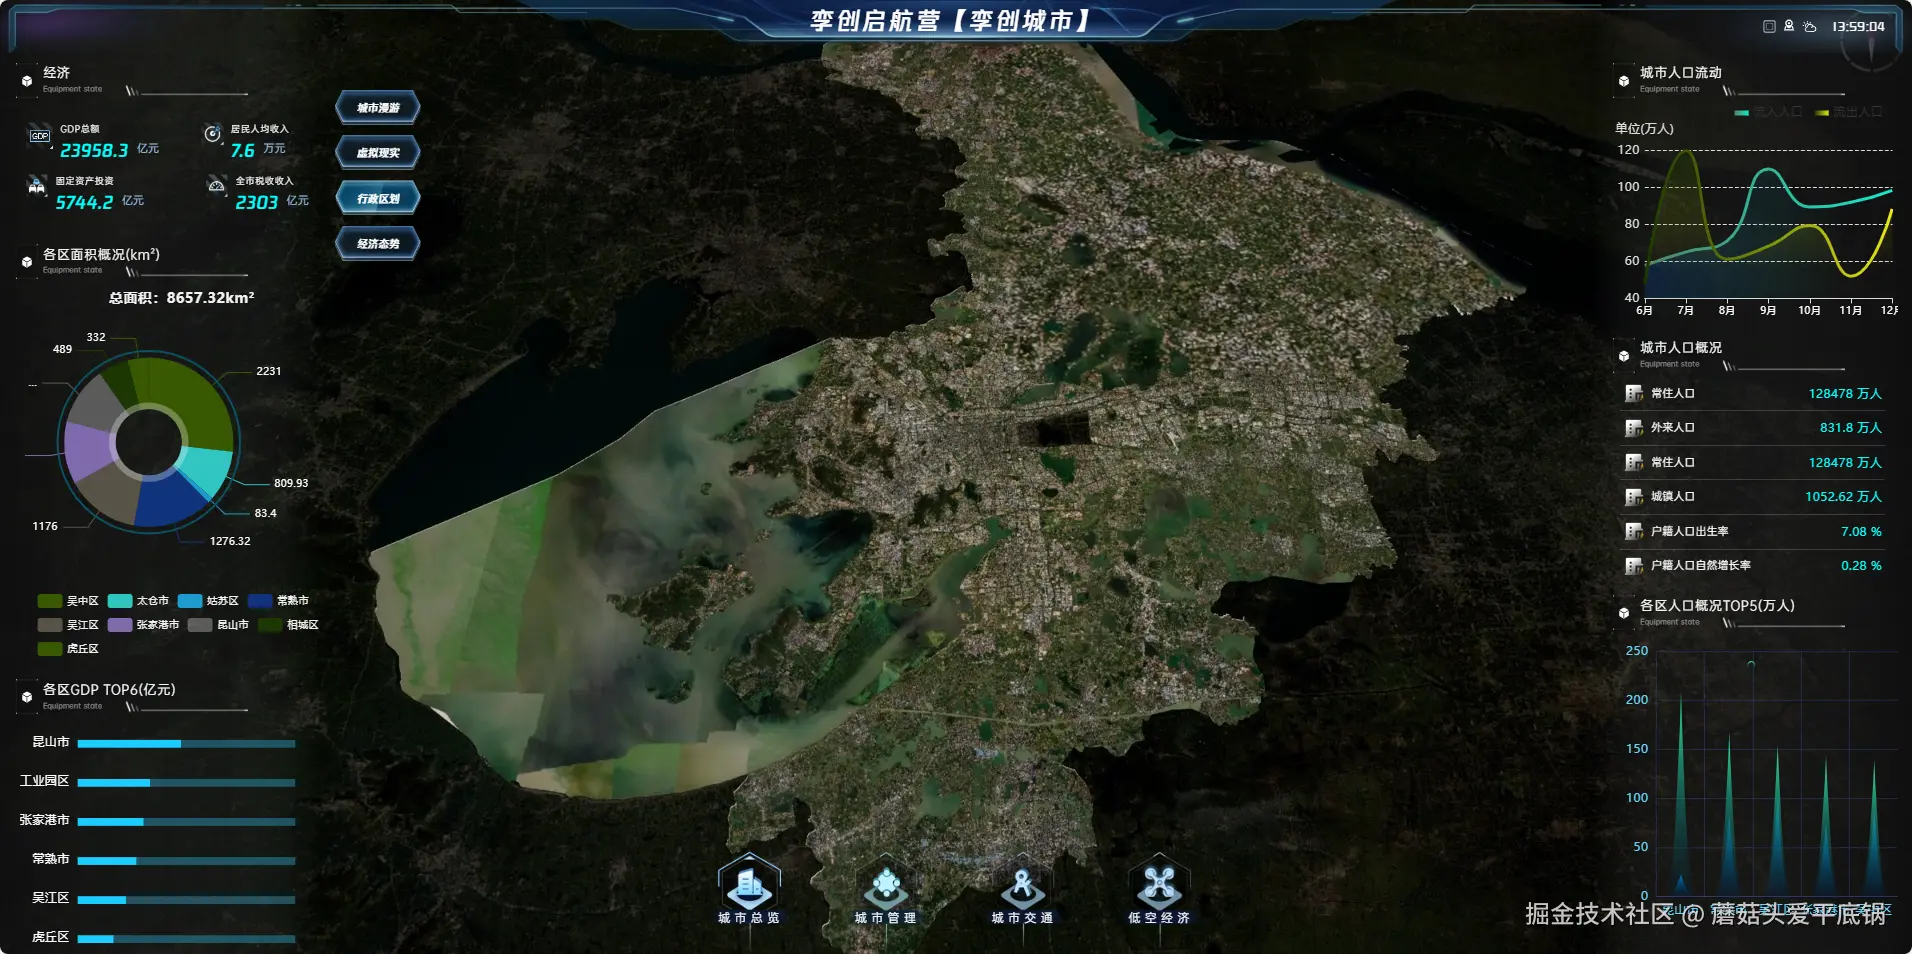
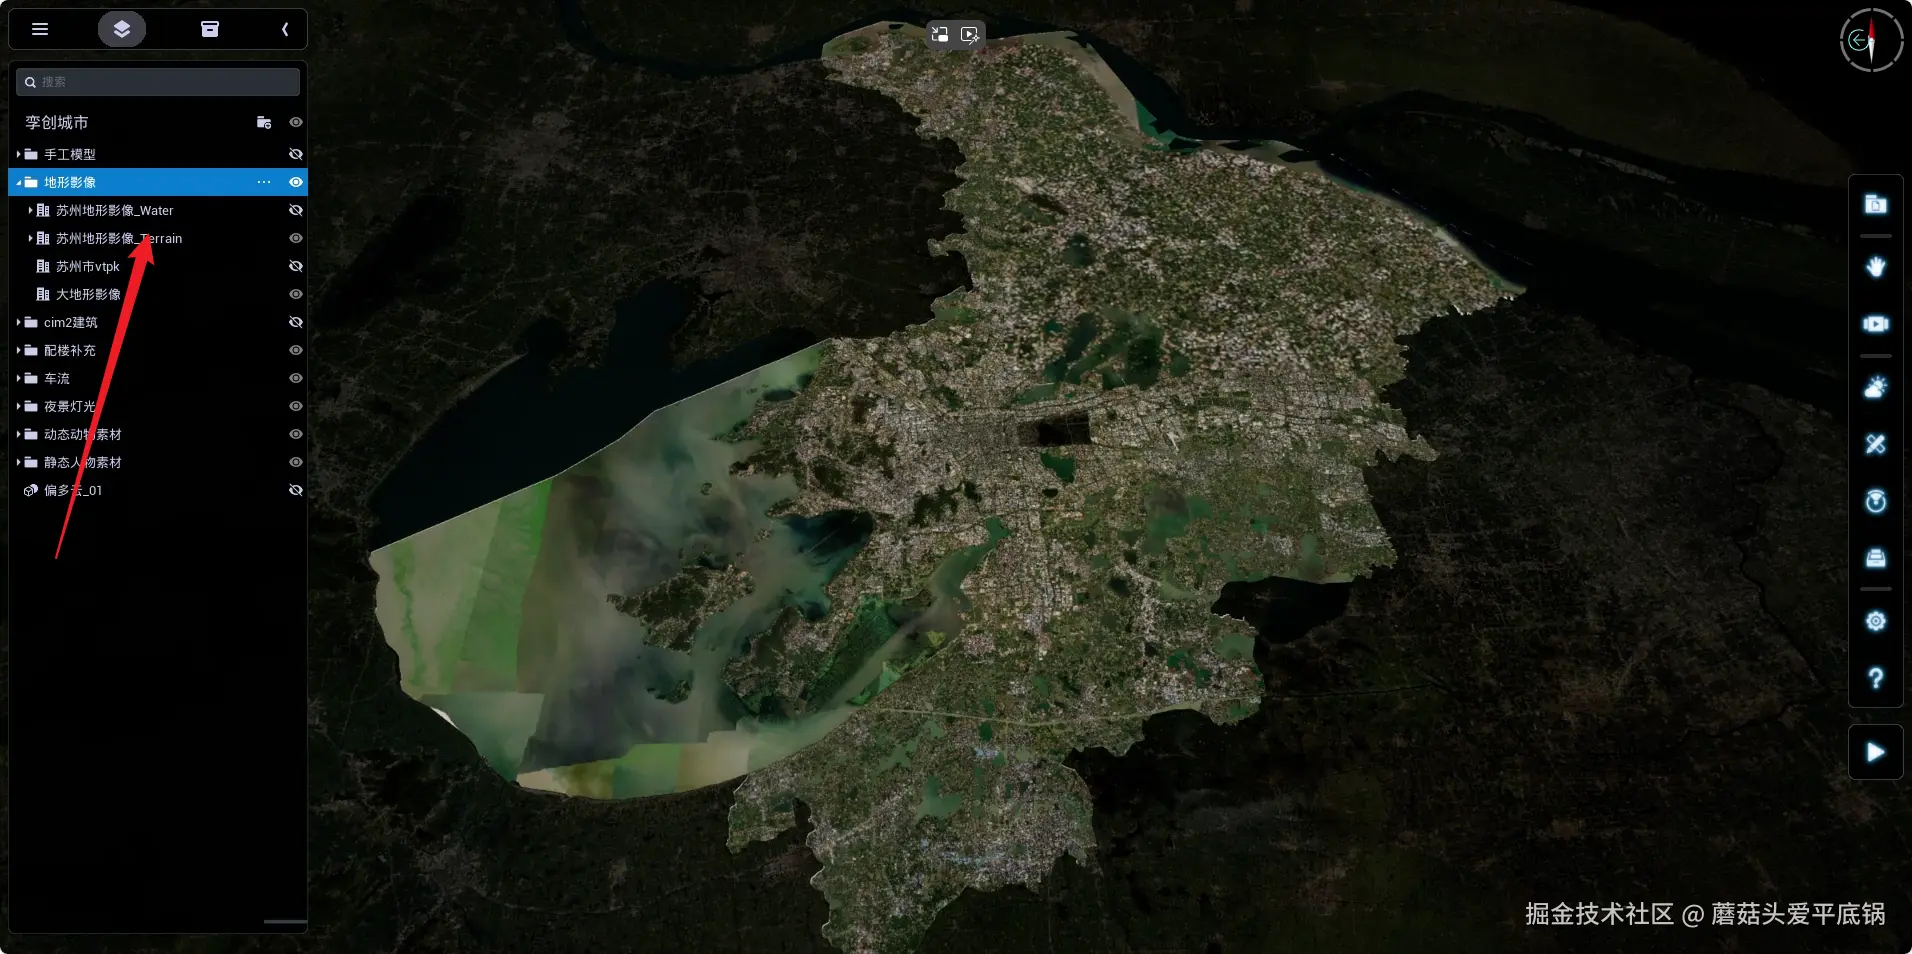
这些地形影像图层数据其实就是我们这里的数据。
步骤三
市边界的一个绘制,首先我们必须先拿到这么一个市边界的数据,这些数据都是geojson的格式,所以我们通过axios请求来获取,其实这些数据早就放在了我们的data目录下面,包括我们的市界,区界等等,打开就可以看见一些点位信息。
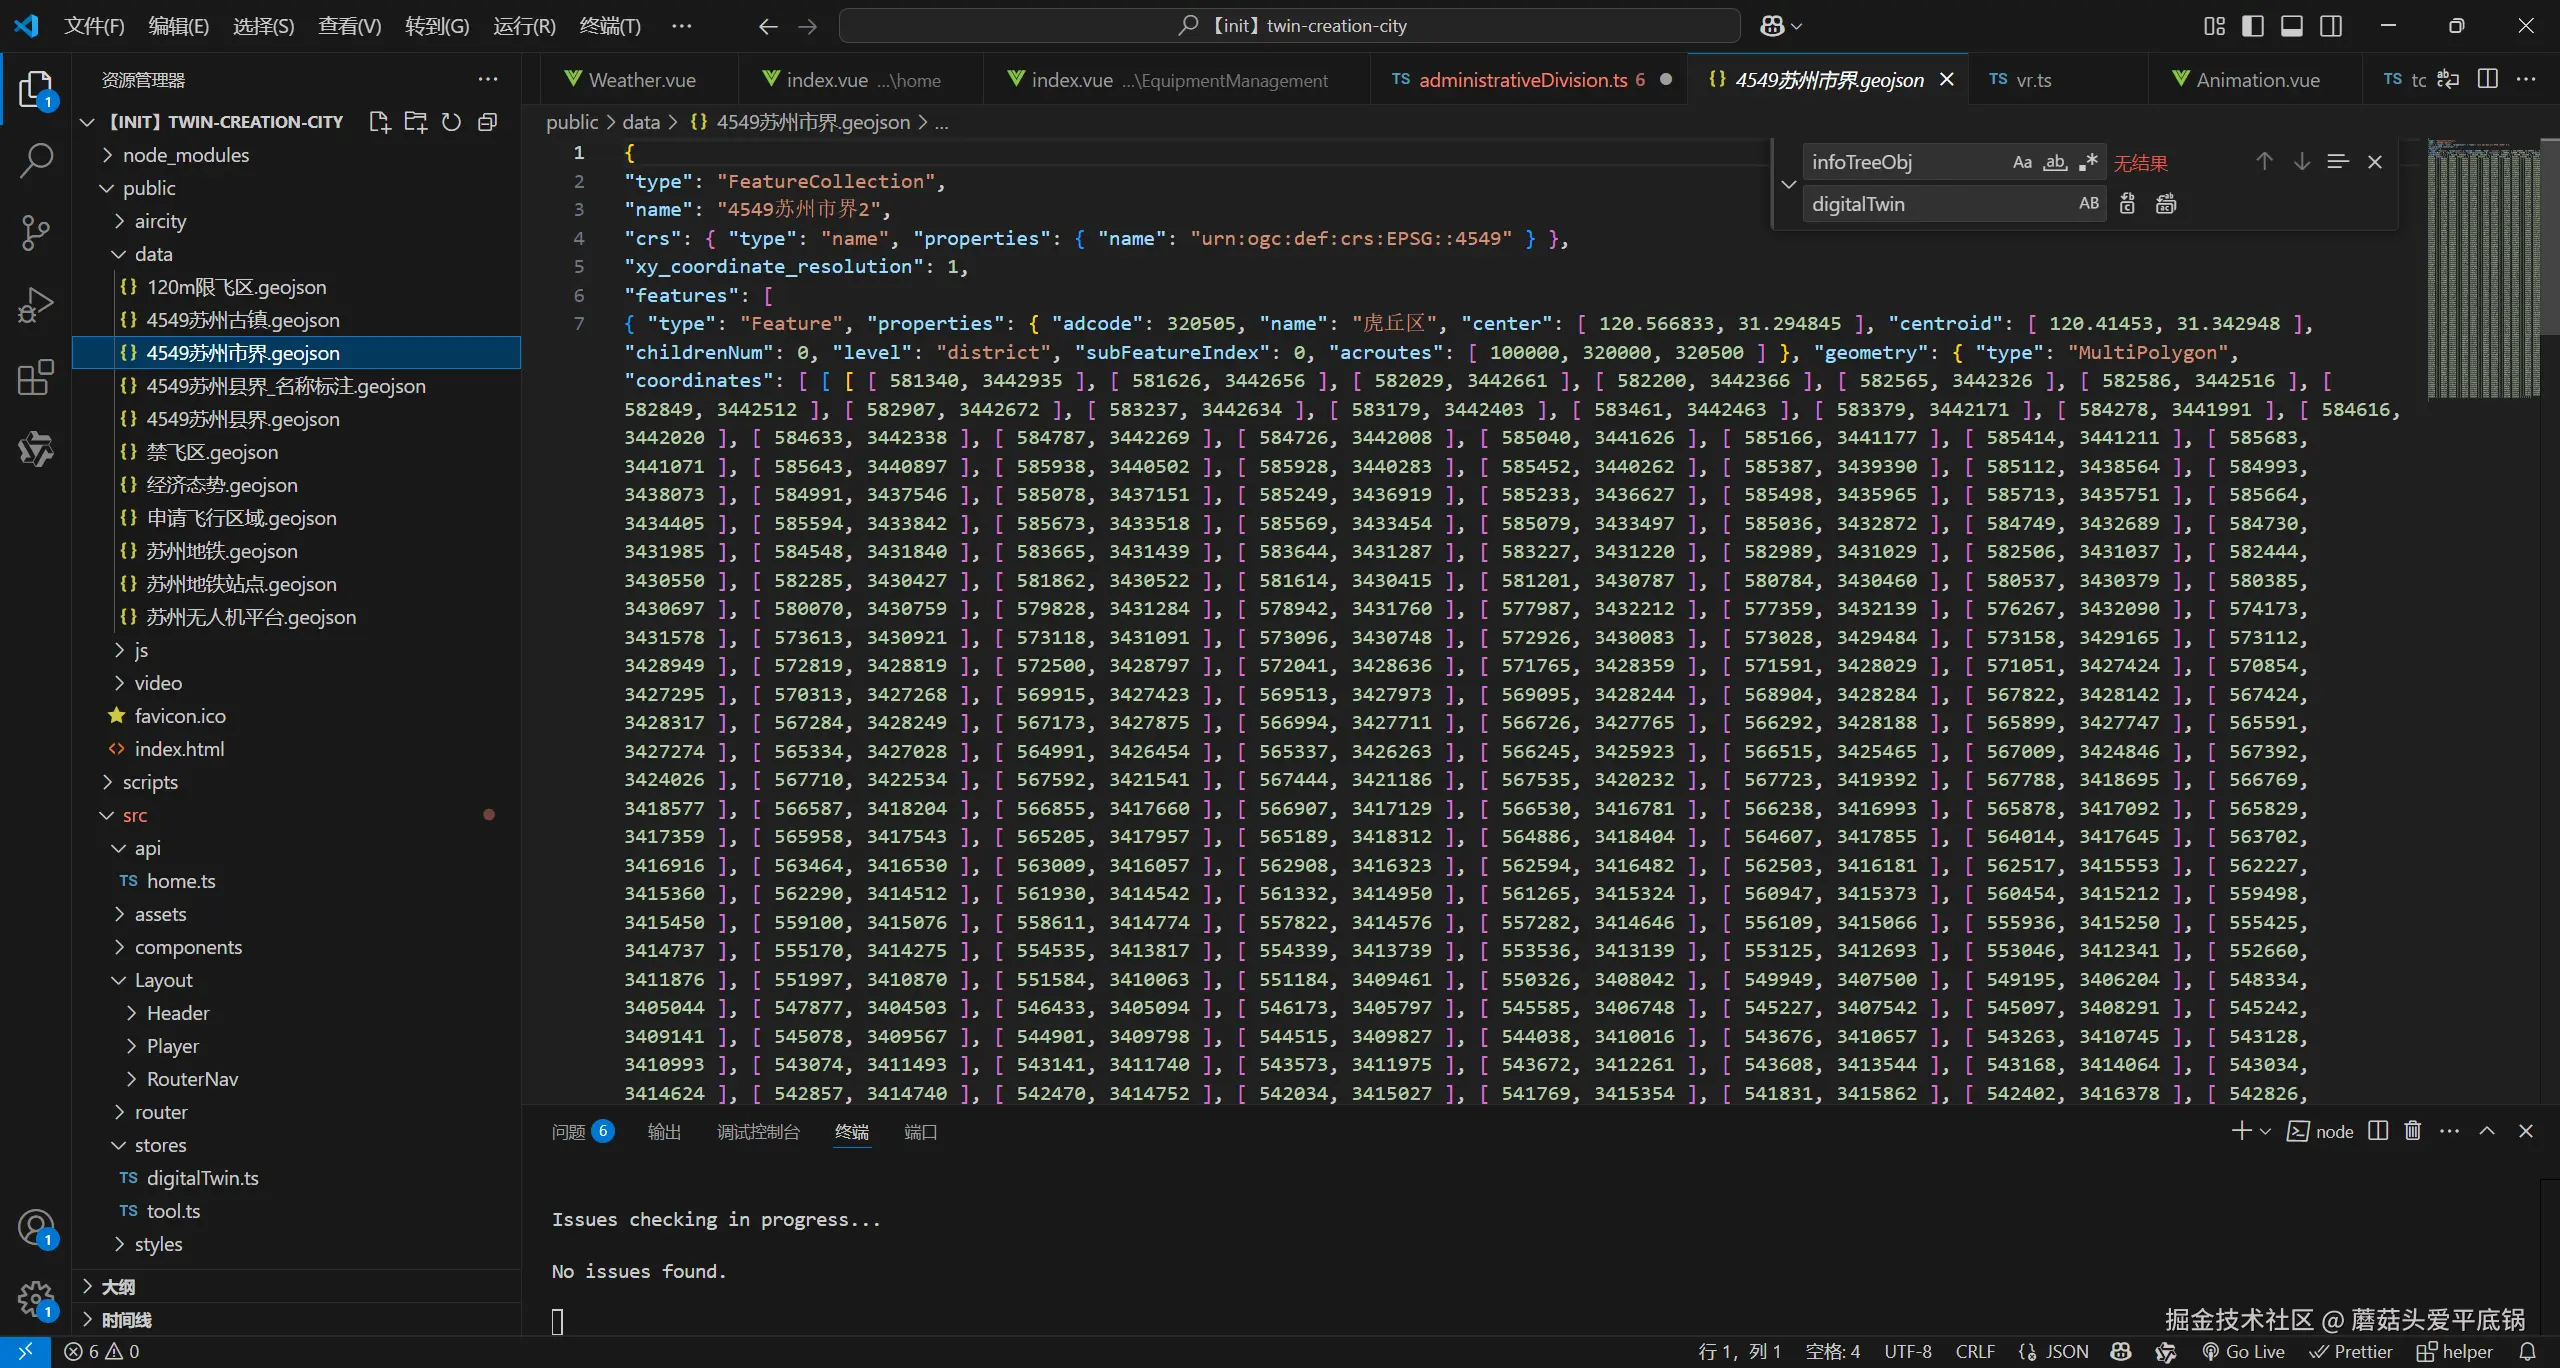
获取这些数据的api我们早就封装好了,直接引入即可。获取完市界的数据之后,就可以使用飞渡api的Polygon了,他主要是用来绘制一些面的操作,包括设置颜色,可视范围,可见高度,设置边框,多边形样式等等,这个大家科技参考飞渡的api文档。
接下来我们先绘制顶面,首先获取到点位信息,然后配置data对象,然后使用添加polygon对象即可完成绘制。
less
 const { data } = await getAdministrativeDivisionCity()// 获取到点位信息
  // a.顶面  b.顶面边框  c.立体围墙
  const coordinates = data.features[0].geometry.coordinates[0][0]

  const city_polygon = {
    id: 'city_polygon',
    coordinates: coordinates.map((coord: number[]) => [coord[0], coord[1], height - 1]),
    coordinateType: 0, //坐标系类型,取值范围:0为Projection类型,1为WGS84类型,2为火星坐标系(GCJ02),3为百度坐标系(BD09),默认值:0
    range: [1, 10000000], //可视范围:[近裁距离, 远裁距离],取值范围: [任意负值, 任意正值]
    color: [5 / 255, 50 / 255, 74 / 255, 0.6], //多边形的填充颜色
    intensity: 1, //亮度
    style: 0, //单色 请参照API开发文档选取枚举
    depthTest: false, //是否做深度检测 开启后会被地形高度遮挡
    priority: 1 //显示优先级 值越大显示越靠上
  }
  fdapi.polygon.add([city_polygon])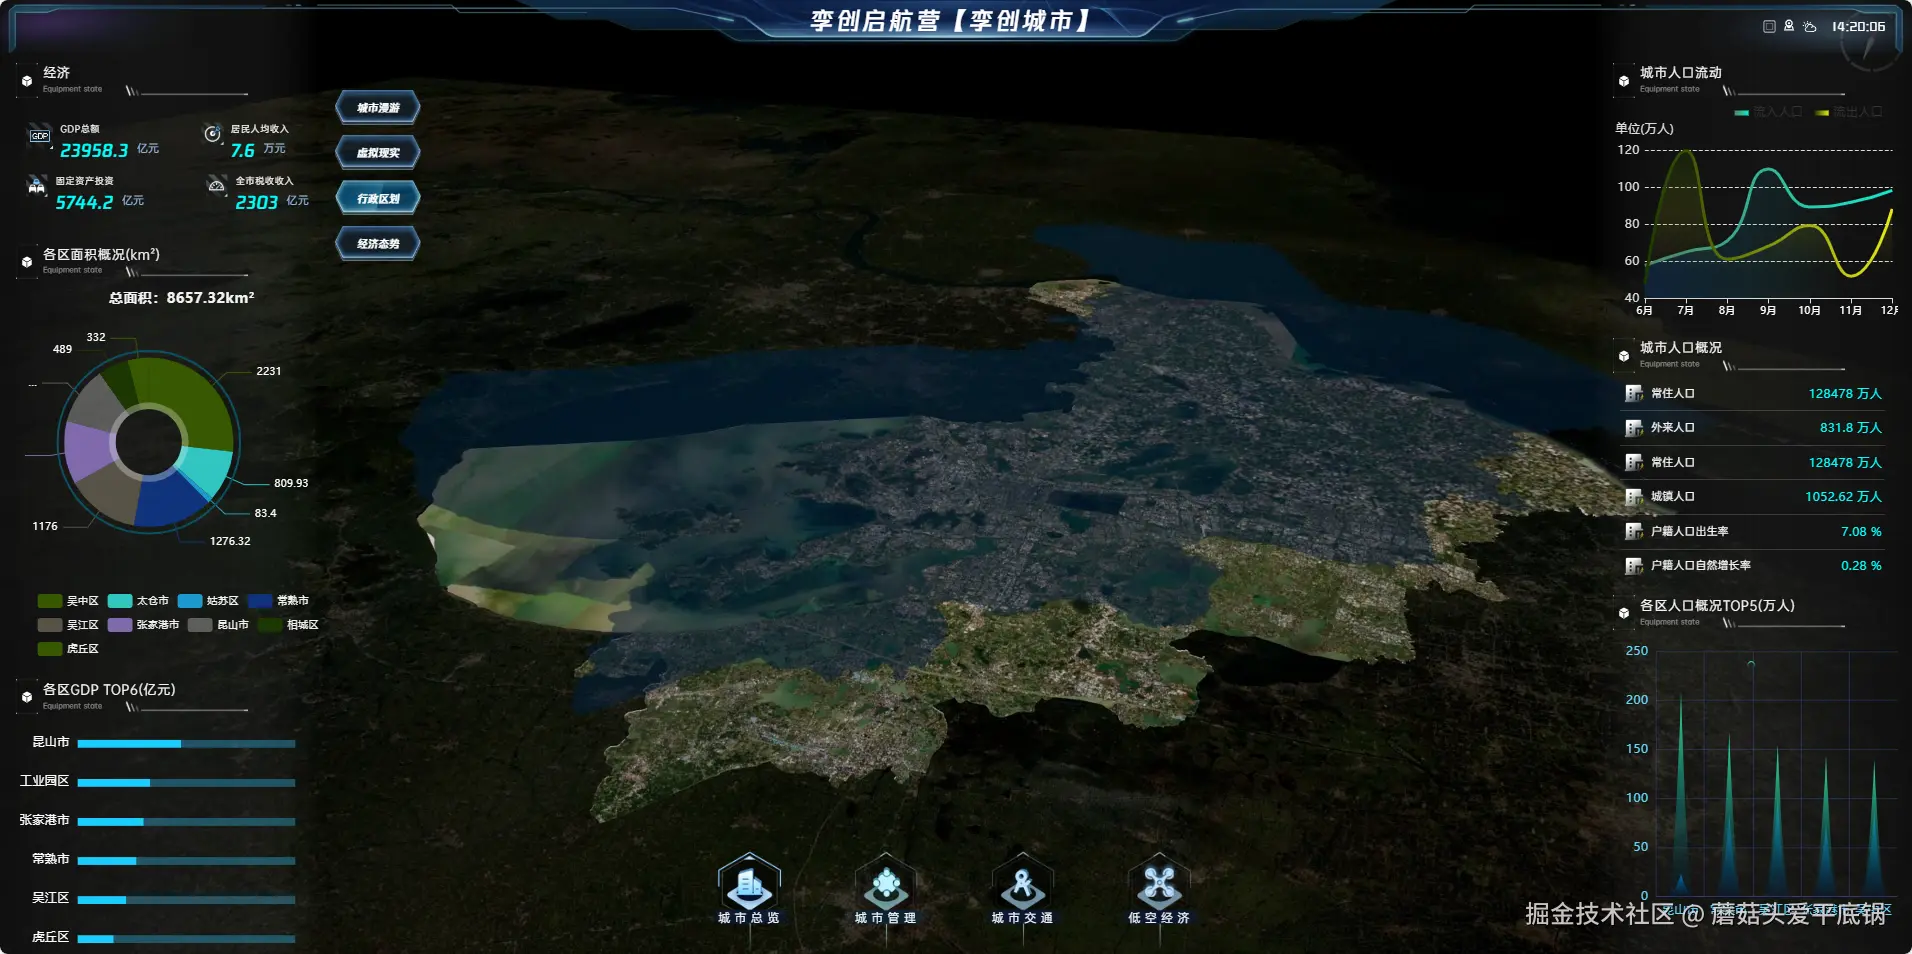
接下来只需要多绘制几个面就可以了,其中包括顶面动态样式,顶面边框,顶面边框动态样式,这是完整的配置。
less
  const city_polygon = {
    id: 'city_polygon',
    coordinates: coordinates.map((coord: number[]) => [coord[0], coord[1], height - 1]),
    coordinateType: 0, //坐标系类型,取值范围:0为Projection类型,1为WGS84类型,2为火星坐标系(GCJ02),3为百度坐标系(BD09),默认值:0
    range: [1, 10000000], //可视范围:[近裁距离, 远裁距离],取值范围: [任意负值, 任意正值]
    color: [5 / 255, 50 / 255, 74 / 255, 0.6], //多边形的填充颜色
    intensity: 1, //亮度
    style: 0, //单色 请参照API开发文档选取枚举
    depthTest: false, //是否做深度检测 开启后会被地形高度遮挡
    priority: 1 //显示优先级 值越大显示越靠上
  }
  const city_polygon_dynamic = {
    id: 'city_polygon_dynamic',
    coordinates: coordinates.map((coord: number[]) => [coord[0], coord[1], height]),
    coordinateType: 0, //坐标系类型,取值范围:0为Projection类型,1为WGS84类型,2为火星坐标系(GCJ02),3为百度坐标系(BD09),默认值:0
    range: [1, 10000000], //可视范围:[近裁距离, 远裁距离],取值范围: [任意负值, 任意正值]
    intensity: 1, //亮度
    depthTest: false, //是否做深度检测 开启后会被地形高度遮挡
    priority: 1, //显示优先级 值越大显示越靠上
    material: '/JC_CustomAssets/PolygonLibrary/Exhibition/平面混合_2', //自定义材质路径 设置后style相关参数会失效
    scalarParameters: [
      { name: '亮条U速度', value: 0.1 },
      { name: '亮条V速度', value: 0.1 },
      { name: '亮条UV', value: 0.25 },
      { name: '亮条亮度', value: 10 },
      { name: '亮条旋转', value: 0.33 },
      { name: '亮度', value: 2 },
      { name: 'UV缩放', value: 0.001 },
      { name: '不透明度', value: 0.01 }
    ], //材质数值类型参数
    vectorParameters: [{ name: '颜色', value: [19 / 255, 204 / 255, 255 / 255] }] //材质数组类型参数
  }
  fdapi.polygon.add([city_polygon,city_polygon_dynamic])// 添加面

  const city_border = {
    id: 'city_border', //折线唯一标识id
    coordinates: coordinates.map((coord: number[]) => [coord[0], coord[1], height]),
    coordinateType: 0, //坐标系类型,取值范围:0为Projection类型,1为WGS84类型,2为火星坐标系(GCJ02),3为百度坐标系(BD09),默认值:0
    range: [1, 10000000], //可视范围:[近裁距离, 远裁距离],取值范围: [任意负值, 任意正值]
    color: [1, 1, 1, 1], //折线颜色
    thickness: 300, //折线宽度
    intensity: 10, //亮度
    flowRate: 0.1, //流速
    shape: 0, //折线类型 0:直线, 1:曲线
    depthTest: false, //是否做深度检测 开启后会被地形高度遮挡
    style: 4, //折线样式 参考样式枚举:PolylineStyle
    tiling: 0.5 //材质贴图平铺比例
  }
  const city_border_dynamic = {
    id: 'city_border_dynamic', //折线唯一标识id
    coordinates: coordinates.map((coord: number[]) => [coord[0], coord[1], height]),
    coordinateType: 0, //坐标系类型,取值范围:0为Projection类型,1为WGS84类型,2为火星坐标系(GCJ02),3为百度坐标系(BD09),默认值:0
    range: [1, 10000000], //可视范围:[近裁距离, 远裁距离],取值范围: [任意负值, 任意正值]
    color: [1, 1, 1, 1], //折线颜色
    thickness: 600, //折线宽度
    intensity: 10, //亮度
    flowRate: 0.3, //流速
    shape: 0, //折线类型 0:直线, 1:曲线
    depthTest: false, //是否做深度检测 开启后会被地形高度遮挡
    style: 3, //折线样式 参考样式枚举:PolylineStyle
    tiling: 2 //材质贴图平铺比例
  }
  fdapi.polyline.add([city_border, city_border_dynamic])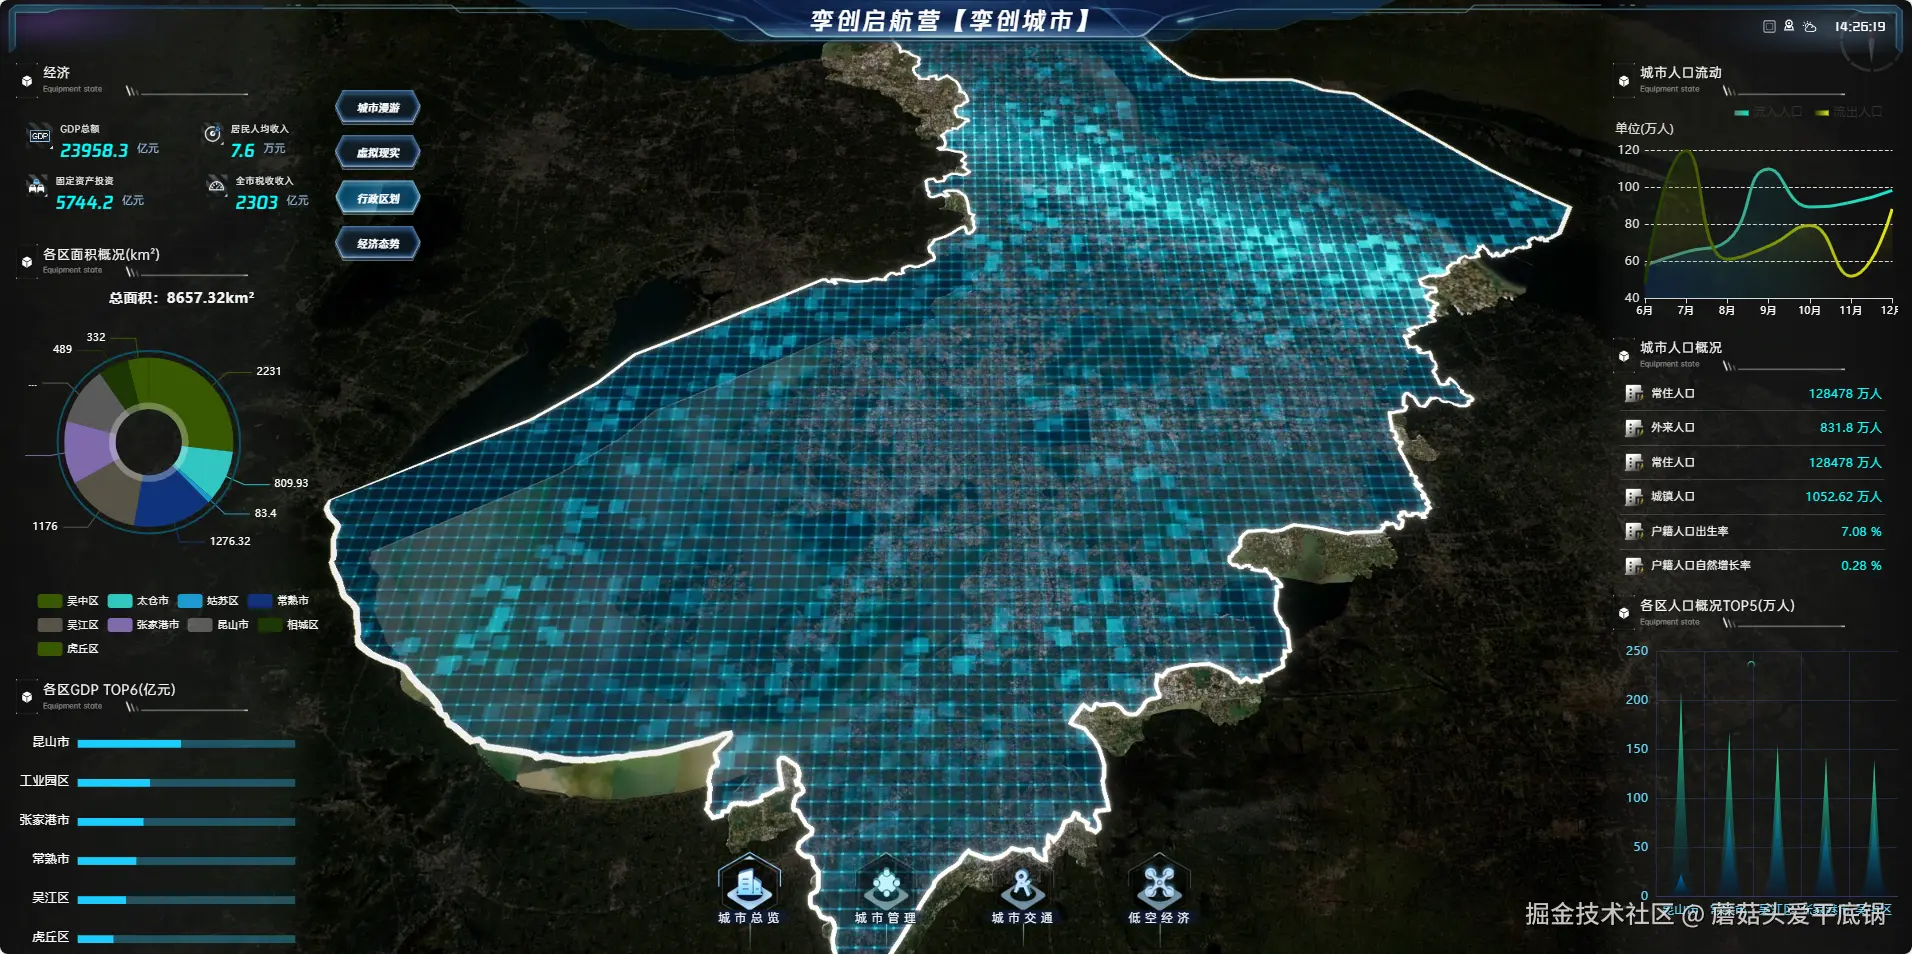
当我们的面添加完毕之后,就是添加侧边墙面了。这里会使用到飞渡的另一个类polygon3d,提供三维多边形相关的操作, 一般通过api.polygon3d调用其方法,通过配置一些样式就可以达到如下的效果。
less
let city_wall = {
    id: 'city_wall',
    coordinates: coordinates.map((coord: number[]) => [coord[0], coord[1], height]),
    coordinateType: 0, //坐标系类型,取值范围:0为Projection类型,1为WGS84类型,2为火星坐标系(GCJ02),3为百度坐标系(BD09),默认值:0
    color: '#215cca', //颜色值
    height: -height * 1.5, //3D多边形的高度
    intensity: 1.0, //亮度
    style: 4, //3DPolygon的样式 请参照API开发文档选取枚举
    tillingX: 0, //可选,仅当3DPolygon的样式支持贴图显示,贴图横向平铺
    tillingY: 0, //可选,仅当3DPolygon的样式支持贴图显示,贴图纵向平铺
    generateTop: false, //是否生成顶面
    generateSide: true, //是否生成侧面
    generateBottom: false //是否生成底面
  }
  fdapi.polygon3d.add(city_wall)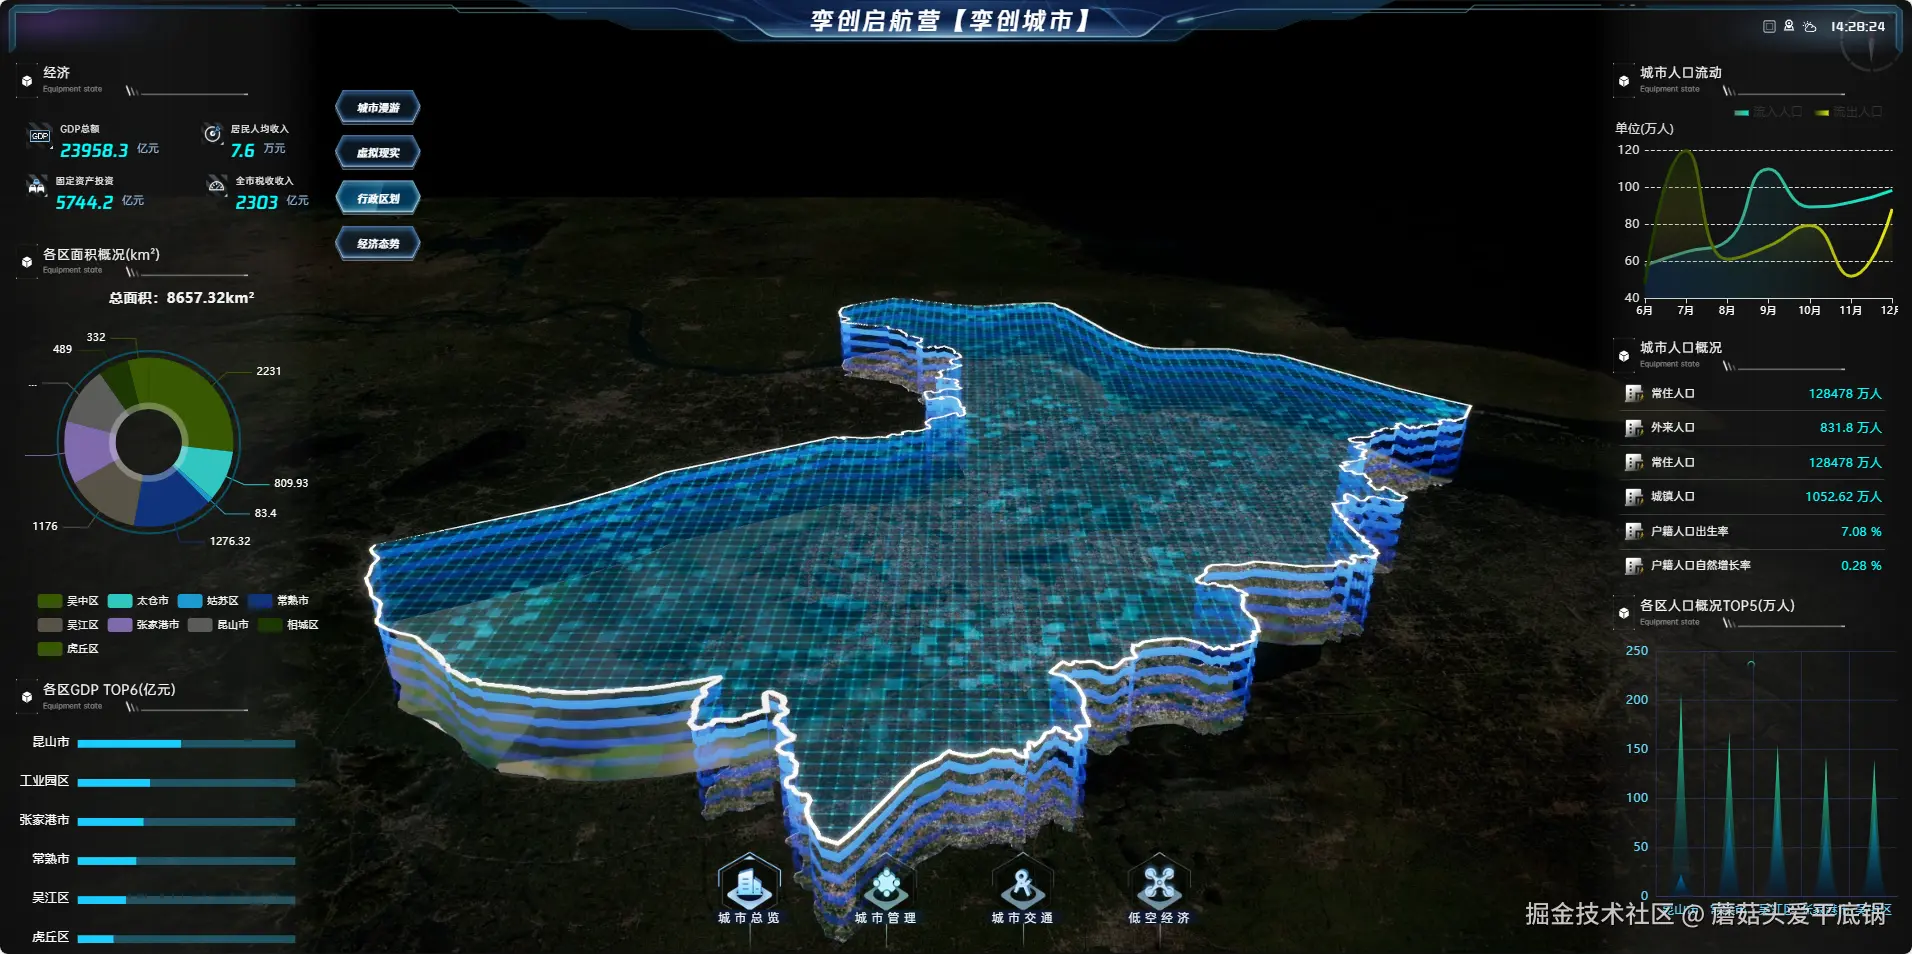
步骤四
接下来就是我们区县边界的一个绘制,这里跟市界绘制很类似,主要说一下思路,首先获取到区县边界的点位信息,然后通过polygon绘制一些面出来,分别是使用polygon绘制顶面,polygon3D绘制侧面。
typescript
const LayerIdObj: any = {
  polyline: [],
  polygon3d: []
}
// 4 绘制区县边界(行政区化)
const addCountyLayer = async () => {
  // a.行政区边框  b.行政区名称
  const { data } = await getAdministrativeDivisionCounty()

  const polylineList: any[] = []
  const WallList: any[] = []

  data.features.forEach((item: any, index: number) => {
    const coordinates = item.geometry.coordinates[0][0]

    const county_border_id = 'county_border_' + index
    LayerIdObj.polyline.push(county_border_id)
    const county_border = {
      id: county_border_id, //折线唯一标识id
      coordinates: coordinates.map((coord: number[]) => [coord[0], coord[1], height]),
      coordinateType: 0, //坐标系类型,取值范围:0为Projection类型,1为WGS84类型,2为火星坐标系(GCJ02),3为百度坐标系(BD09),默认值:0
      range: [1, 10000000], //可视范围:[近裁距离, 远裁距离],取值范围: [任意负值, 任意正值]
      color: [1, 1, 1, 1], //折线颜色
      thickness: 150, //折线宽度
      intensity: 10, //亮度
      flowRate: 0.1, //流速
      shape: 0, //折线类型 0:直线, 1:曲线
      depthTest: false, //是否做深度检测 开启后会被地形高度遮挡
      style: 4, //折线样式 参考样式枚举:PolylineStyle
      tiling: 0.5 //材质贴图平铺比例
    }
    polylineList.push(county_border)

    const county_wall_id = 'county_wall_' + index
    LayerIdObj.polygon3d.push(county_wall_id)
    let county_wall = {
      id: county_wall_id,
      coordinates: coordinates.map((coord: number[]) => [coord[0], coord[1], height]),
      coordinateType: 0, //坐标系类型,取值范围:0为Projection类型,1为WGS84类型,2为火星坐标系(GCJ02),3为百度坐标系(BD09),默认值:0
      color: '#ffffff', //颜色值
      height: -height * 0.5, //3D多边形的高度
      intensity: 1.0, //亮度
      style: 2, //3DPolygon的样式 请参照API开发文档选取枚举
      tillingX: 0, //可选,仅当3DPolygon的样式支持贴图显示,贴图横向平铺
      tillingY: 0, //可选,仅当3DPolygon的样式支持贴图显示,贴图纵向平铺
      generateTop: false, //是否生成顶面
      generateSide: true, //是否生成侧面
      generateBottom: false //是否生成底面
    }
    WallList.push(county_wall)
  })

  fdapi.polyline.add(polylineList)
  fdapi.polygon3d.add(WallList)
}
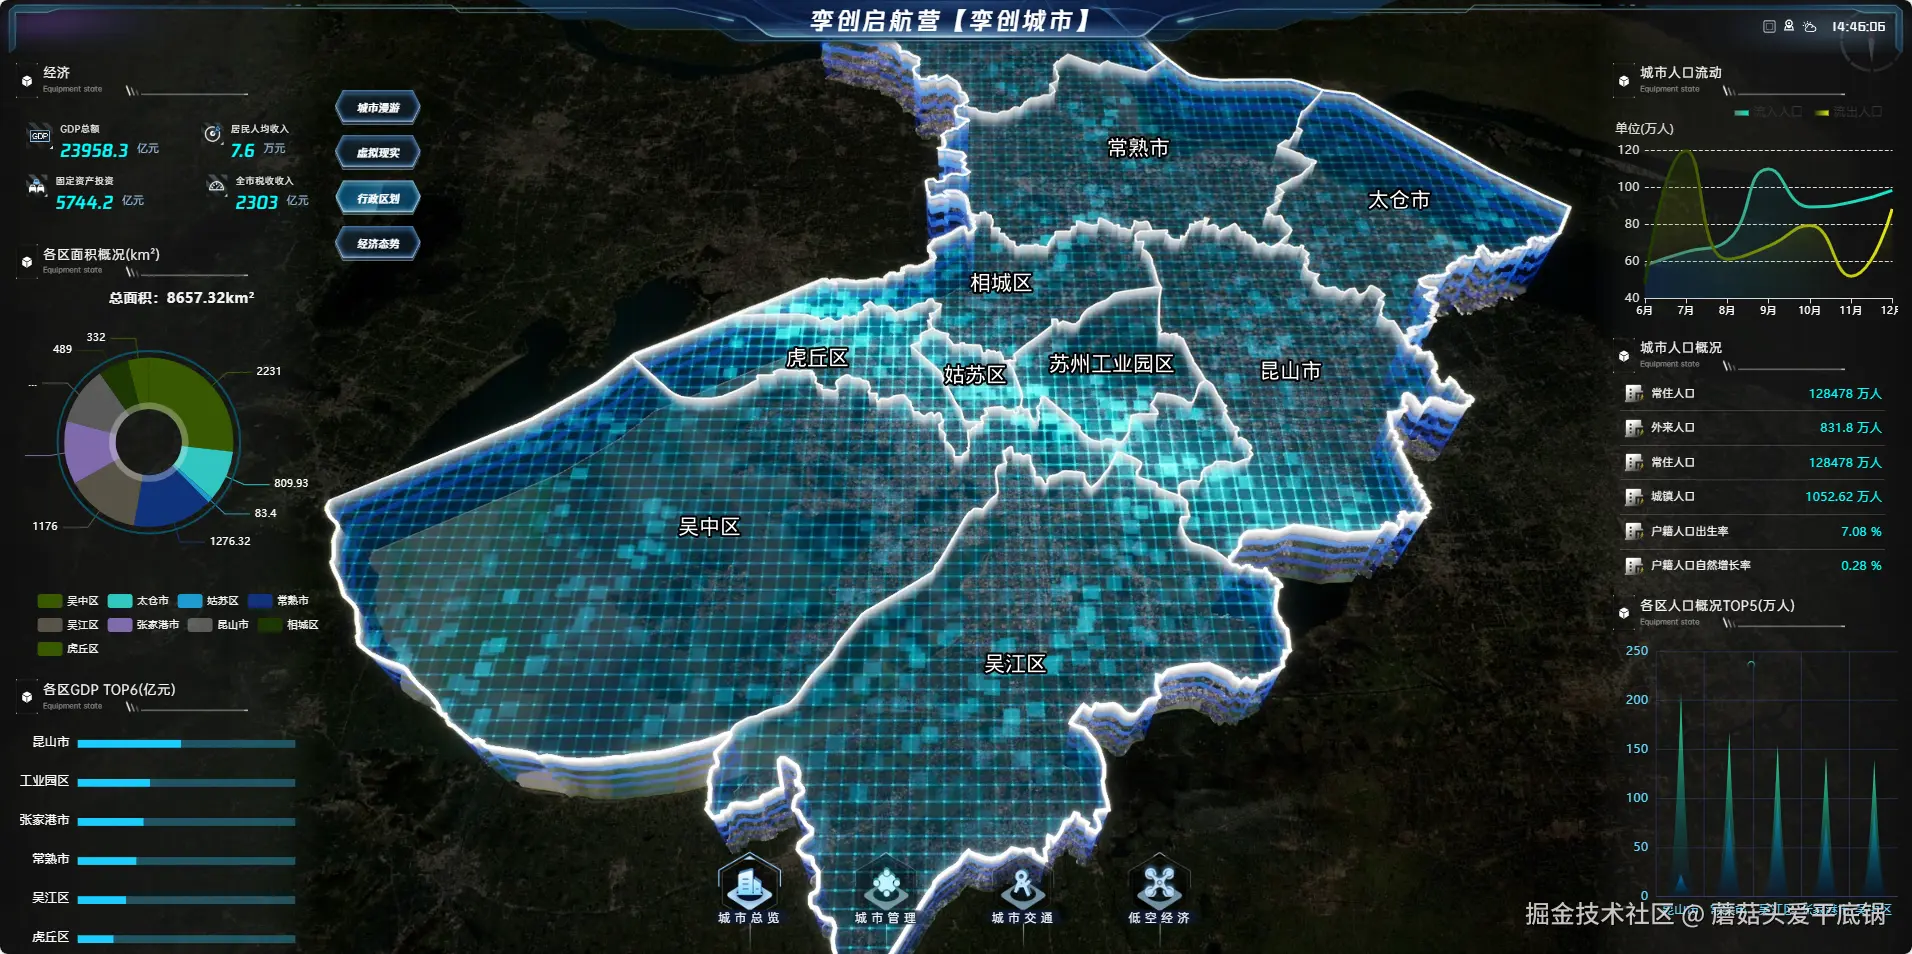
步骤五
接下来是行政区名称的标注,同样也是需要通过axios获取到我们的标注信息,其中包括标注名称,标注的位置等等信息,然后通过飞渡的marker类实现,他主要用于标注点,实现对标注对象的操作,一般通过api.marker调用其方法,在add方法这里拥有非常丰富的配置信息,大家可以打开文档进行查看。
typescript
// 5 绘制行政区标注
const addCountyLabelLayer = async () => {
  const { data } = await getAdministrativeDivisionCountyLabel()
  const markerList: any = []
  data.features.forEach((item: any, index: number) => {
    const coordinates = item.geometry.coordinates
    const name = item.properties.Name
    let label = {
      id: 'county_label_' + index,
      groupId: 'county_label',
      coordinate: [...coordinates, height], //坐标位置
      coordinateType: 0, //默认0是投影坐标系,也可以设置为经纬度空间坐标系值为1
      range: [1, 100000000], //可视范围
      viewHeightRange: [1, 100000000], // 可见高度范围

      text: name, //显示的文字
      useTextAnimation: true, //关闭文字展开动画效果 打开会影响效率
      textRange: [1, 100000000], //文本可视范围[近裁距离, 远裁距离]
      textBackgroundColor: [0, 0, 0, 0], //文本背景颜色
      fontSize: 16, //字体大小
      fontOutlineSize: 2, //字体轮廓线大小
      fontColor: Color.White, //字体颜色
      fontOutlineColor: Color.Black, //字体轮廓线颜色

      displayMode: 2 //智能显示模式  开发过程中请根据业务需求判断使用四种显示模式
    }
    markerList.push(label)
  })

  fdapi.marker.add(markerList)
}
退出
这样就基本完成了行政区划分的功能了,当然了不要忘了我们的退出操作,需要对已经添加的面和标注进行删除,需要将视角复原,还需要退出暗黑模式,将我们隐藏的图层,手工模型打开。
dart
export const exitAdministrativeDivision = async () => {
  await fdapi.weather.setDarkMode(false)
  await fdapi.infoTree.show(hideLayer.map(name => digitalTwinStore.digitalTwin[name]))
  await fdapi.tileLayer.setStyle(digitalTwinStore.digitalTwin['大地形影像'], null, null, null, 0.3)
  await fdapi.tileLayer.setStyle(digitalTwinStore.digitalTwin['苏州地形影像_Terrain'], null, null, null, 1)

  await fdapi.polygon.delete(['city_polygon', 'city_polygon_dynamic'])
  await fdapi.polyline.delete(['city_border', 'city_border_dynamic', ...LayerIdObj.polyline])
  await fdapi.polygon3d.delete(['city_wall', ...LayerIdObj.polygon3d])
  await fdapi.marker.deleteByGroupId('county_label')
}
涉及的飞渡api
camera
相机相关的操作
- 设置相机视角-fdapi.camera.set(cameraParam)
weather
天气相关操作
- 开启暗黑模式- fdapi.weather.setDarkMode(true)
polygon
提供面相关操作
- 添加一个或多个Polygon对象-fdapi.polyline.add()
- 删除一个或多个Polygon对象-fdapi.polygon.delete()
polygon3d
提供三维多边形相关的操作
- 添加一个或多个Polygon3D对象- fdapi.polygon3d.add()
- 删除一个或多个Polygon3D对象-fdapi.polygon3d.delete()
marker
标注点,实现对标注对象的操作
-
添加一个或多个标注点-fdapi.marker.add(markerList)
-
根据分组ID删除标注点-fdapi.marker.deleteByGroupId('county_label')
tileLayer
图层相关操作
- 设置TileLayer的样式-fdapi.tileLayer.setStyle()