MySQL Slow Log
- [Slow Log 的开启](#Slow Log 的开启)
- [Slow Log 解析](#Slow Log 解析)
- [MySQL 8.0 慢查询额外信息的输出](#MySQL 8.0 慢查询额外信息的输出)
MySQL Slow Log
MySQL主从复制:https://blog.csdn.net/a18792721831/article/details/146117935
MySQL Binlog:https://blog.csdn.net/a18792721831/article/details/146606305
MySQL General Log:https://blog.csdn.net/a18792721831/article/details/146607343
MySQL Slow Log:https://blog.csdn.net/a18792721831/article/details/147166971
MySQL Error Log:https://blog.csdn.net/a18792721831/article/details/147167038
Slow Log 可以用于查找执行时间比较长的查询,当优化数据库的时候,Slow Log 一般就是优化的内容。
Slow Log 的开启
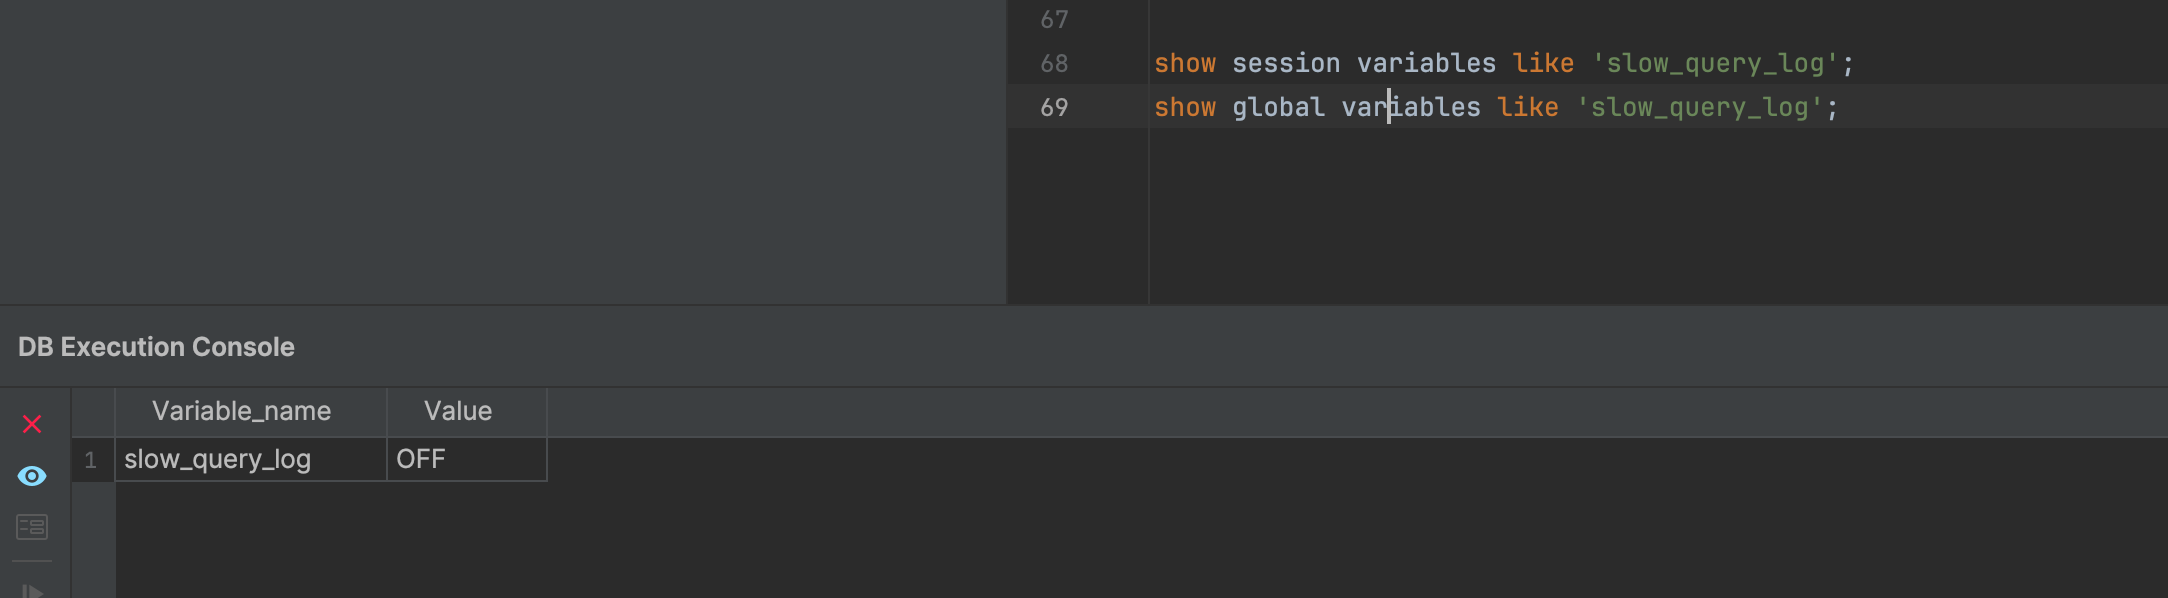
查看Slow Log 的状态 show session varibales like 'slow_query_log';或者 show global varibales like 'slow_query_log';
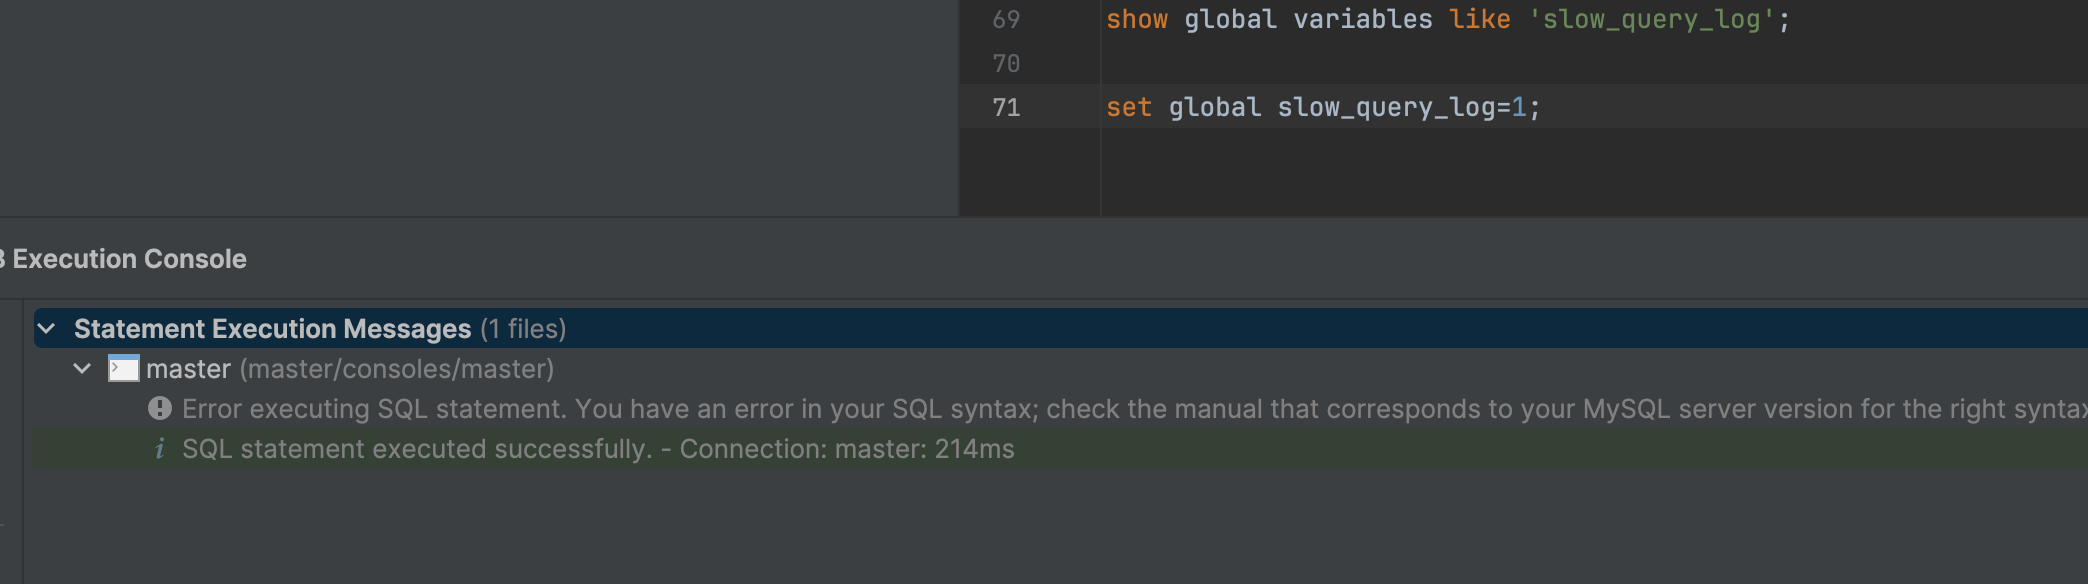
开启Slow Log 需要使用set global slow_query_log=1;开启
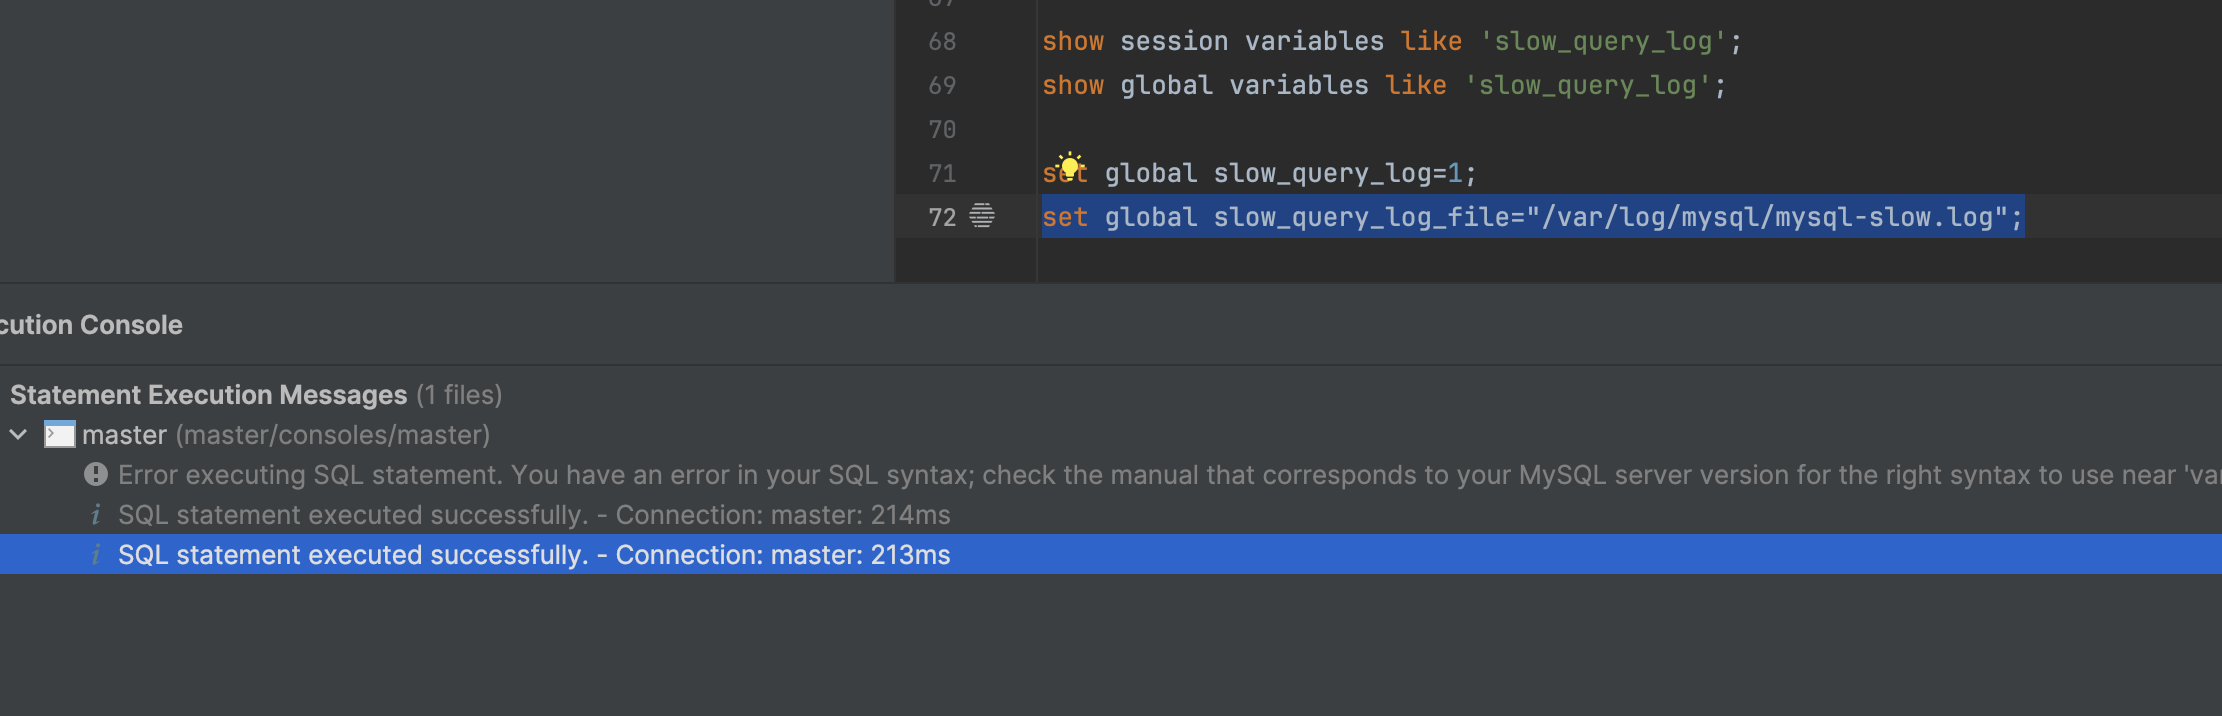
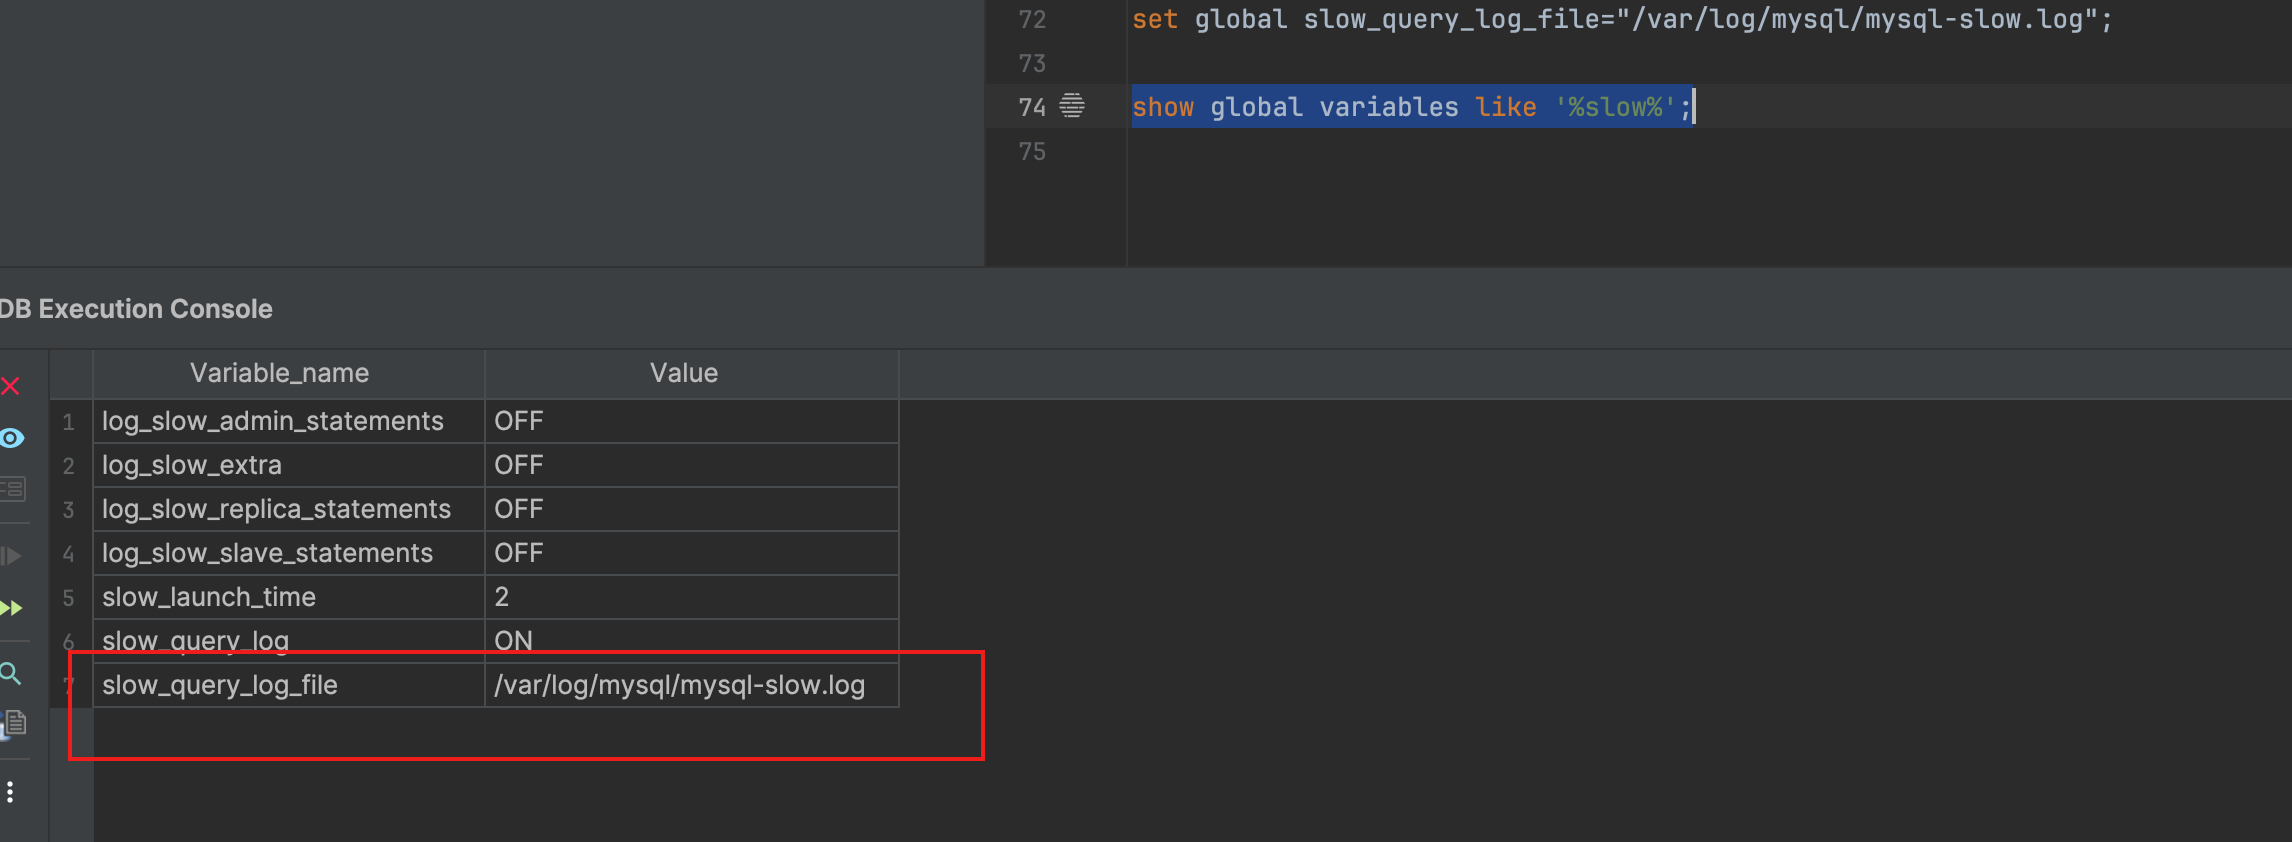
同时可以使用set global slow_query_log_file="/var/log/mysql/mysql-slow.log";指定慢日志文件存储位置
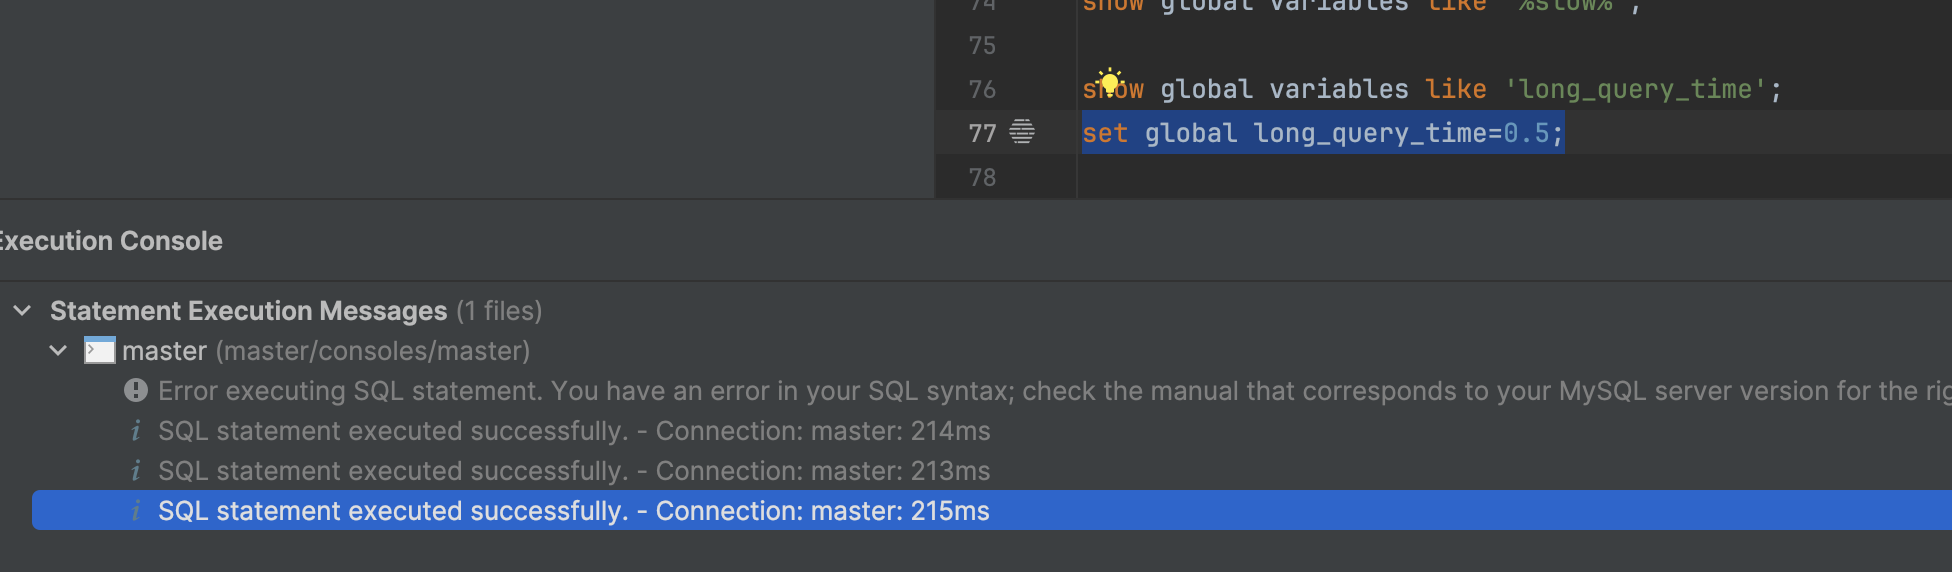
使用set global long_query_time=1;设置执行时间超过1s的sql是慢查询sql
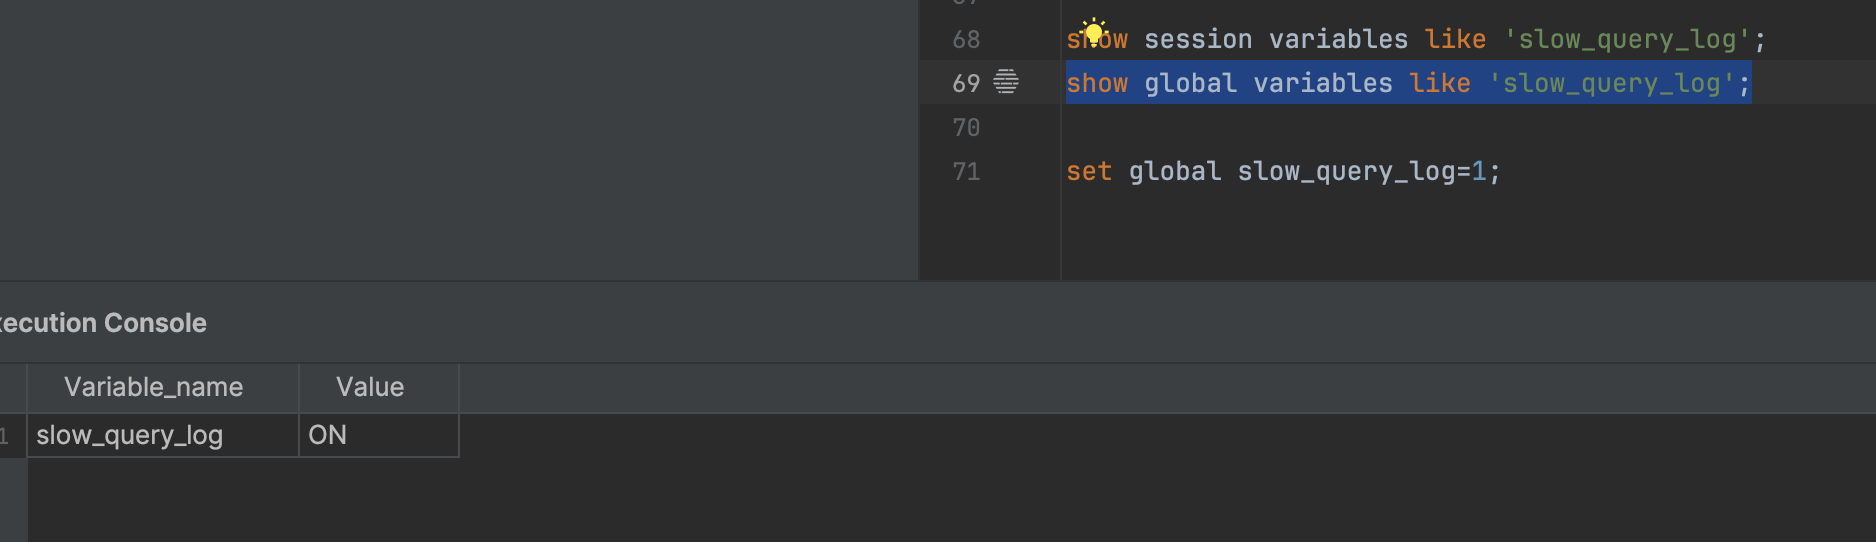
验证Slow Log 的开启状态
设置存储目录
验证
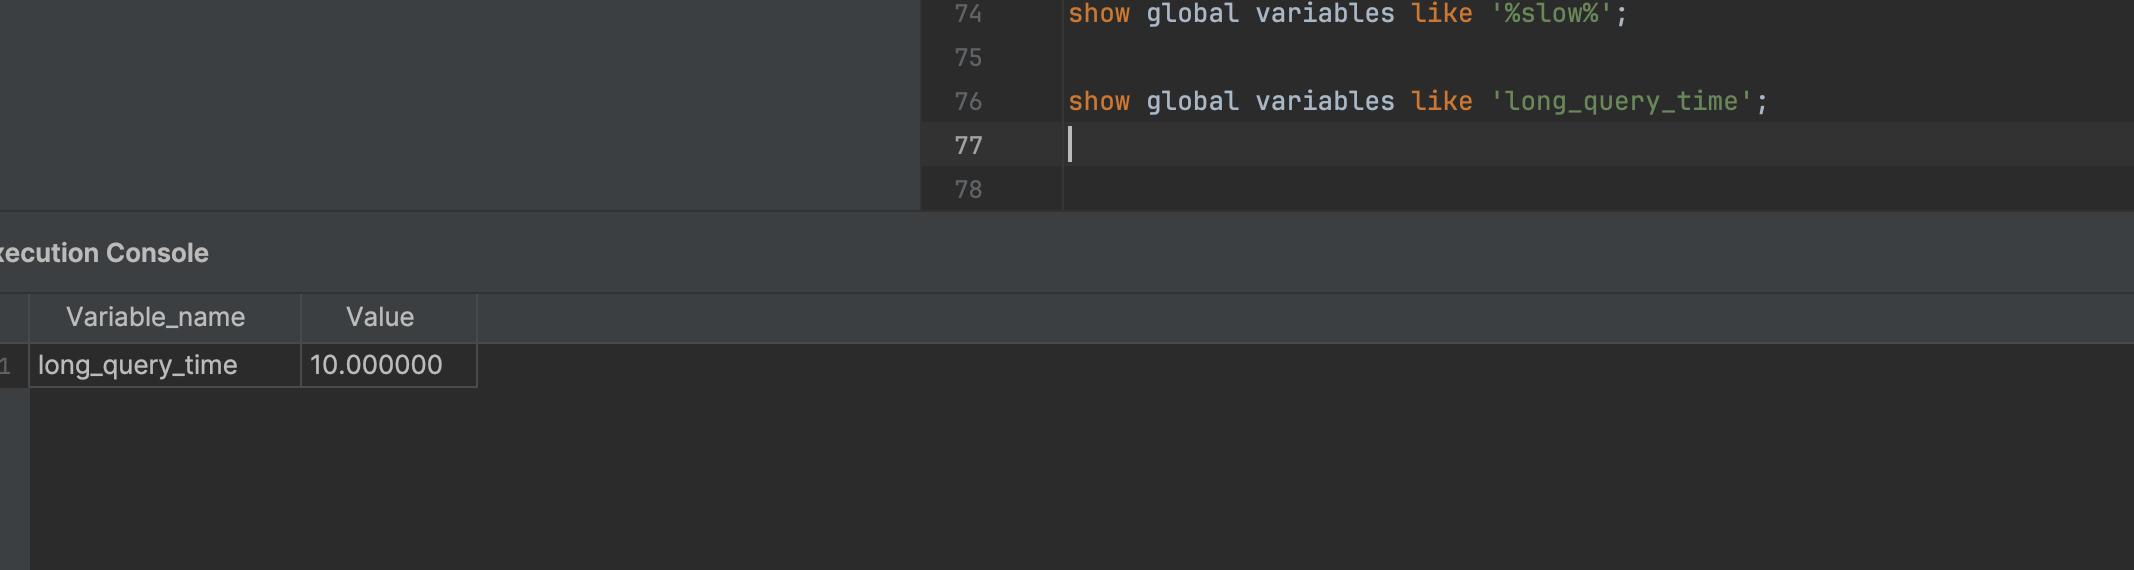
设置慢日志时间
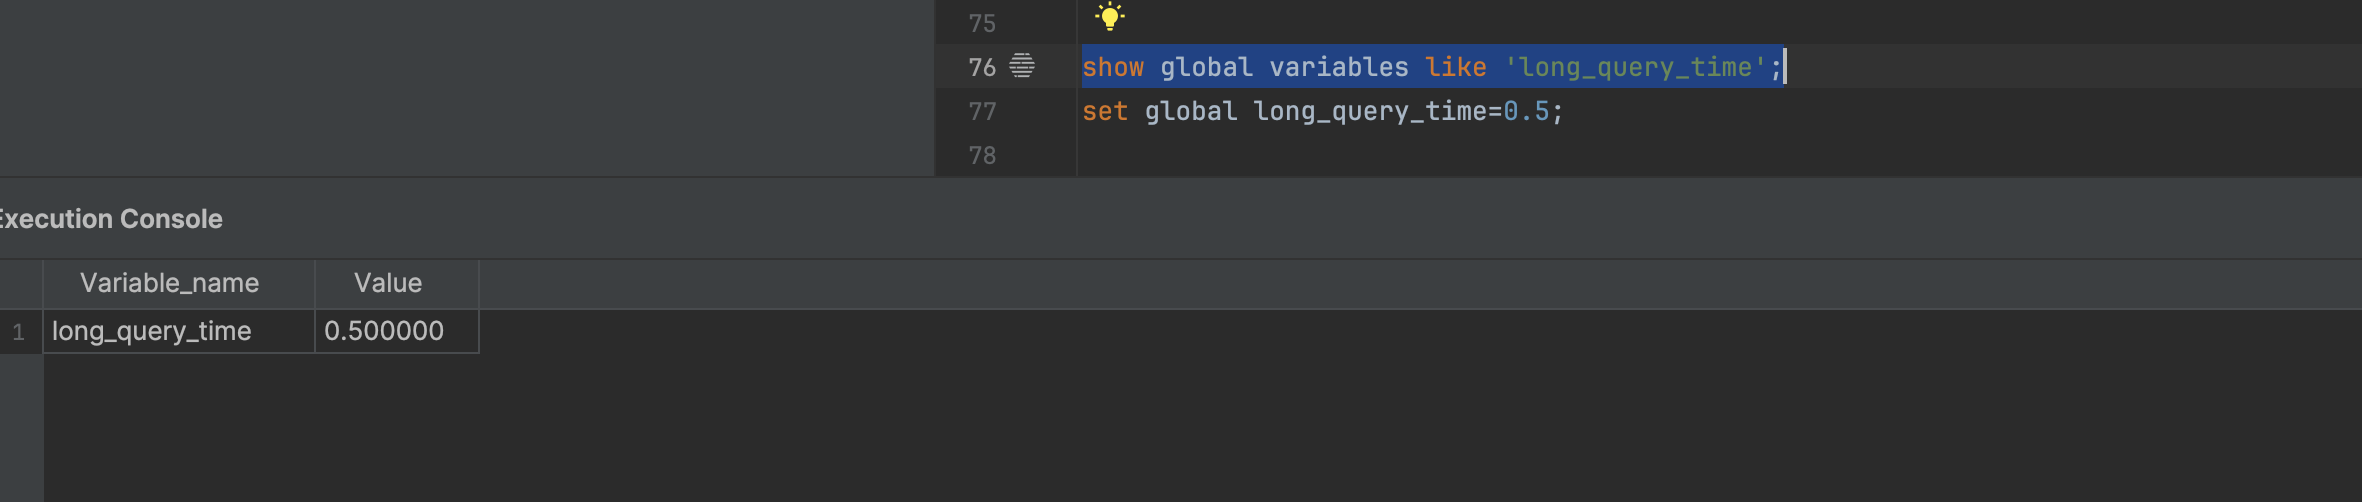
设置为500ms
执行一条sql:select 'test_slow_log',sleep(0.6); 触发慢日志
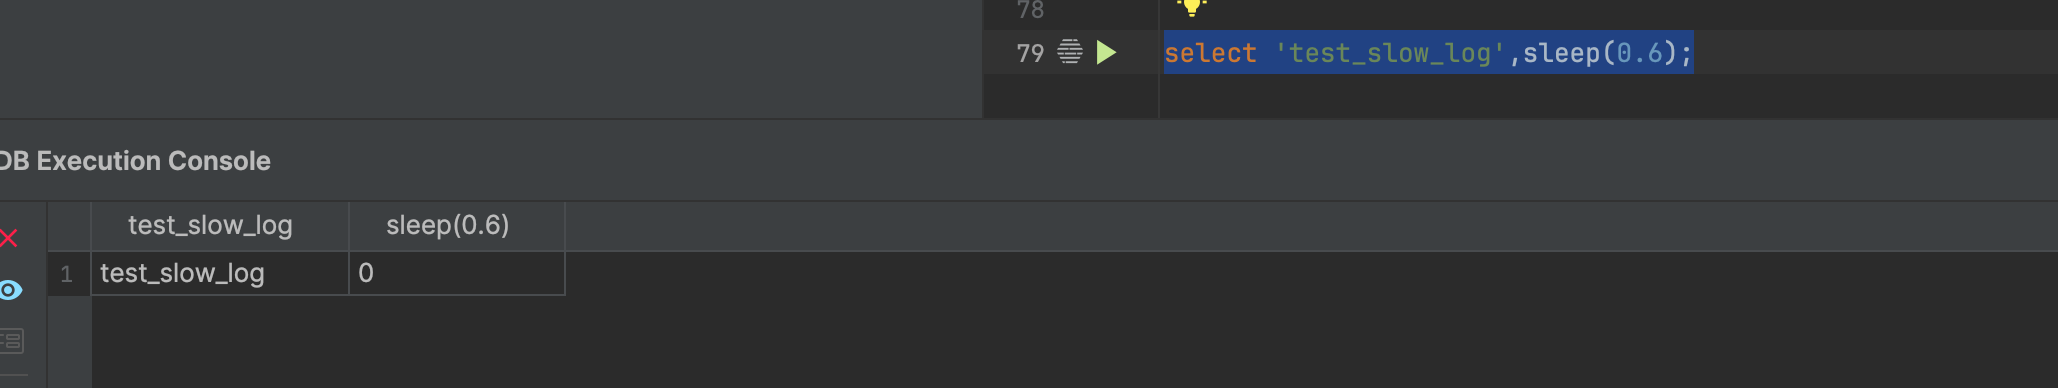
接着查看是否有慢日志生成
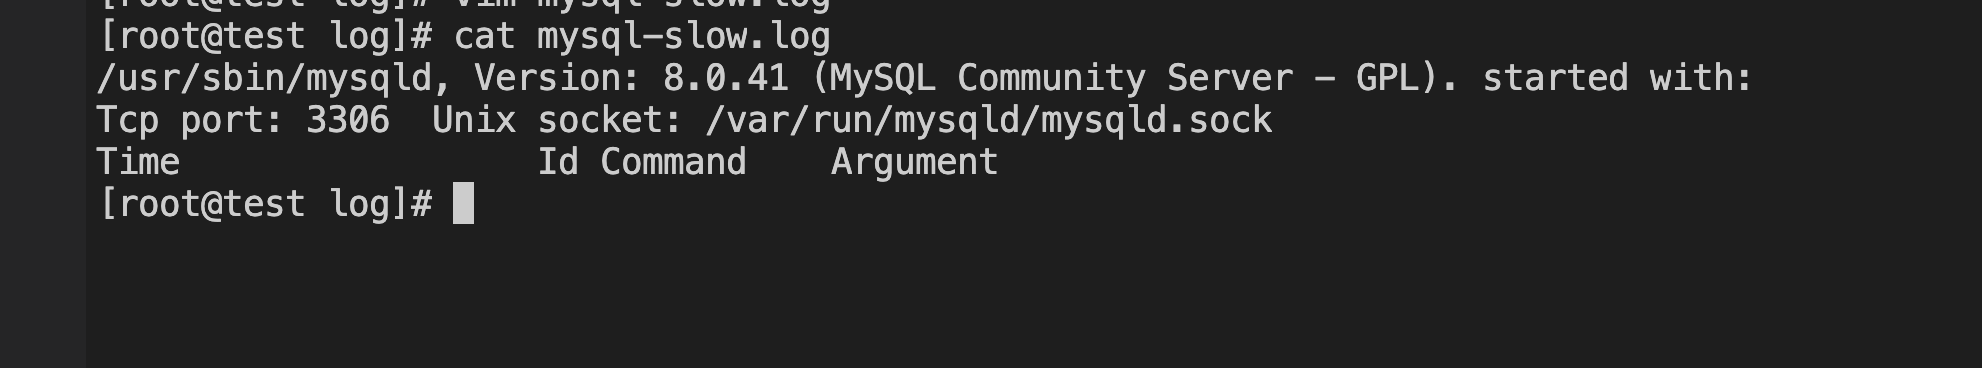
为何没有呢?因为慢日志相关的配置是动态配置,需要重新开个终端连接才能生效
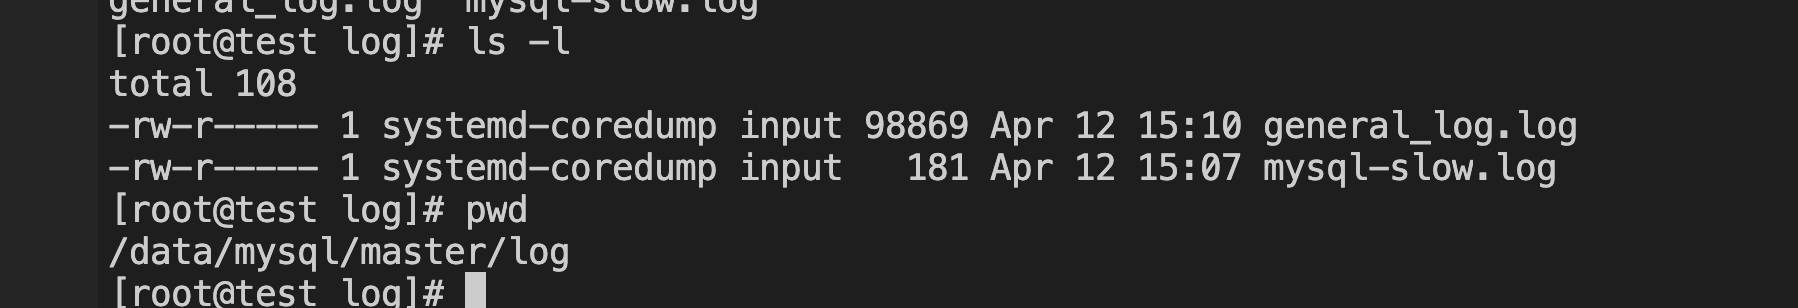
查看文件
因为在log_output中设置了FILE,TABLE
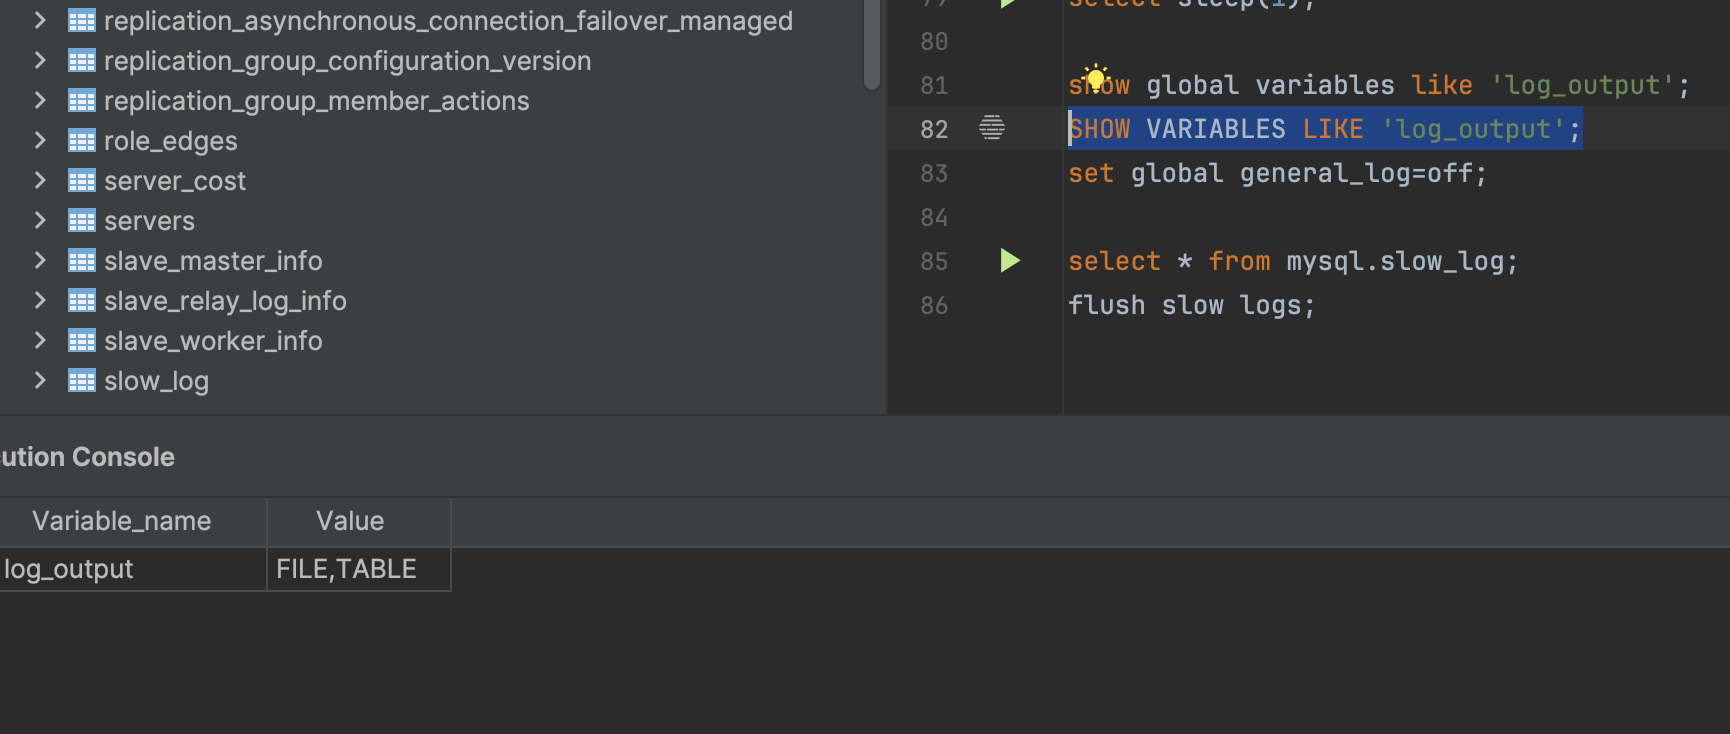
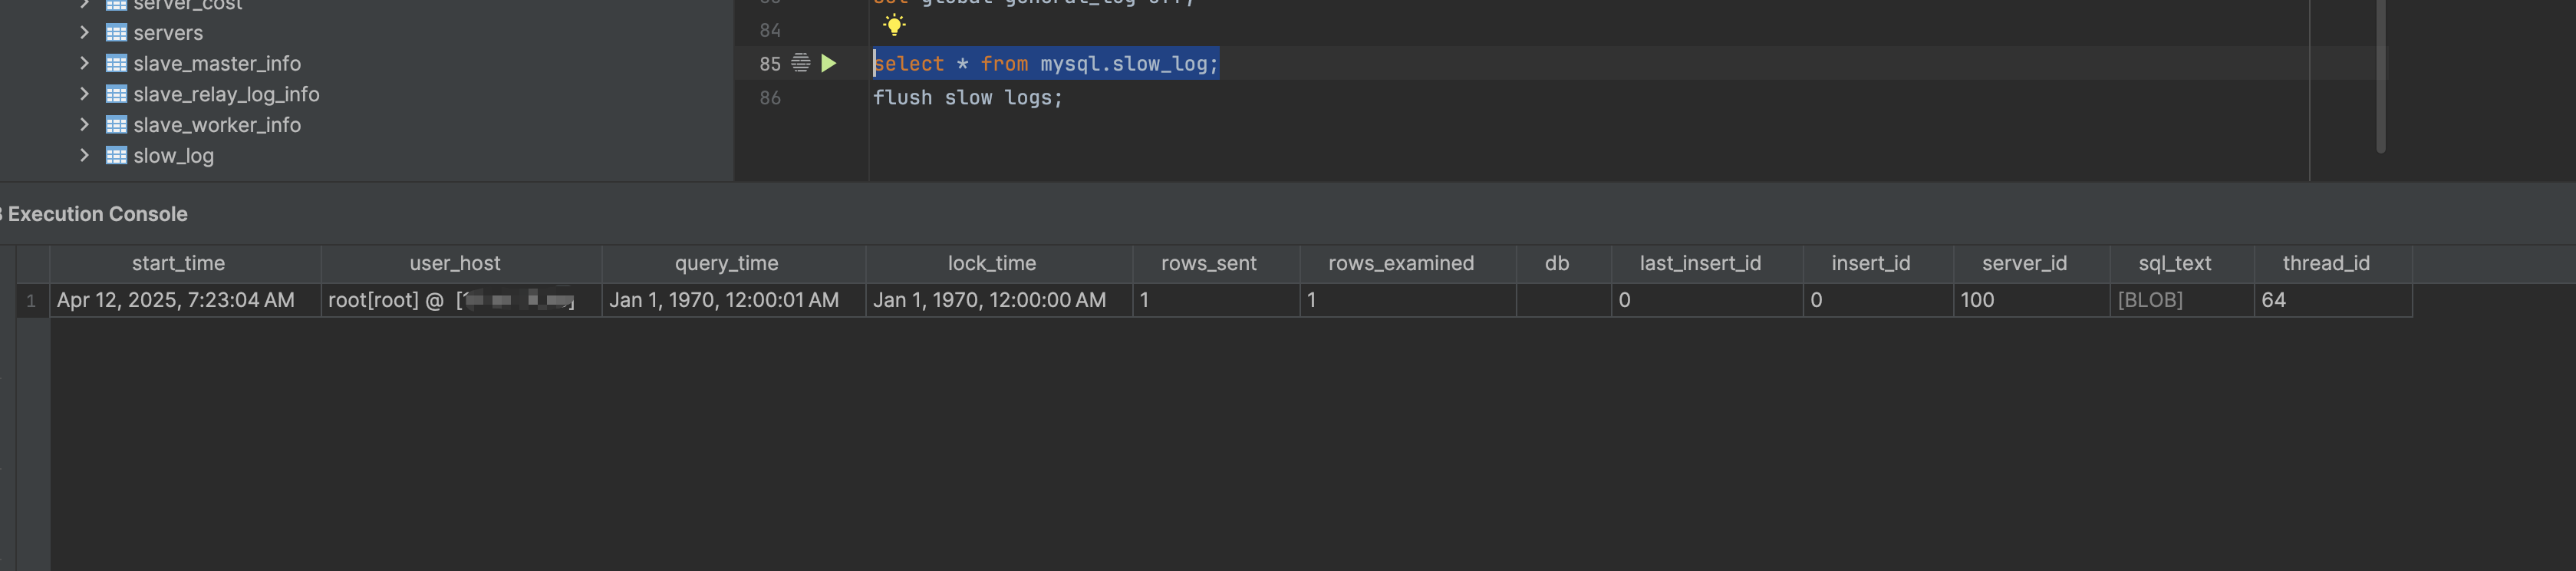
所以在 mysql.slow_log 中也有
Slow Log 解析
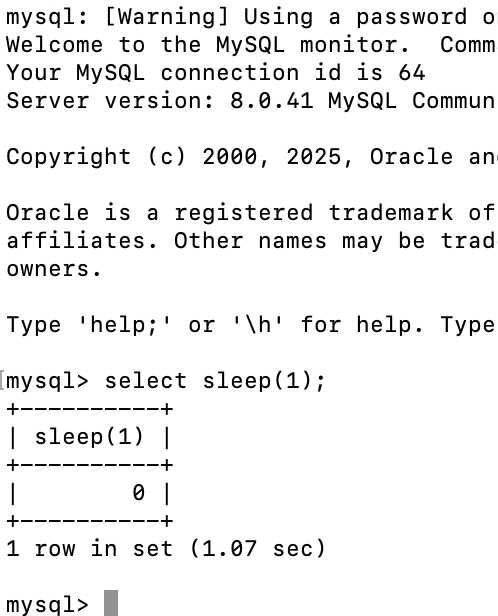
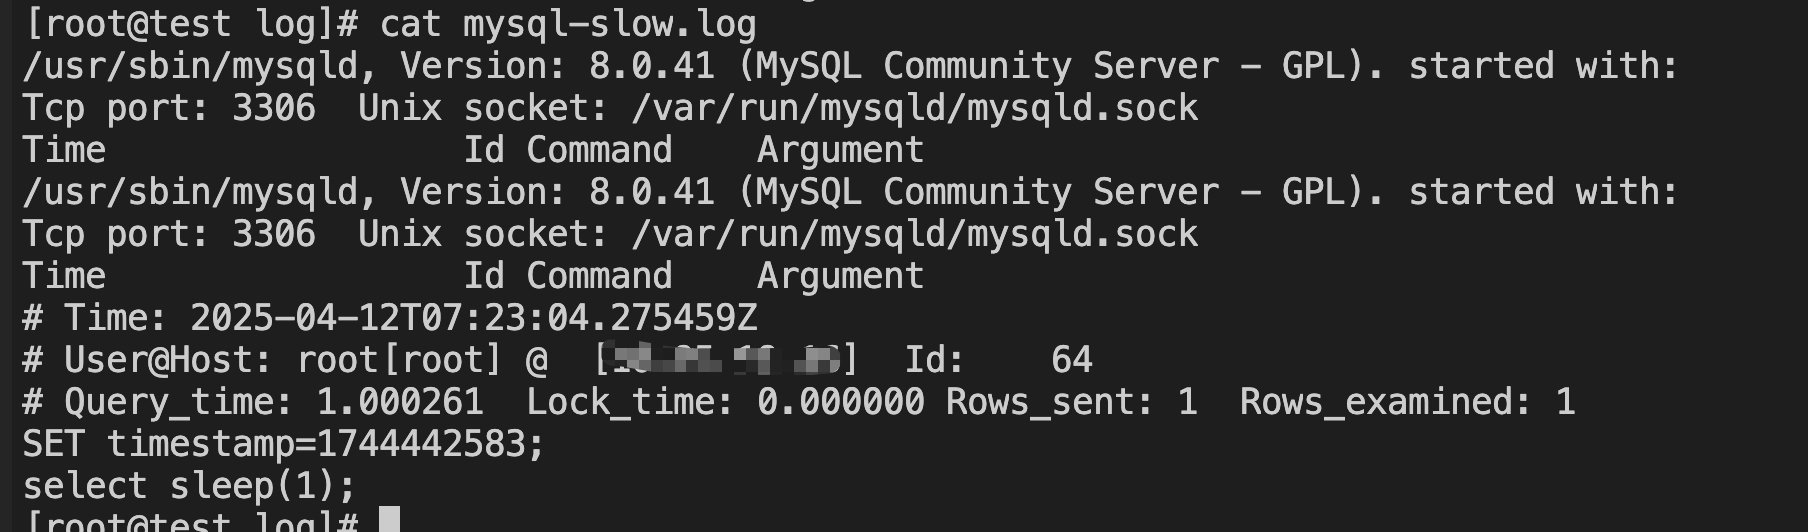
这是一条慢日志
txt
# Time: 2025-04-12T07:23:04.275459Z
# User@Host: root[root] @  [x.x.x.x]  Id:    64
# Query_time: 1.000261  Lock_time: 0.000000 Rows_sent: 1  Rows_examined: 1
SET timestamp=1744442583;
select sleep(1);- Query_time: 语句执行时间,单位为秒
- Lock_time: 获取锁的时间,单位为秒
- Rows_sent: 发送给客户端的行数
- Rows_examined: Mysql Server层检查的行数。
MySQL 8.0 慢查询额外信息的输出
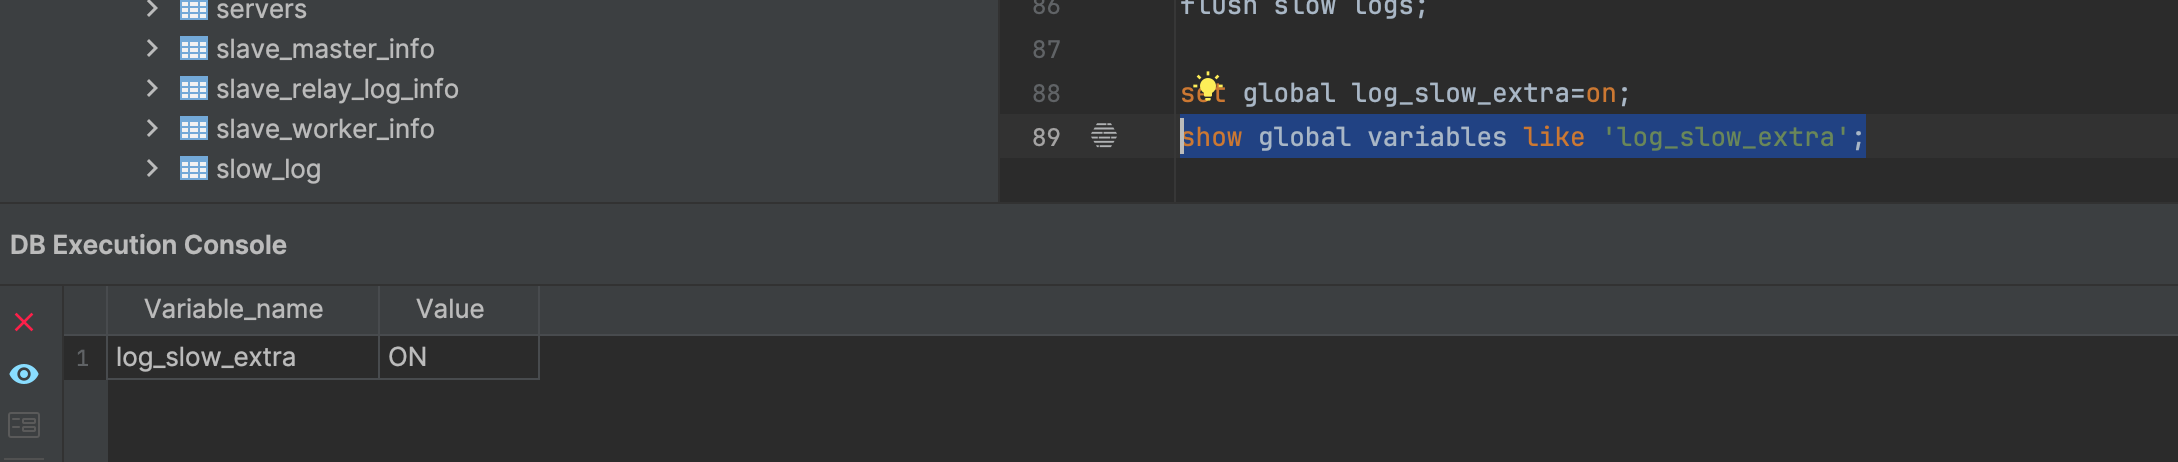
从 MySQL 8.0.14 开始,新增了 log_slow_extra 参数,在输出方式为 FILE 的情况下,启用 log_slow_extra 参数可以输出一些额外的字段。
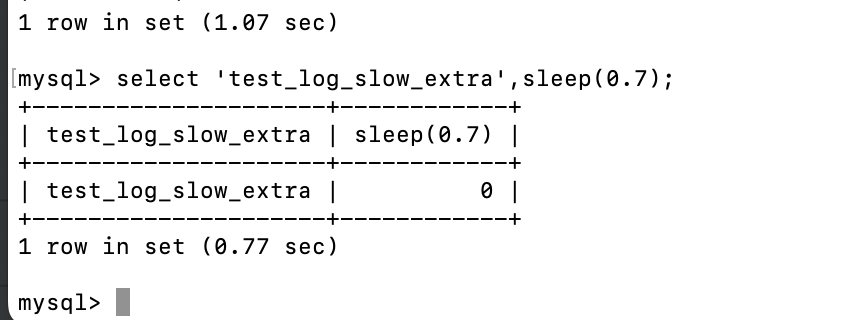
使用set global log_slow_extra=on;开启log_slow_extra参数
然后使用新的链接触发
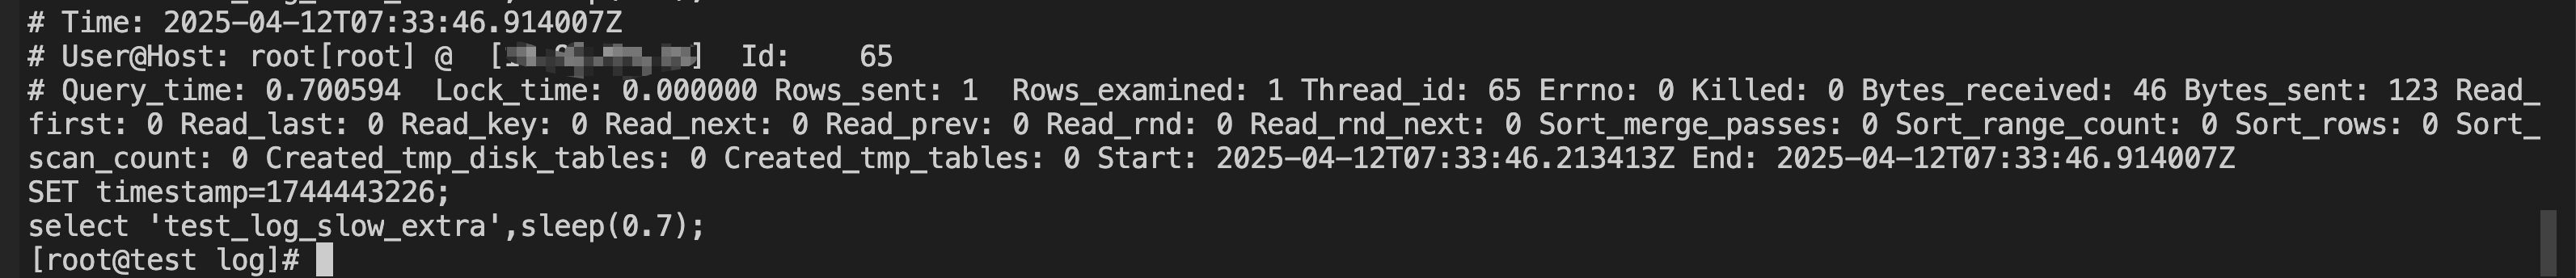
查看日志
txt
# Time: 2025-04-12T07:33:46.914007Z
# User@Host: root[root] @  [x.x.x.x]  Id:    65
# Query_time: 0.700594  Lock_time: 0.000000 Rows_sent: 1  Rows_examined: 1 Thread_id: 65 Errno: 0 Killed: 0 Bytes_received: 46 Bytes_sent: 123 Read_first: 0 Read_last: 0 Read_key: 0 Read_next: 0 Read_prev: 0 Read_rnd: 0 Read_rnd_next: 0 Sort_merge_passes: 0 Sort_range_count: 0 Sort_rows: 0 Sort_scan_count: 0 Created_tmp_disk_tables: 0 Created_tmp_tables: 0 Start: 2025-04-12T07:33:46.213413Z End: 2025-04-12T07:33:46.914007Z
SET timestamp=1744443226;
select 'test_log_slow_extra',sleep(0.7);- Time : 查询结束的UTC时间(精确到微秒),示例:
2025-04-12T07:33:46.914007Z - User@Host : 执行查询的用户和来源,格式:
用户[数据库] @ [客户端IP],示例:root[root] @ [x.x.x.x] - Id : 连接线程ID,示例:
65 - Query_time : 查询总耗时(秒),示例:
0.700594 - Lock_time : 等待表锁的时间(秒),示例:
0.000000 - Rows_sent : 返回客户端的行数,示例:
1 - Rows_examined : 服务器检查的行数,示例:
1 - Thread_id : 处理查询的线程ID,示例:
65 - Errno : 错误代码(0表示成功),示例:
0 - Killed : 查询是否被终止(0否,1是),示例:
0 - Bytes_received : 客户端发送的字节数,示例:
46 - Bytes_sent : 服务器返回的字节数,示例:
123 - Read_first : 读取索引首项次数,示例:
0 - Read_last : 读取索引末项次数,示例:
0 - Read_key : 通过索引查找次数,示例:
0 - Read_next : 顺序读下一行次数,示例:
0 - Read_prev : 逆序读前一行次数,示例:
0 - Read_rnd : 固定位置读取次数,示例:
0 - Read_rnd_next : 全表/索引扫描次数,示例:
0 - Sort_merge_passes : 排序合并到磁盘次数,示例:
0 - Sort_range_count : 范围排序次数,示例:
0 - Sort_rows : 排序总行数,示例:
0 - Sort_scan_count : 全表扫描排序次数,示例:
0 - Created_tmp_disk_tables : 磁盘临时表数量,示例:
0 - Created_tmp_tables : 内存临时表数量,示例:
0 - Start : 查询开始时间(UTC),示例:
2025-04-12T07:33:46.213413Z - End : 查询结束时间(UTC),示例:
2025-04-12T07:33:46.914007Z - SET timestamp : 查询执行的UNIX时间戳,示例:
1744443226 - Query : 记录的SQL语句,示例:
select 'test_log_slow_extra',sleep(0.7);