前言
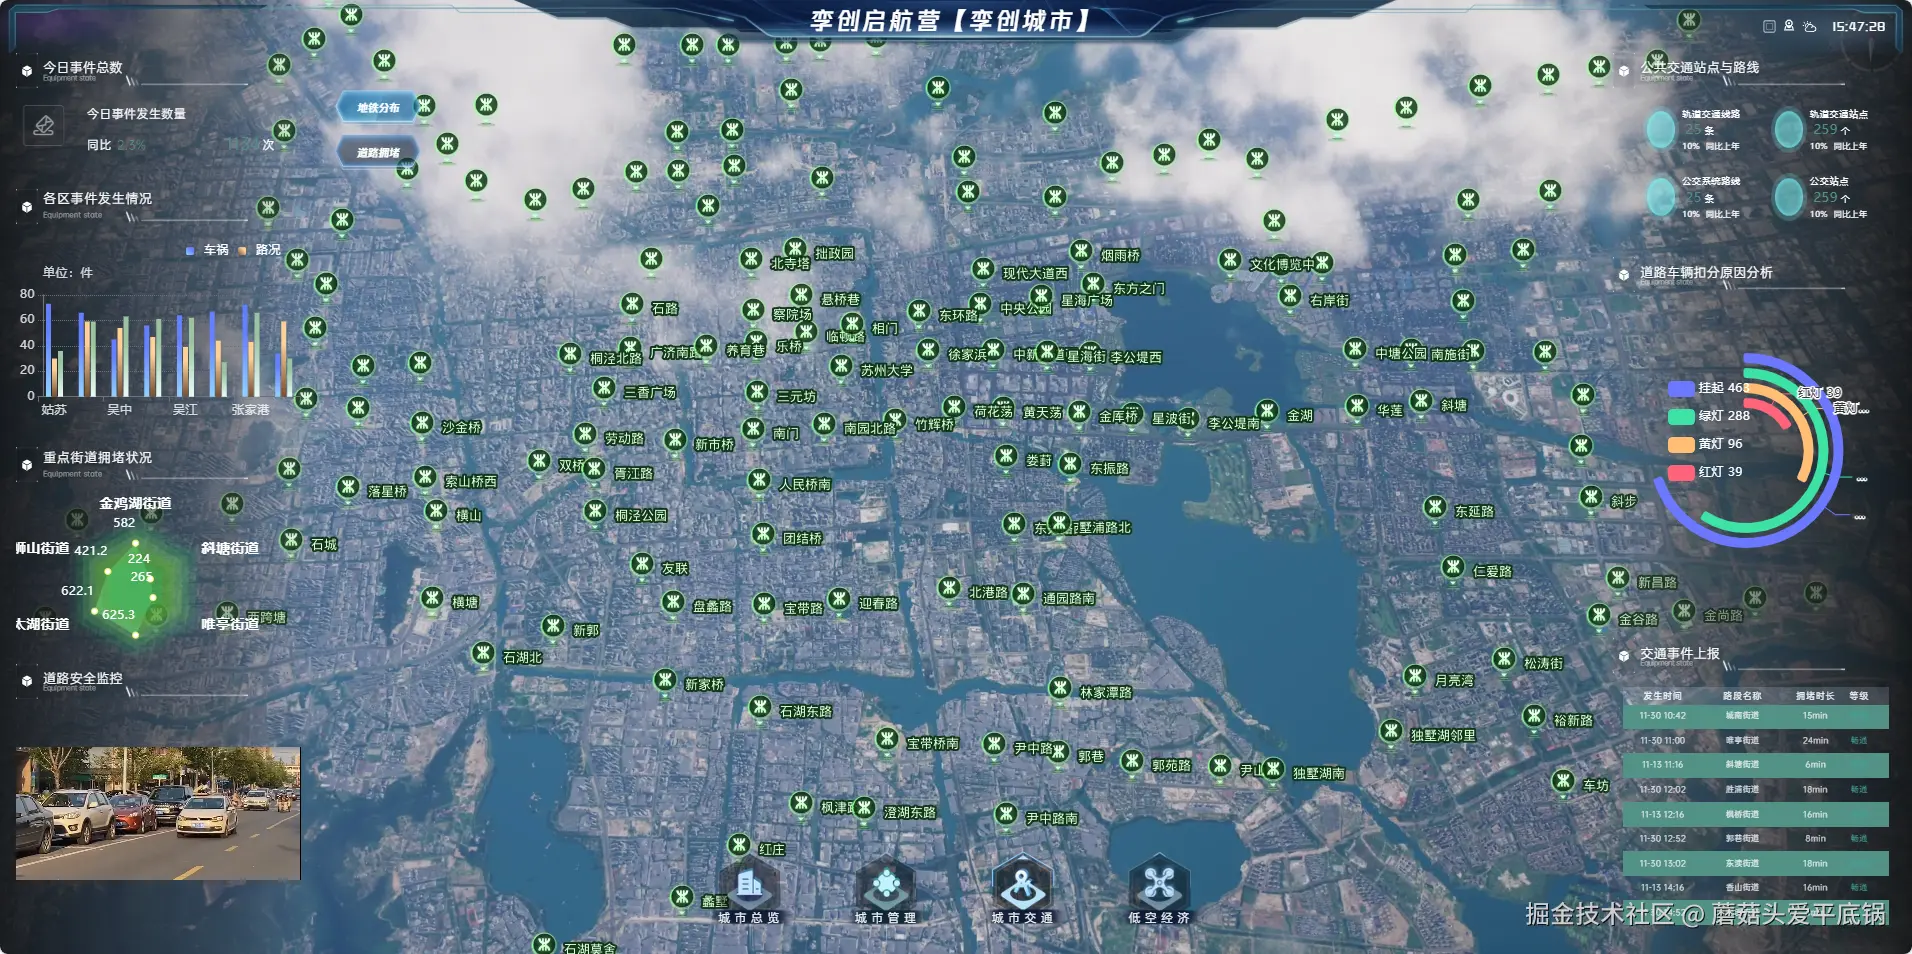
今天蘑菇头带来的是如何用前端实现地铁分布的线路图,可以发现我们不仅标注了地铁的线路分布还做了一些动效,当画面拉进时,还会标注出每个地铁站的位置,快来看看这是怎么实现的吧。


思路
首先要实现像这样子的效果,我们需要两个数据,一个是地铁的线路数据还有一个是地铁站的位置数据。当然了,这两份数据我们早就准备好了,依然是放在data文件夹下,打开GIS软件可以发现就是一些点和线,然后属性里面会有一个经纬度和站点名称等等信息。
 OK,接下来就是代码的编写了。还是老样子,需要将视角抬高,然后我们先绘制所有的地铁站点位信息,再绘制地铁线路。首先获取到所有的点位,然后通过fdapi.marker.add进行绘制,注意地铁站的icon路径不要填错了。通过调整高度可见范围就可以达到当视角拉近时展示地铁站点位信息,拉远时隐藏。
typescript
import { getMetroPoint, getMetroLine } from '@/api/home'

const addMetroMarker = async () => {
  fdapi.camera.set([563205.014687, 3446649.286563, 35655.555, -66.167427, -92.4897, 2])
  const { data } = await getMetroPoint()
  const markerList: any = []

  const map = new Map()
  data.features.forEach((item: any) => {
    const name = item.properties.PointName
    if (!map.has(name)) {
      map.set(name, item)
    }
  })

  const features = [...map.values()]
  features.forEach((item: any, index: number) => {
    const name = item.properties.PointName
    const pointCoord = item.geometry.coordinates

    const imaScale = 0.5
    const marker = {
      id: 'metro_marker_' + index,
      groupId: 'metro_marker',
      coordinate: pointCoord, //坐标位置
      coordinateType: 0, //默认0是投影坐标系,也可以设置为经纬度空间坐标系值为1
      anchors: [(-56 / 2) * imaScale, 72 * imaScale], //锚点,设置Marker的整体偏移,取值规则和imageSize设置的宽高有关,图片的左上角会对准标注点的坐标位置。示例设置规则:x=-imageSize.width/2,y=imageSize.height
      imagePath: '@path:地铁.png', //显示图片路径
      imageSize: [56 * imaScale, 72 * imaScale], //图片的尺寸
      range: [1, 100000], //可视范围
      viewHeightRange: [1, 30000], // 可见高度范围
      fixedSize: true, //图片固定尺寸,取值范围:false 自适应,近大远小,true 固定尺寸,默认值:false

      text: name, //显示的文字
      useTextAnimation: true, //关闭文字展开动画效果 打开会影响效率
      textRange: [1, 20000], //文本可视范围[近裁距离, 远裁距离]
      textOffset: [0, 0], // 文本偏移
      textBackgroundColor: [0, 0, 0, 0], //文本背景颜色
      fontSize: 10, //字体大小
      fontOutlineSize: 2, //字体轮廓线大小
      fontColor: '#d6fed7', //字体颜色
      fontOutlineColor: '#113019', //字体轮廓线颜色

      autoHidePopupWindow: true, //失去焦点后是否自动关闭弹出窗口
      autoHeight: true, // 自动判断下方是否有物体
      displayMode: 2, //智能显示模式  开发过程中请根据业务需求判断使用四种显示模式
      clusterByImage: true, // 聚合时是否根据图片路径分类,即当多个marker的imagePath路径参数相同时按路径对marker分类聚合
      priority: 0, //避让优先级
      occlusionCull: false //是否参与遮挡剔除
    }

    markerList.push(marker)
  })
  fdapi.marker.add(markerList)
}
然后就是绘制地铁线路了,和绘制点位信息一样需要先获取到线路数据,通过getMetroLine获取,我们早就封装好了获取方法。然后通过飞渡的polyline进行绘制,一共绘制两组线,一组是底色没有动效的线,一组是有动效的线。
typescript
const polylineIds: string[] = []
const addMetroPolyline = async () => {
  const { data } = await getMetroLine()
  console.log(data)

  const polylineList: any = []
  const codeToColor: any = {
    1: '#46ab06',
    2: '#f11b1d',
    3: '#f45302',
    4: '#0b51c6',
    5: '#f52098',
    6: '#1ca2df',
    7: '#9160bb',
    8: '#786e01',
    s1: '#6f3663'
  }
  data.features.forEach((item: any, index: number) => {
    const coordinates = item.geometry.coordinates[0]
    const code = item.properties.code

    polylineIds.push('metro_polyline_' + index)
    const polyline = {
      id: 'metro_polyline_' + index, //折线唯一标识id
      coordinates: coordinates, //构成折线的坐标点数组
      coordinateType: 0, //坐标系类型,取值范围:0为Projection类型,1为WGS84类型,2为火星坐标系(GCJ02),3为百度坐标系(BD09),默认值:0
      range: [1, 1000000], //可视范围:[近裁距离, 远裁距离],取值范围: [任意负值, 任意正值]
      color: codeToColor[code], //折线颜色
      thickness: 160, //折线宽度
      intensity: 1, //亮度
      flowRate: 0.5, //流速
      shape: 0, //折线类型 0:直线, 1:曲线
      depthTest: false, //是否做深度检测 开启后会被地形高度遮挡
      style: 4, //折线样式 参考样式枚举:PolylineStyle
      tiling: 0 //材质贴图平铺比例
    }
    polylineList.push(polyline)

    polylineIds.push('metro_polyline_dynamic_' + index)
    const polyline_dynamic = {
      id: 'metro_polyline_dynamic_' + index, //折线唯一标识id
      coordinates: coordinates.map((c: number[]) => [c[0], c[1], 0.1]), //构成折线的坐标点数组
      coordinateType: 0, //坐标系类型,取值范围:0为Projection类型,1为WGS84类型,2为火星坐标系(GCJ02),3为百度坐标系(BD09),默认值:0
      range: [10000, 10000000], //可视范围:[近裁距离, 远裁距离],取值范围: [任意负值, 任意正值]
      color: codeToColor[code], //折线颜色
      thickness: 200, //折线宽度
      intensity: 100, //亮度
      flowRate: 0.4, //流速
      shape: 0, //折线类型 0:直线, 1:曲线
      depthTest: false, //是否做深度检测 开启后会被地形高度遮挡
      style: 3, //折线样式 参考样式枚举:PolylineStyle
      tiling: 0.5 //材质贴图平铺比例
    }
    polylineList.push(polyline_dynamic)
  })

  fdapi.polyline.add(polylineList)
}
最后当退出时需要将绘制的信息删除。
javascript
export const exitMetro = async () => {
  fdapi.marker.deleteByGroupId('metro_marker')
  fdapi.polyline.delete(polylineIds)
}
涉及的飞渡api
-
绘制点-fdapi.marker.add()
-
绘制线-fdapi.polyline.add()
-
根据分组ID删除Marker- fdapi.marker.deleteByGroupId('metro_marker')
-
删除线-fdapi.polyline.delete(polylineIds)