本文所展示的代码是一个完整的数据采集、处理与可视化工具,主要用于从指定网站下载Excel文件,解析其中的数据,并生成投资者数量的趋势图表。以下是代码的主要功能模块及其作用:
1.网页数据获取
- 使用fetch_html_page函数从目标网站抓取HTML页面内容。
- 通过parse_html_for_excel_links解析HTML内容,提取所有Excel文件链接。
- 利用parse_html_for_max_page解析最大分页数,确保能够遍历所有页面。
2.文件下载与存储
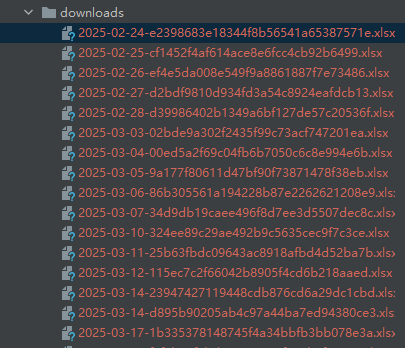
- download_excel_file负责根据Excel文件的URL下载文件并保存到本地指定路径。
- download_excel_data实现批量下载功能,支持多页数据的完整采集。
3.数据读取与处理
- read_excel_file使用pandas库读取Excel文件内容。
- process_excel_data将Excel数据转换为字典格式,便于后续处理。
- process_downloaded_files批量处理下载的Excel文件,提取关键数据并存储为列表。
4.数据可视化
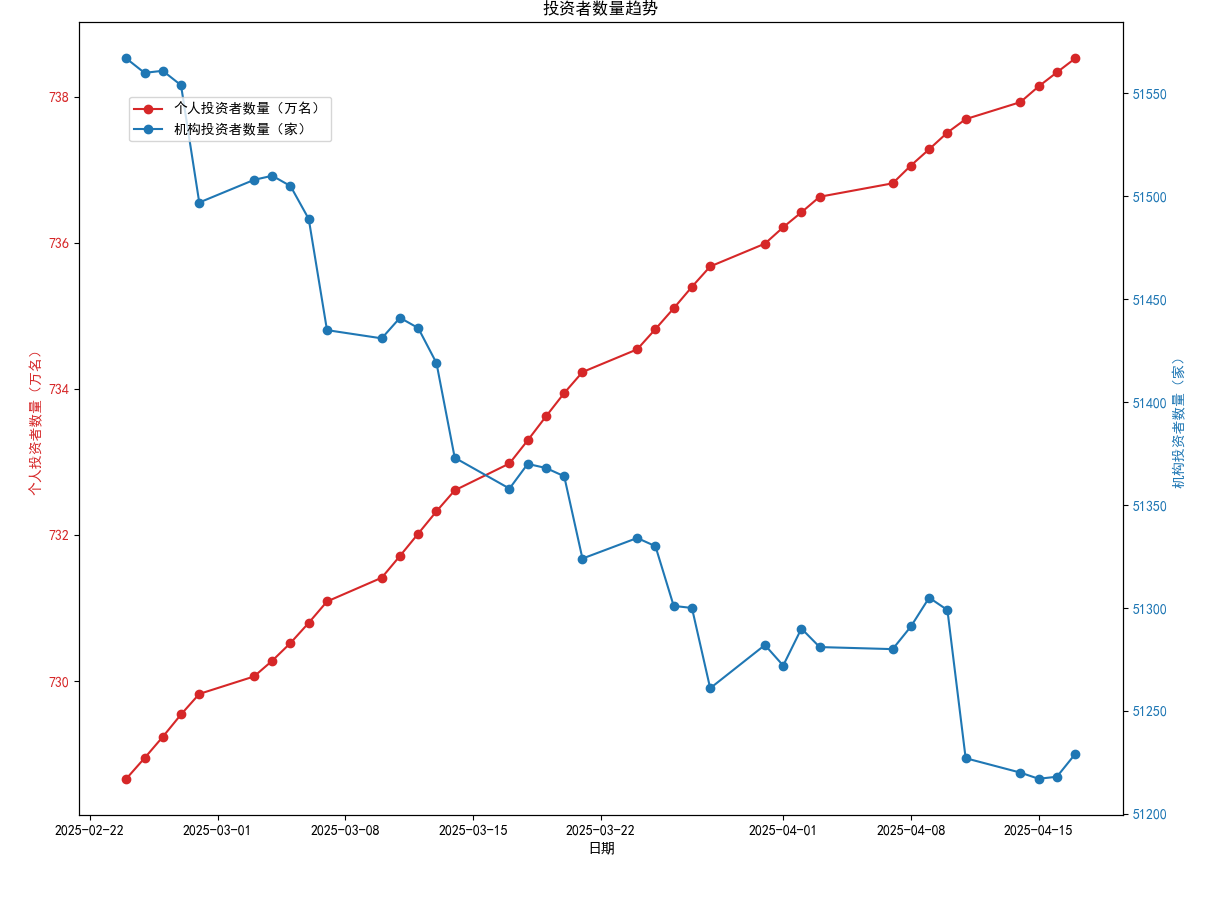
- plot_investor_trends利用matplotlib绘制双Y轴折线图,展示个人投资者和机构投资者的数量变化趋势。
- 图表包含日期、个人投资者数量(万名)和机构投资者数量(家),并通过不同颜色区分数据系列。
整体流程
- 代码从指定网站抓取数据,自动下载相关Excel文件。
- 解析Excel文件中的投资者数据,并生成趋势图表以直观展示数据变化。
python
import warnings

import requests
from bs4 import BeautifulSoup
import pandas as pd
import os
import re
import matplotlib

# 设置matplotlib的字体配置,以支持中文显示
matplotlib.rcParams['font.sans-serif'] = ['SimHei']  # 或者 ['Microsoft YaHei']
matplotlib.rcParams['axes.unicode_minus'] = False
matplotlib.use('TkAgg')
from matplotlib import pyplot as plt


def fetch_html_page(url):
    """
    获取HTML页面内容。

    参数:
    url (str): 目标网页的URL。

    返回:
    str: 页面的HTML内容,如果请求失败则返回None。
    """
    headers = {
        "User-Agent": "Mozilla/5.0 (Windows NT 10.0; Win64; x64) AppleWebKit/537.36 (KHTML, like Gecko) Chrome/91.0.4472.124 Safari/537.36"
    }
    response = requests.get(url, headers=headers)
    if response.status_code == 200:
        print(f"成功获取页面: {url}")
        return response.text
    else:
        print(f"Error: {response.status_code}, {response.text}")
        return None


def parse_html_for_excel_links(html_content):
    """
    解析HTML内容中的Excel链接。

    参数:
    html_content (str): HTML页面内容。

    返回:
    list: 包含所有找到的Excel文件链接的列表。
    """
    soup = BeautifulSoup(html_content, 'html.parser')
    excel_links = []
    for a_tag in soup.find_all('a', href=True):
        href = a_tag.get('href')
        if href and href.endswith('.xlsx'):
            excel_links.append(href)
    return excel_links


def parse_html_for_max_page(html_content):
    """
    解析HTML内容以找到最大页面数。

    参数:
    html_content (str): HTML页面内容。

    返回:
    int: 最大页面数。
    """
    soup = BeautifulSoup(html_content, 'html.parser')
    max_page = 1
    for a_tag in soup.find_all('a', class_='pagingNormal'):
        onclick = a_tag.get('onclick')
        if onclick:
            match = re.search(r"'(/test/j/[^']+)'", onclick)
            if match:
                page_number = match.group(1).split('-')[-1].split('.')[0]
                max_page = max(max_page, int(page_number))
    return max_page


def download_excel_file(url, save_path):
    """
    下载Excel文件并保存到指定路径。

    参数:
    url (str): Excel文件的URL。
    save_path (str): 文件的保存路径。
    """
    headers = {
        "User-Agent": "Mozilla/5.0 (Windows NT 10.0; Win64; x64) AppleWebKit/537.36 (KHTML, like Gecko) Chrome/91.0.4472.124 Safari/537.36"
    }
    response = requests.get(url, headers=headers)
    if response.status_code == 200:
        with open(save_path, 'wb') as f:
            f.write(response.content)
        print(f"下载完成: {save_path}")
    else:
        print(f"Error: {response.status_code}, {response.text}")


def download_excel_data():
    """
    下载所有Excel数据文件。
    """
    base_url = 'https://test/index.html'  # 替换为实际网页地址
    current_url = base_url
    page_number = 1

    html_content = fetch_html_page(current_url)
    if not html_content:
        return

    max_page = parse_html_for_max_page(html_content)
    print(f"最大页面数: {max_page}")

    while page_number <= max_page:
        print(f"正在处理第 {page_number} 页: {current_url}")
        html_content = fetch_html_page(current_url)
        if not html_content:
            break

        excel_links = parse_html_for_excel_links(html_content)
        if not excel_links:
            print("未找到Excel链接。")
            break

        for link in excel_links:
            full_url = f"https://www.test.cn{link}"
            # 提取日期和文件名部分
            file_path_parts = link.split('/')
            file_name = ('/'.join(file_path_parts[-3:-1]) + '/' + file_path_parts[-1]).replace('/', '-')
            save_path = os.path.join('downloads', file_name)
            os.makedirs(os.path.dirname(save_path), exist_ok=True)
            download_excel_file(full_url, save_path)

        if page_number < max_page:
            next_page_link = f"/test/d2bb5c19-{page_number + 1}.html"
            current_url = f"https://www.test.cn{next_page_link}"
            page_number += 1
        else:
            print("没有更多页面。")
            break


def read_excel_file(file_path):
    """
    读取Excel文件内容。

    参数:
    file_path (str): Excel文件的路径。

    返回:
    DataFrame: 读取到的Excel文件内容,如果读取失败则返回None。
    """
    try:
        with warnings.catch_warnings():
            warnings.simplefilter("ignore", UserWarning)
            df = pd.read_excel(file_path, engine='openpyxl', header=None)
        return df
    except Exception as e:
        print(f"读取Excel文件时出错: {e}")
        return None


def process_excel_data(df):
    """
    处理Excel数据,将其转换为字典格式。

    参数:
    df (DataFrame): Excel文件内容。

    返回:
    dict: 转换后的字典数据。
    """
    if df is None:
        return {}

    # 处理合并单元格
    # df = df.fillna(method='ffill').fillna(method='bfill')

    # 将数据转换为字典
    data_dict = {}
    current_section = None
    for index, row in df.iterrows():
        if index == 1:  # 第二行
            key = row[1]
            if pd.isnull(key):
                key = df.iloc[1, 0]
            value = row[2] if pd.notnull(row[2]) else None
            data_dict[key] = value
        elif index > 1:
            if pd.notnull(row[0]):
                current_section = row[0]
                data_dict[current_section] = {}
            if pd.notnull(row[1]):
                key = row[1]
                value = row[2] if pd.notnull(row[2]) else None
                data_dict[current_section][key] = value

    return data_dict


def process_downloaded_files(directory):
    """
    处理下载的Excel文件,提取数据。

    参数:
    directory (str): 存放下载文件的目录路径。

    返回:
    list: 包含所有处理后的数据字典的列表。
    """
    data_list = []
    for filename in os.listdir(directory):
        if filename.endswith('.xlsx'):
            file_path = os.path.join(directory, filename)
            df = read_excel_file(file_path)
            if df is not None:
                print(f"处理文件: {filename}")
                data_dict = process_excel_data(df)
                print(data_dict)  # 打印处理后的字典
                data_list.append(data_dict)
    return data_list


def plot_investor_trends(data_list):
    """
    绘制投资者数量趋势图。

    参数:
    data_list (list): 包含投资者数据的列表。
    """
    # 提取时间值和投资者数量
    dates = []
    individual_investors = []
    institutional_investors = []

    for data_dict in data_list:
        date_str = data_dict['统计指标']
        date = pd.to_datetime(date_str)
        dates.append(date)
        individual_investors.append(data_dict['证券公司开展业务情况']['个人投资者数量(万名)'])
        institutional_investors.append(data_dict['证券公司开展业务情况']['机构投资者数量(家)'])

    # 创建折线图
    fig, ax1 = plt.subplots(figsize=(10, 6))

    # 绘制个人投资者数量
    color = 'tab:red'
    ax1.set_xlabel('日期')
    ax1.set_ylabel('个人投资者数量(万名)', color=color)
    ax1.plot(dates, individual_investors, color=color, label='个人投资者数量(万名)', marker='o')
    ax1.tick_params(axis='y', labelcolor=color)

    # 创建第二个 Y 轴
    ax2 = ax1.twinx()  # 共享 X 轴

    # 绘制机构投资者数量
    color = 'tab:blue'
    ax2.set_ylabel('机构投资者数量(家)', color=color)
    ax2.plot(dates, institutional_investors, color=color, label='机构投资者数量(家)', marker='o')
    ax2.tick_params(axis='y', labelcolor=color)

    # 设置标题和图例
    fig.tight_layout()  # 调整子图参数,防止标签重叠
    plt.title('投资者数量趋势')
    fig.legend(loc='upper left', bbox_to_anchor=(0.1, 0.9))

    # 显示图形
    plt.show()


# 调用函数绘制投资者趋势图
plot_investor_trends(process_downloaded_files('downloads'))