预期目的:
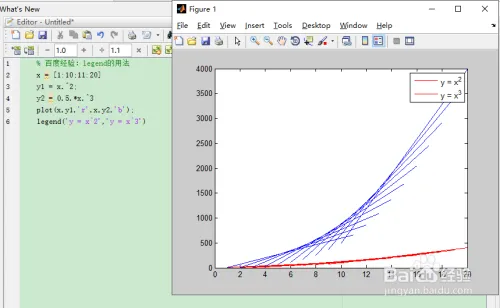
本意想用legend在画图的时候把对应线段的颜色对应起来,实际按照如下代码运行得不到预期的结果。
Matlab
x = [1:10;11:20]

y1 = x.^2;

y2 = 0.5.*x.^3

plot(x,y1,'r',x,y2,'b');

legend('y = x^2','y = x^3')
代码运行结果如下:
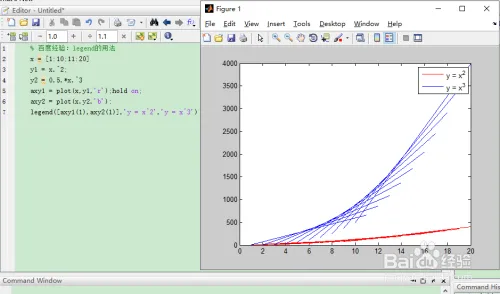
原因
是matlab /octave默认legend时,是按照plot的顺序来的,显然这里我们画了20组线,当然前两条都是红色(r)的啦。
解决方法
代码修改如下:
Matlab
x = [1:10;11:20]

y1 = x.^2;

y2 = 0.5.*x.^3

axy1 = plot(x,y1,'r');hold on;

axy2 = plot(x,y2,'b');

legend([axy1(1),axy2(1)],'y = x^2','y = x^3')
正确的运行结果: