1.缩放和移动功能,配置roam:true
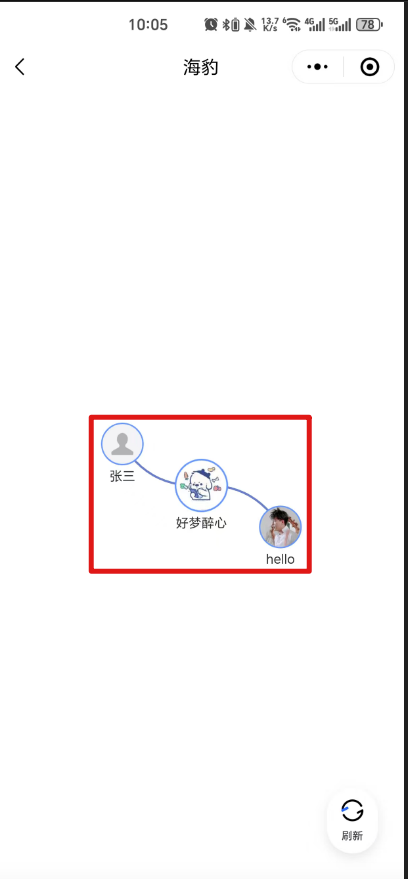
2.他关系网的缩放和移动只能按住具体的关系网矩形才能实现,这体验不好,为了解决这个问题,我添加了两个透明的节点一个在左上角,一个在右下角,这样就能让关系网矩形做到最大,来解决这个问题。
3.设置层级来让不同的层级显示不同颜色的线。
4.关系网矩形具体是指这个红色部分。我的画布设置的宽高满屏,但echarts具体画关系网所用到的画布是根据关系网的大小决定的,具体的功能操作也只在这部分,这就造成了2的问题。
<!DOCTYPE html>
<html lang="en" style="height: 100%">

<head>
    <meta charset="UTF-8">
    <!--    <meta name="viewport" content="width=device-width, initial-scale=1.0">-->
    <meta name="viewport" content="width=device-width, initial-scale=1.0, minimum-scale=1.0, maximum-scale=1.0, user-scalable=no">
    <title>关系网</title>
    <style>
        #main {
            height: 100%;
            width: 100%;
        }
        .refresh{
            position: fixed;
            right: 25px;
            bottom: 25px;
            color: #000;
            padding: 10px 12px;
            border-radius: 100px;
            background: #FFFFFF;
            box-shadow: 0 4px 10px 0 rgba(179, 179, 179, 0.3);
        }
        .refresh-class{
            width: 24px;
            height: 24px;
        }
        .refresh-text{
            font-family: Source Han Sans;
            font-size: 10px;
            font-weight: 500;
            line-height: normal;
            text-align: center;
            letter-spacing: normal;
            color: #383838;
        }
        .loading {
            position: absolute;
            left: 0;
            top: 0;
            width: 100%;
            height: 100vh;
            background: rgba(0, 0, 0, 0.5);
            display: flex;
            justify-content: center;
            align-items: center;
            color: white;
        }

        /* 如果你想要一个旋转动画 */
        .loading::after {
            content: "";
            width: 30px;
            height: 30px;
            border: 3px solid rgba(255, 255, 255, 0.3);
            border-radius: 50%;
            border-top-color: white;
            animation: spin 1s linear infinite;
        }

        @keyframes spin {
            to { transform: rotate(360deg); }
        }
    </style>
</head>

<body style="height: 100%; margin: 0">
<div id="main"></div>
<div id="loading" class="loading"></div>
<div class="refresh" id="refresh">
    <img src="./image/refresh.png" alt="" class="refresh-class">
    <div class="refresh-text">刷新</div>
</div>

<script src="./static/echarts.min.js"></script>
<script src="./static/dayjs.js"></script>
<script src="./static/md5.js"></script>
<script src="./static/wechat.env.js"></script>
<script>
  const salt = '81ad0be7fd53914f8cf8193c1886f635';
  const urlParams = new URLSearchParams(window.location.search)
  const token = urlParams.get('token') // 回调code
  const id = urlParams.get('id') // 回调code
  const defaultAvatar = `${sqbApiHost}/weapp/wechat/default-avatar.png`
  function initParams() {
    const salt = '81ad0be7fd53914f8cf8193c1886f635'
    const timestamp = dayjs().unix();
    const sign = hex_md5(timestamp + salt);
    const channel = 3;
    const reqConfig = {
      timestamp,
      sign,
      channel,
    };
    return reqConfig;
  }
  // post请求方法
  function postRequest(url, data, additionalHeaders = {}) {
    const headers = {
      'Content-Type': 'application/json',
      ...additionalHeaders // 允许传入额外的头部信息
    };

    const reqUrl = sqbApiHost + url
    const reqData = {
      ...initParams(),
      ...data,
    }
    return fetch(reqUrl, {
      method: 'POST', // 指定请求方法为POST
      headers: headers,
      body: JSON.stringify(reqData) // 将JavaScript对象转换为JSON字符串
    })
      .then(response => {
        if (!response.ok) { // 检查响应是否成功
          throw new Error('Network response was not ok ' + response.statusText);
        }
        return response.json(); // 假设服务器返回的是JSON格式的数据
      })
      .catch(error => {
        console.error('There has been a problem with your fetch operation:', error);
        throw error; // 重新抛出错误以便调用者处理
      });
  }
</script>
<script>
  function assignNodeLevels(nodes = [], links = []) {
    // 创建一个映射以便快速通过id查找节点
    const nodeMap = new Map();
    nodes.forEach(node => {
      nodeMap.set(node.id, node);
    });

    // 找出根节点(没有入边的节点)
    const rootNodes = nodes.filter(node => {
      return !links.some(link => link.target === node.id);
    });

    // 如果没有根节点,可能有环,选择第一个节点作为根
    if (rootNodes.length === 0 && nodes.length > 0) {
      rootNodes.push(nodes[0]);
    }

    // 为每个根节点分配层级并开始遍历
    rootNodes.forEach(rootNode => {
      rootNode.category = 0;
      traverseGraph(rootNode.id, 0);
    });

    // 遍历图的辅助函数
    function traverseGraph(currentNodeId, currentCategory) {
      // 找出所有以当前节点为起点的连接
      const outgoingLinks = links.filter(link => link.source === currentNodeId);

      // 遍历这些连接
      outgoingLinks.forEach(link => {
        const targetNode = nodeMap.get(link.target);
        // 如果目标节点还没有层级,或者当前路径提供了更大的层级
        if (targetNode.category === undefined || currentCategory + 1 > targetNode.category) {
          targetNode.category = currentCategory + 1;
          traverseGraph(link.target, targetNode.category);
        }
      });
    }

    // 处理可能存在的孤立节点(没有连接的节点)
    nodes.forEach(node => {
      if (node.category === undefined) {
        node.category = -1; // 表示孤立节点
      }
    });

    return nodes;
  }

  async function formatterNodes(nodes = []) {
    // 使用 Promise.all  + map 确保所有异步任务完成
    const processedNodes = await Promise.all(
      nodes.map(async  (it) => {
        // 同步处理 name 和 symbol
        it.name  = it.name.toString();

        if (!it?.symbol) {
          it.symbol  = defaultAvatar;
        }

        // 特殊处理 category = 0 的节点
        if (it.category  === 0) {
          it.x = window.innerWidth / 2;
          it.y = window.innerHeight / 2;
          it.fixed  = true;
          // it.itemStyle  = {
          //   borderColor: '#FFD700',
          //   borderWidth: 3,
          //   borderType: 'solid'
          // };
        }

        // 异步获取头像并修改 symbol
        const avatar = await getImgData(it.symbol);

        it.symbol  = `image://${avatar}`;

        it.symbolSize= getValueByLevelLinear(it.category)
        return it; // 返回处理后的节点
      })
    );

    return processedNodes;
  }


  function convertToStringTypes(links = []) {
    return links?.map(link => ({
      source: String(link?.source),
      target: String(link?.target)
    }));
  }
  function getMaxCategory(nodes) {
    if (!nodes.length) return 0; // 空数组返回 0
    return Math.max(...nodes.map(node => node.category));
  }
  function createLevelArray(maxLevel) {
    return Array.from({ length: maxLevel + 1 }, (_, index) => ({
      name: String.fromCharCode(65 + index) // A, B, C...
    }));
  }
  function getValueByLevelLinear(level) {
    const max = 50;
    const min = 20;
    const step = 10; // 每增加一级,减少 5
    let value = max - level * step;
    return Math.max(min,  value); // 确保不低于 20
  }
</script>
<script>
  var chartDom = document.getElementById('main');
  var myChart = echarts.init(chartDom);
  var option;
  var oldOption;
  function getImgData(imgSrc) {
    var fun = function (resolve) {
      const canvas = document.createElement('canvas');
      const context = canvas.getContext('2d');
      const img = new Image();
      img.crossOrigin = ''; // 如果需要跨域访问图片,请确保服务器支持CORS

      img.onload = function () {
        // 计算圆直径(取原图宽高中较小的一个值以保证圆形完全填充)
        const diameter = Math.min(img.width, img.height);
        const radius = diameter / 2;

        // 设置画布大小为正方形,边长等于直径
        canvas.width = diameter;
        canvas.height = diameter;

        // 清除画布并开始绘制
        context.clearRect(0, 0, diameter, diameter);
        context.save();
        context.beginPath();
        context.arc(radius, radius, radius, 0, 2 * Math.PI); // 画出圆
        context.clip(); // 裁剪上面的圆形

        // 确保图像在圆形区域内居中显示
        const x = (diameter - img.width) / 2;
        const y = (diameter - img.height) / 2;
        context.drawImage(img, x, y, img.width, img.height, 0, 0, diameter, diameter);

        // 添加边框
        const borderWidth = 4; // 边框宽度,可以根据需求调整
        context.lineWidth = borderWidth;
        context.strokeStyle = '#5994ff'; // 边框颜色
        context.beginPath();
        context.arc(radius, radius, radius - borderWidth / 2, 0, 2 * Math.PI); // 绘制边框的位置需考虑边框宽度
        context.stroke();

        context.restore(); // 还原状态
        resolve(canvas.toDataURL('image/png', 1));
      };
      img.src = imgSrc;
    };

    var promise = new Promise(fun);
    return promise;
  }
  function calculateGridPositions(rows, cols, spacing = 100) {
    const positions = [];
    for (let i = 0; i < rows; i++) {
      for (let j = 0; j < cols; j++) {
        positions.push({
          x: j * spacing - (cols * spacing) / 2, // 水平居中
          y: i * spacing - (rows * spacing) / 2,  // 垂直居中
          fixed: true
        });
      }
    }
    return positions;
  }

  let nodeData = [];
  let linkData = [];
  // 请求接口获取数据
  function getData(params) {
    postRequest('/api/net_disk_file/network', {
      token: token,
      id: +id,
    }).then(async res=>{
      // console.log('res', res);
      nodeData = await formatterNodes(assignNodeLevels(res.data.nodes, res.data.links))
      const fixedList = [
        {
          id: -1,
          name: "-1",
          user_name: "-1",
          symbol: "",
          isParent: false,
          x: -99999 * window.innerWidth,
          y: -99999 * window.innerHeight,
          fixed: true,
          symbolSize: 50,
          itemStyle: { opacity: 0 },
        },
        {
          id: -2,
          name: "-2",
          user_name: "-2",
          symbol: "",
          isParent: false,
          x: 99999 * window.innerWidth,
          y: 99999 * window.innerHeight,
          fixed: true,
          symbolSize: 50,
          itemStyle: { opacity: 0 },
        }
      ]
      nodeData = [...nodeData, ...fixedList]
      console.log('nodeData', nodeData);

      linkData = convertToStringTypes(res.data.links)
      const maxLevel = getMaxCategory(nodeData);
      const categories = createLevelArray(maxLevel);
      initEchart(nodeData, linkData, categories);
    }).catch(err=>{
      console.log('err', err);
    }).finally(()=>{
    })
  }

  function initEchart(nodeData, linkData, categories) {
    option = {
      // title: {
      //     text: '关系网'
      // },
      tooltip: {
        showContent: false
      },
      animationDurationUpdate: 1500,
      animationEasingUpdate: 'quinticInOut',
      series: [
        {
          type: 'graph',
          legendHoverLink: false,
          layout: 'force',
          symbolSize: 30,
          roam: true,
          label: {
            show: true,
            position: 'bottom', // 名称显示在头像下方
            color: '#333',
            formatter: function (params) {
              return params.data.user_name;
            },
          },
          edgeSymbolSize: [4, 10],
          edgeLabel: {
            fontSize: 20
          },
          focusNodeAdjacency: false,
          force: {
            repulsion: 1000,       // 减小节点间斥力(值越小节点越紧凑)
            edgeLength: 50,       // 缩短边的理想长度(值越小连线越短)
            gravity: 0.2,         // 适当增加向心力(值越大节点越集中)
            friction: 0.6,         // 增加摩擦系数(降低节点运动速度)
          },
          data: nodeData,
          links: linkData,
          scaleLimit: {
            min: 0.3,         // 最小缩小到30%
            max: 3            // 最大放大到300%
          },
          categories: categories,

          emphasis: {
            focus: 'adjacency',
            lineStyle: {
              width: 10
            }
          },
          lineStyle: {
            color: 'source',
            opacity: 0.9,
            width: 2,
            curveness: 0.3
          }
        }
      ]
    };

    oldOption = option;
    option && myChart.setOption(option);
    // 初始化图表后执行
    myChart.dispatchAction({
      type: 'downplay',          // 先取消所有高亮
      seriesIndex: 0
    });
    // myChart.dispatchAction({
    //     type: 'highlight',         // 高亮第一个节点
    //     seriesIndex: 0,
    //     dataIndex: 0,
    //     itemStyle: {               // 覆盖高亮样式
    //         borderColor: '#00FF00',  // 绿色边框
    //         borderWidth: 4
    //     }
    // });
    document.getElementById('loading').style.display = 'none';
    document.getElementById('refresh').style.display = 'block';
  }

  document.addEventListener('DOMContentLoaded', function() {
    document.getElementById('loading').style.display = 'flex';
    document.getElementById('refresh').style.display = 'none';
    getData();
  });
  document.body.addEventListener('touchmove', function (e) {
    e.preventDefault();
  }, {
    passive: false
  });
  document.getElementById('refresh').addEventListener('click', function(params) {
    myChart.dispatchAction({  type: 'restore' });
  })
</script>
</body>

</html>