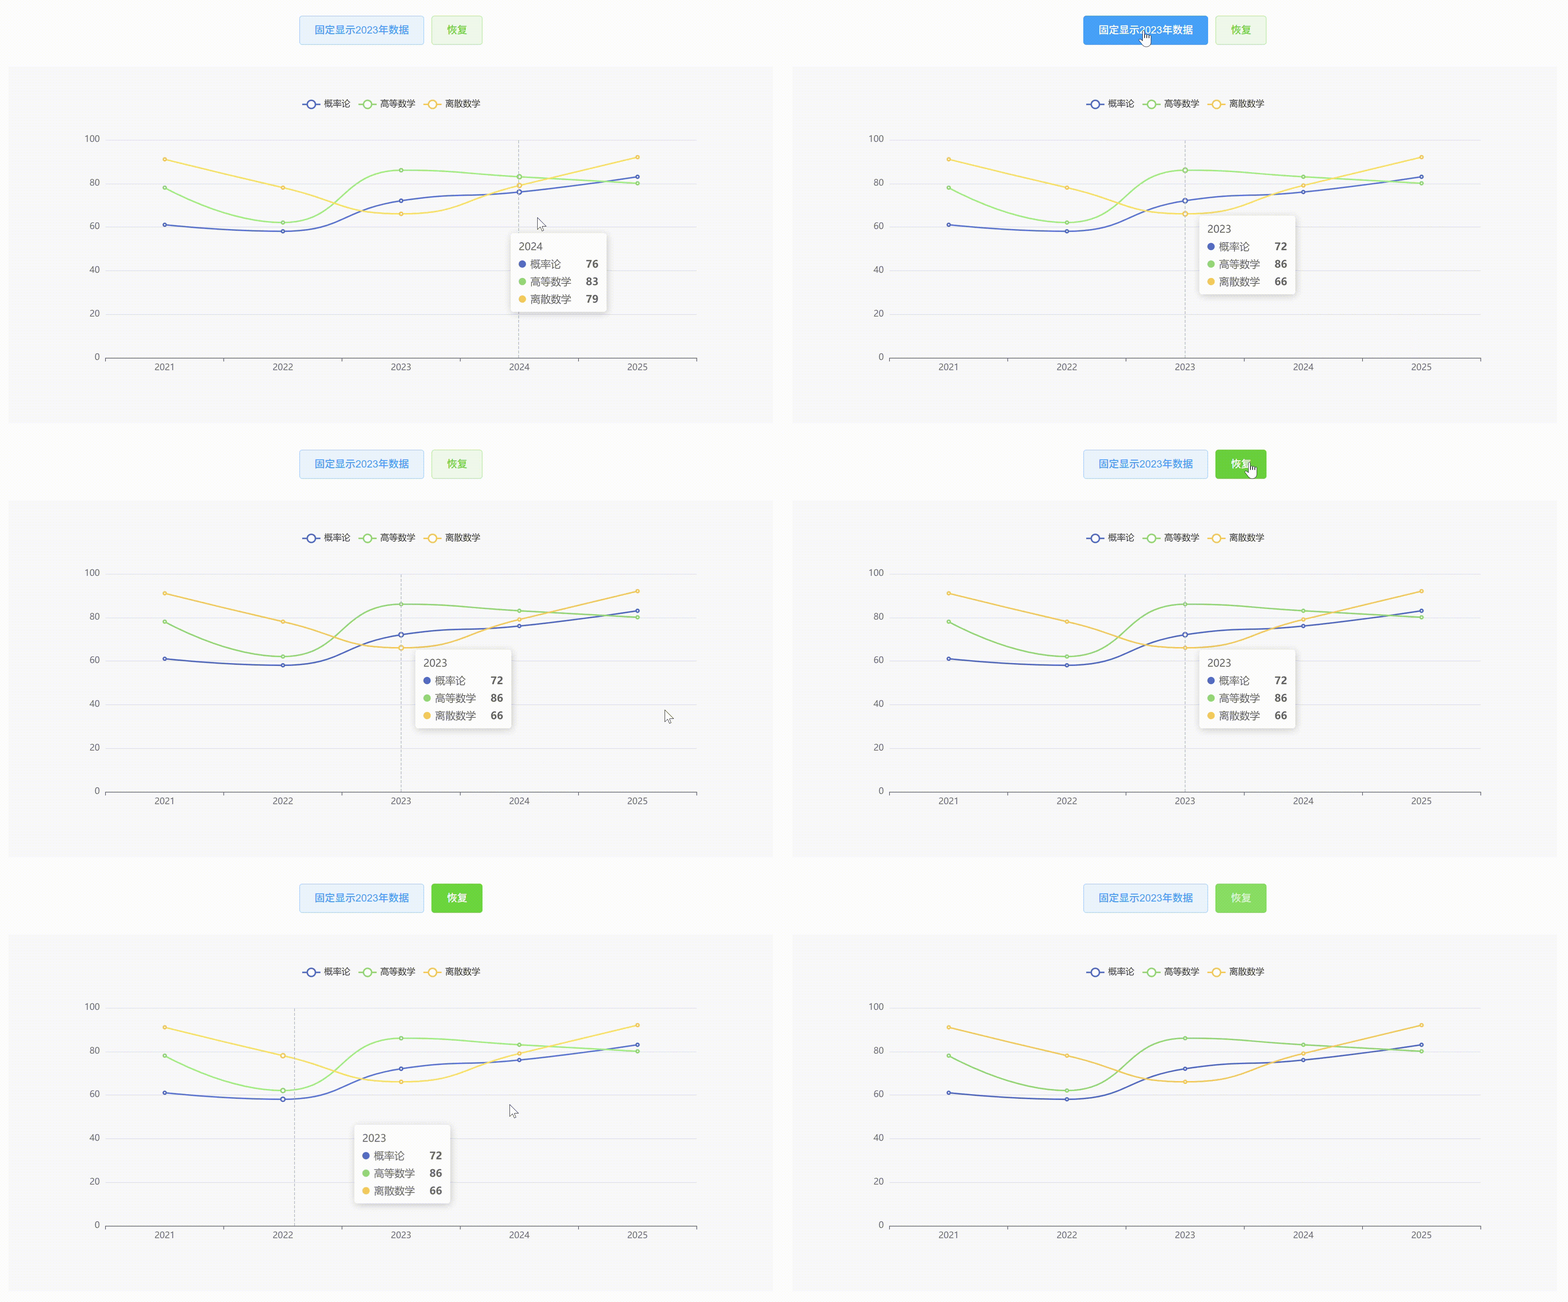
html
复制代码
<template>
  <div class="com-wapper">
    <div class="func-btns">
      <el-button type="primary" plain @click="showPoint('2023')">
        固定显示2023年数据
      </el-button>
      <el-button type="success" plain @click="clearFixedTooltip">
        恢复
      </el-button>
    </div>
    <div ref="chartRef" class="chart-content"></div>
  </div>
</template>

<script>
import * as echarts from "echarts";
export default {
  name: "com-page",
  components: {},
  props: {},
  data() {
    return {
      myData: {
        xData: ["2021", "2022", "2023", "2024", "2025"],
        dataList: [
          {
            name: "概率论",
            value: [61, 58, 72, 76, 83],
          },
          {
            name: "高等数学",
            value: [78, 62, 86, 83, 80],
          },
          {
            name: "离散数学",
            value: [91, 78, 66, 79, 92],
          },
        ],
      },
      myChart: null,
      option: null,
      isShow: false,
    };
  },
  mounted() {
    this.drawingChart();
    window.addEventListener("resize", this.resize);
  },
  methods: {
    /**
     * 画图
     */
    drawingChart() {
      this.myChart = echarts.init(this.$refs.chartRef);
      this.option = {
        grid: {
          containLabel: true,
        },
        legend: {
          data: this.myData.dataList.map((item) => {
            return {
              name: item.name,
            };
          }),
        },
        tooltip: {
          show: true,
          trigger: "axis",
          alwaysShowContent: false,
        },
        xAxis: [
          {
            type: "category",
            data: this.myData.xData,
            boundaryGap: true,
          },
        ],
        yAxis: [
          {
            splitNumber: 5,
            min: 0,
            max: 100,
          },
        ],
        series: this.myData.dataList.map((item) => {
          return {
            type: "line",
            data: item.value,
            name: item.name,
            smooth: true,
            showSymbol: true,
          };
        }),
      };
      this.myChart.setOption(this.option);
    },
    /**
     * 重置图表
     */
    resize() {
      this.myChart && this.myChart.resize();
    },
    /**
     * 显示固定点的tooltip
     */
    showPoint(point) {
      let xAxisData = this.myData.xData; // 横轴数据
      const index = xAxisData.findIndex((item) => item === point);
      if (index !== -1) {
        // 显示当前数据tooltip
        this.myChart.dispatchAction({
          type: "showTip",
          seriesIndex: 0,
          dataIndex: index, // 要显示的数据点索引值
        });
        // 修改配置,保持tooltip一直显示
        this.myChart.setOption({
          tooltip: {
            alwaysShowContent: true,
          },
        });
        // 临时禁用鼠标事件
        this.myChart.getZr().off("globalout");
        this.myChart.getZr().off("click");
        this.myChart.getZr().off("mousemove");
        // 标记一下
        this.isShow = true;
      }
    },
    /**
     * 恢复tooltip的正常使用
     */
    clearFixedTooltip() {
      if (this.isShow) {
        this.isShow = false;
        // 取消常显配置
        this.myChart.setOption({
          tooltip: {
            alwaysShowContent: false,
          },
        });
        // 恢复默认交互,重新绑定mousemove和globalout
        const zr = this.myChart.getZr();
        const that = this;
        zr.on("mousemove", function (e) {
          that.myChart._api.dispatchAction({
            type: "showTip",
            x: e.offsetX,
            y: e.offsetY,
          });
        });
        zr.on("globalout", function () {
          that.myChart._api.dispatchAction({
            type: "hideTip",
          });
        });
        // 隐藏当前tooltip
        this.myChart.dispatchAction({
          type: "hideTip",
        });
      }
    },
  },
  beforeDestroy() {
    window.removeEventListener("resize", this.resize);
    this.myChart && this.myChart.dispose();
  },
};
</script>

<style lang='scss' scoped>
.com-wapper {
  height: 100%;
  .func-btns {
    text-align: center;
  }
  .chart-content {
    width: 100%;
    height: 70%;
    padding-top: 40px;
    margin-top: 30px;
    background: rgba(237, 237, 237, 0.2);
  }
}
</style>
