在微服务架构和云原生应用广泛采用的今天,.NET Core 应用被越来越多地部署在 Kubernetes 集群中。然而,一旦这些应用出现性能瓶颈,仅靠传统的日志和指标可能无法定位问题的根本原因。
从 .NET Core 3 开始,微软推出了一系列跨平台的运行时诊断工具,比如:
-
dotnet-counters:用于查看实时性能计数器 -
dotnet-dump:抓取和分析内存转储 -
dotnet-trace:采集运行时事件和 CPU 栈信息 -
dotnet-gcdump:采集垃圾回收(GC)相关信息
这些工具通过 .NET Core 的 Diagnostic Server 与目标进程进行通信,在 Linux 系统中,它们通过 Unix Domain Socket 进行 IPC 交互。默认的 Socket 文件位于 /tmp 目录下。
使用 Sidecar 模式部署诊断工具
在容器环境下部署诊断工具通常有两种方式:
-
将工具和应用程序打包在同一个镜像中
-
使用 sidecar 容器独立运行诊断工具
第一种方式会导致镜像体积变大,且工具升级不方便。因此,推荐使用 Sidecar 容器:它与主容器在同一个 Pod 中运行,共享网络和存储卷,适合部署监控或日志收集等辅助任务。
我们将构建一个 Sidecar 模式的诊断方案,解决以下三个关键问题:
-
如何从 Sidecar 容器访问主容器内的 .NET Core 进程
-
如何共享
/tmp目录以建立 IPC 通道 -
如何持久化诊断数据
案例演示:分析一个 ASP.NET Core Worker Service
首先,我们创建一个简单的 Worker Service 应用,它会周期性计算某个位置的质数(模拟 CPU 密集型任务):
csharp
_logger.LogInformation("Prime number at position {position} is {value}", pos, FindPrimeNumber(pos));然后为该应用构建镜像并推送到容器仓库(如 Docker Hub 或 Azure 容器注册表)。
接着,我们构建第二个容器镜像,下面是我们构建该 Sidecar 容器镜像所用的 Dockerfile:
dockerfile
FROM mcr.microsoft.com/dotnet/sdk:5.0 as tools

# 安装所需的 .NET 诊断工具
RUN dotnet tool install --tool-path /tools dotnet-trace
RUN dotnet tool install --tool-path /tools dotnet-dump
RUN dotnet tool install --tool-path /tools dotnet-counters

# 使用更小的运行时镜像作为最终镜像,减少体积
FROM mcr.microsoft.com/dotnet/runtime:5.0 AS runtime

# 将工具复制到最终镜像中
COPY --from=tools /tools /tools

# 添加工具目录到 PATH,确保容器启动后可以直接调用 dotnet 工具
ENV PATH="/tools:${PATH}"
WORKDIR /tools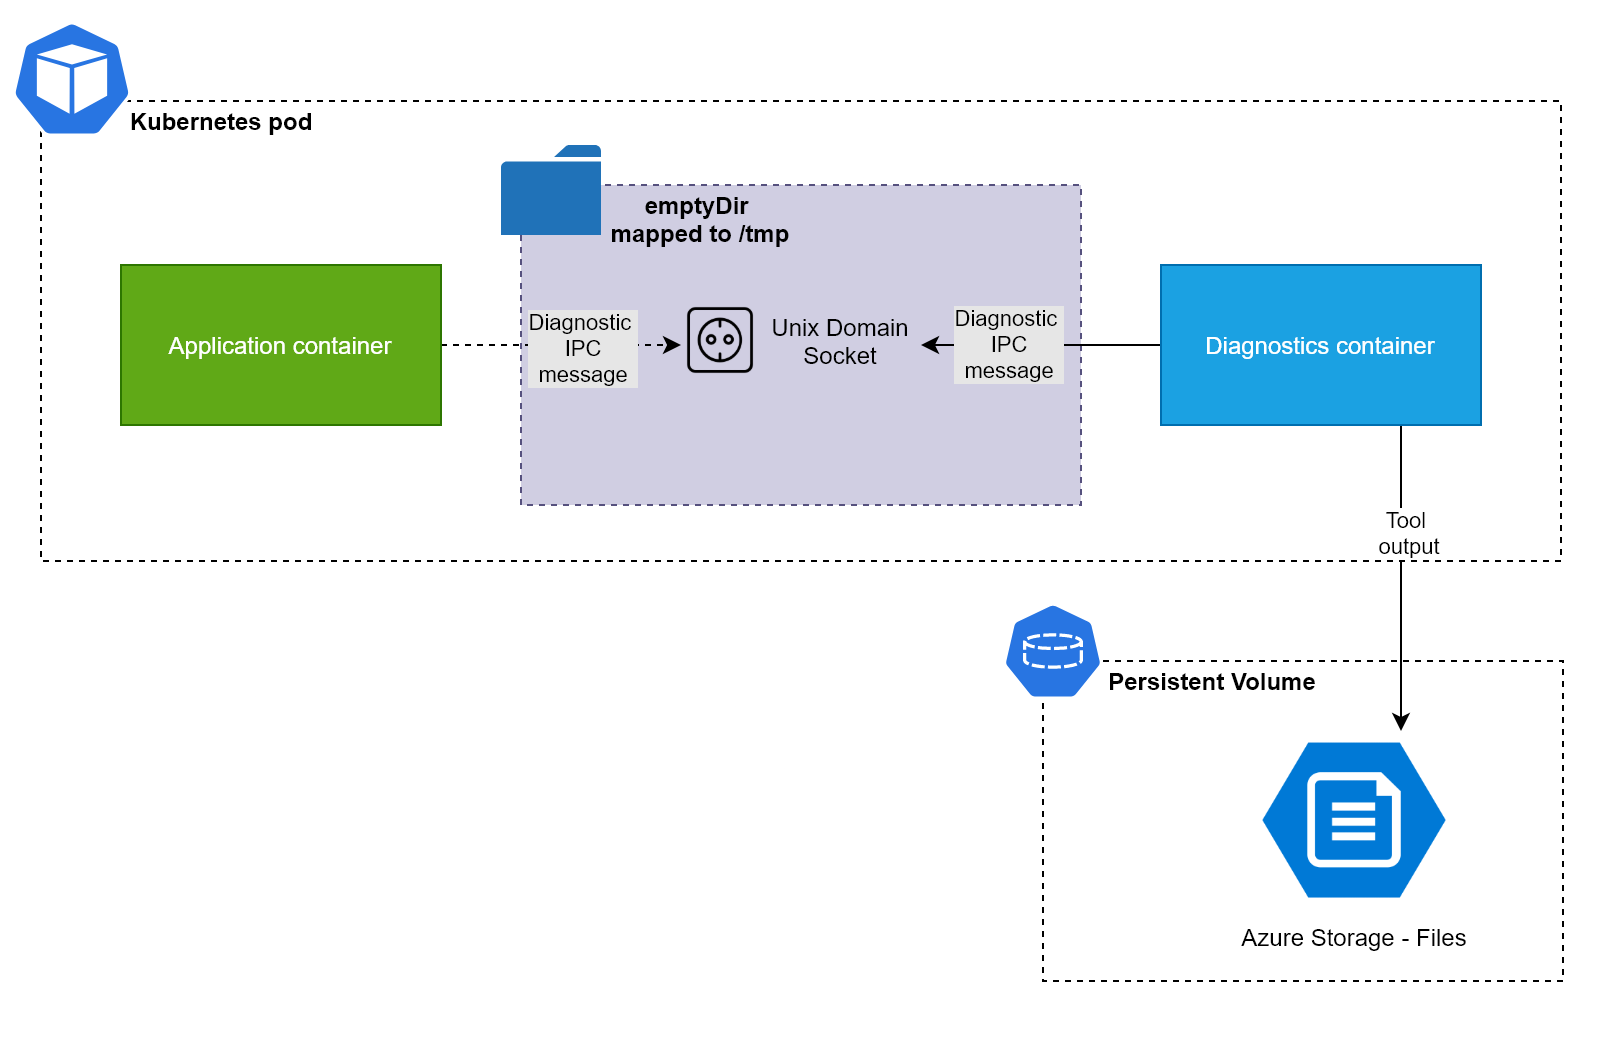
Kubernetes 部署设计
为了持久化诊断数据,我们需要一个挂载的共享存储。在 Azure Kubernetes Service (AKS) 中,我们可以动态创建基于 Azure Files 的存储卷。以下是关键的 YAML 片段:
yaml
apiVersion: apps/v1
kind: Deployment
spec:
  template:
    spec:
      shareProcessNamespace: true
      containers:
        - name: toolbox
          image: <your-sidecar-image>
          volumeMounts:
            - name: tmp
              mountPath: /tmp
            - name: data
              mountPath: /data
        - name: app
          image: <your-app-image>
          volumeMounts:
            - name: tmp
              mountPath: /tmp
      volumes:
        - name: tmp
          emptyDir: {}
        - name: data
          persistentVolumeClaim:
claimName: monitor-azfiles注意点:
-
shareProcessNamespace: true使得 Sidecar 可以看到主容器的进程 -
/tmp目录通过emptyDir共享,建立 IPC 通道 -
Sidecar 容器的
/data目录挂载 Azure Files 持久卷,用于存储诊断结果 -
设置
stdin: true和tty: true保证 Sidecar 容器处于可交互状态
部署完成后,你可以使用 kubectl exec 命令进入 Sidecar 容器:
bash
kubectl exec -it <pod-name> -n net-worker -c toolbox -- /bin/bash实际运行诊断工具
1. 使用 dotnet-trace 采集追踪数据
首先获取主容器的进程 ID:
bash
dotnet-trace ps然后开始采集数据并将其保存到挂载的共享目录中:
bash
dotnet-trace collect -p 13 --format Chromium -o /data/trace.json下载 /data/trace.json 后,可以用 Chrome 或 Edge 浏览器访问 chrome://tracing 或 edge://tracing 查看可视化结果。
2. 使用 dotnet-counters 查看性能指标
bash
dotnet-counters collect --process-id 13 --refresh-interval 10 --output /data/counters --format json同样可以将 JSON 文件下载后用 VS Code 打开分析。
总结
通过将诊断工具打包进 Sidecar 容器,并结合共享的 /tmp 目录和持久卷存储,我们可以在 Kubernetes 中高效、灵活地为 .NET Core 应用进行性能诊断。这种方式解耦了诊断工具与主应用容器,具有良好的可维护性和扩展性。