这里写自定义目录标题
描述
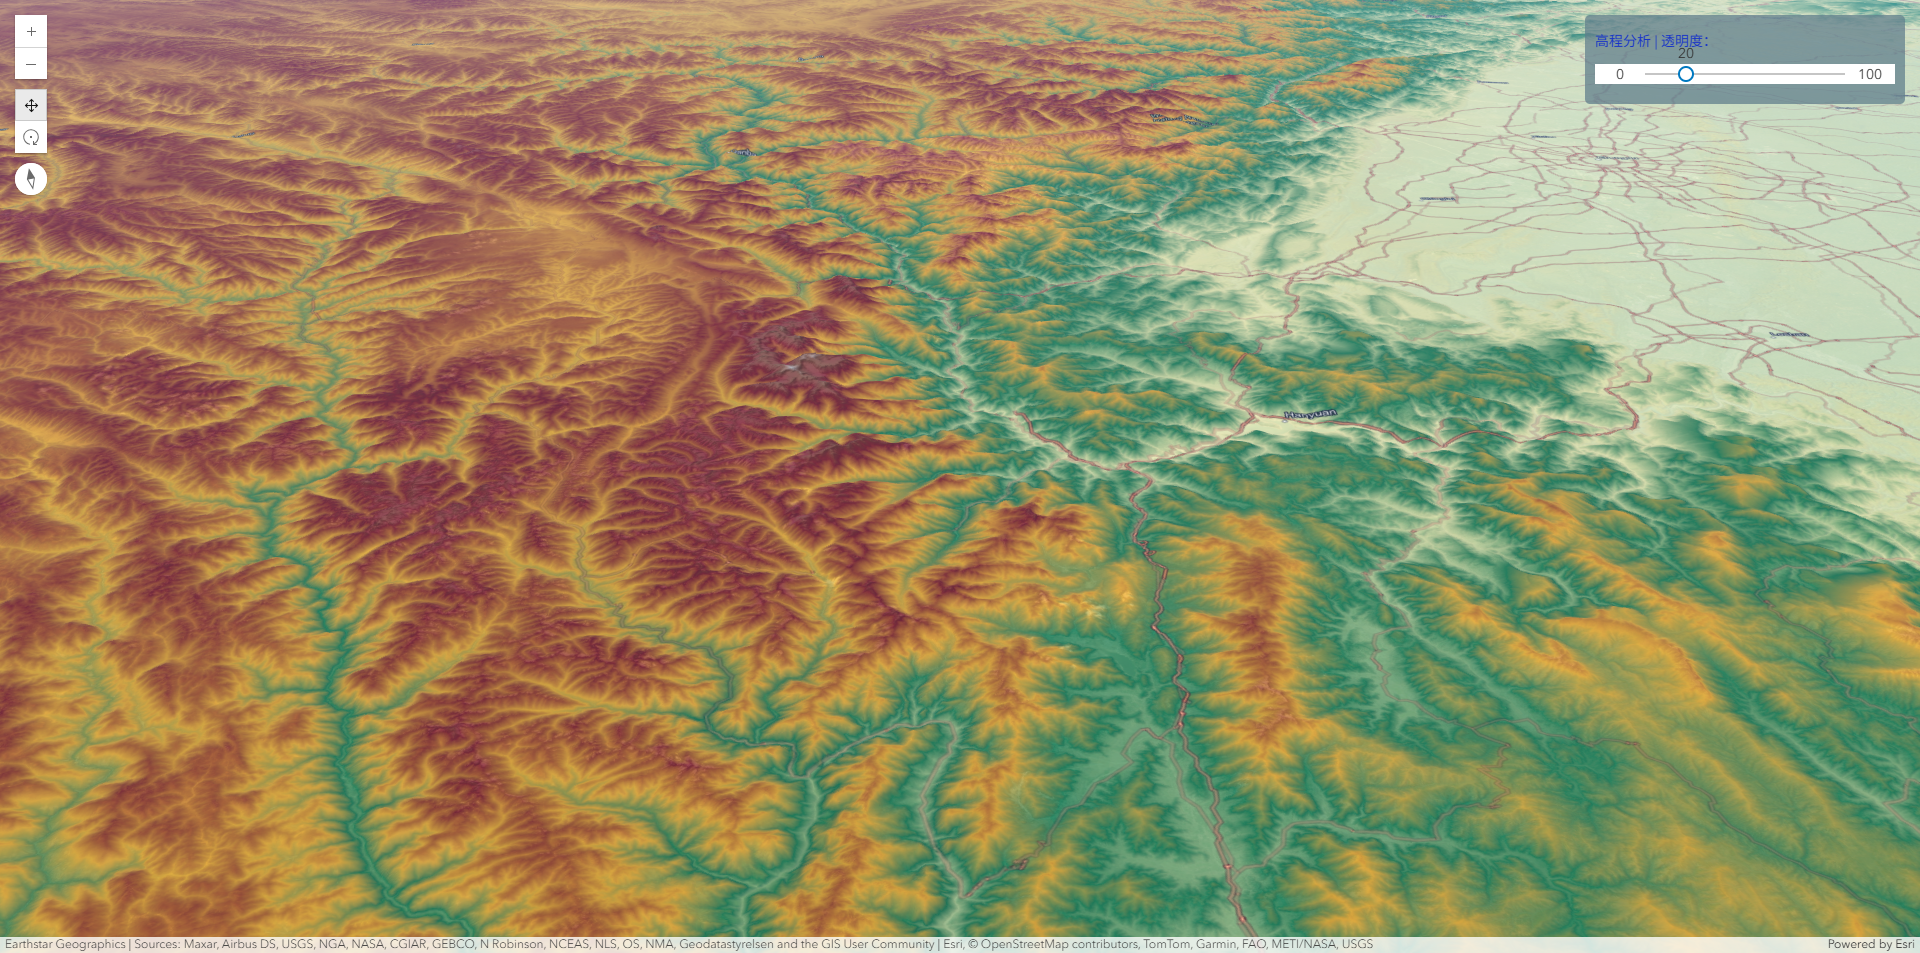
高程分析是地理信息系统(GIS)中的核心功能之一,主要涉及对地表高度数据(数字高程模型, DEM)的处理和分析。
ArcGIS For JavaScript4.32版本的发布,提供了Web端的针对高程分析的功能。
代码实现
javascript
<!doctype html>
<html lang="en">

<head>
    <meta charset="utf-8" />
    <meta name="viewport" content="initial-scale=1,maximum-scale=1,user-scalable=no" />
    <title>地形高程分析</title>

    <link rel="stylesheet" href="https://js.arcgis.com/4.32/esri/themes/light/main.css" />
    <script src="https://js.arcgis.com/4.32/"></script>
    <style>
        html,
        body,
        #viewDiv {
            padding: 0;
            margin: 0;
            height: 100%;
            width: 100%;
            background-color: ghostwhite;
        }

        #opacitySliderDiv {
            background: #607d8bbb;
            padding: 10px;
            border-radius: 5px;

        }

        #opacitySliderDiv label {
            margin: 5px 0;
            text-align: left;
            display: block;
            color: #1833c8;
        }
    </style>
    <script>
        require([
            "esri/Map",
            "esri/views/SceneView",
            "esri/layers/support/RasterFunction",
            "esri/layers/support/rasterFunctionUtils",
            "esri/layers/ImageryTileLayer",
            "esri/widgets/Slider",
            "esri/widgets/Expand"
        ], (
            Map,
            SceneView,
            RasterFunction,
            rasterFunctionUtils,
            ImageryTileLayer,
            Slider,
            Expand

        ) =>
            (() => {
                let customColor = [0, 122, 194];
                const customAnalysisParams = {
                    elevation: { min: 2000, max: 9000 },
                    slope: { min: 10, max: 90 },
                    aspects: { N: false, NE: false, E: false, SE: true, S: true, SW: true, W: false, NW: false }
                };

                function createCustomAnalysis(color = customColor) {

                    // Mask out elevation outside of parameter range
                    const elevationMask = rasterFunctionUtils.mask({
                        includedRanges: [[customAnalysisParams.elevation.min, customAnalysisParams.elevation.max]],
                        noDataValues: [[-9999]],
                        noDataInterpretation: "match-any"
                    });

                    // Compute slope on masked elevation
                    const slopeFunction = rasterFunctionUtils.slope({
                        slopeType: "degree",
                        zFactor: 1,
                        raster: elevationMask
                    });

                    // Mask out slopes outside of parameter range
                    const slopeMask = rasterFunctionUtils.mask({
                        includedRanges: [[customAnalysisParams.slope.min, customAnalysisParams.slope.max]],
                        noDataValues: [[-9999]],
                        noDataInterpretation: "match-any",
                        raster: slopeFunction
                    });

                    // Map included slopes >= 0 to 1
                    const greaterThanSlope0 = rasterFunctionUtils.greaterThanEqual({
                        raster: slopeMask,
                        raster2: 0
                    });

                    // Compute aspect on masked elevation
                    const aspectFunction = rasterFunctionUtils.aspect({
                        raster: elevationMask
                    });

                    // Map aspect as 1 (include) or 0 (exclude) according to parameters
                    const remapAspectFunction = rasterFunctionUtils.remap({
                        rangeMaps: [
                            { range: [-Infinity, 0], output: 1 }, // Include flats
                            { range: [360, Infinity], output: 1 }, // Include flats
                            { range: [337.5, 360], output: +customAnalysisParams.aspects.N },
                            { range: [0, 22.5], output: +customAnalysisParams.aspects.N },
                            { range: [22.5, 67.5], output: +customAnalysisParams.aspects.NE },
                            { range: [67.5, 112.5], output: +customAnalysisParams.aspects.E },
                            { range: [112.5, 157.5], output: +customAnalysisParams.aspects.SE },
                            { range: [157.5, 202.5], output: +customAnalysisParams.aspects.S },
                            { range: [202.5, 247.5], output: +customAnalysisParams.aspects.SW },
                            { range: [247.5, 292.5], output: +customAnalysisParams.aspects.W },
                            { range: [292.5, 337.5], output: +customAnalysisParams.aspects.NW }
                        ],
                        raster: aspectFunction
                    });

                    // Combine slope and aspect rasters
                    const combineAspectSlope = rasterFunctionUtils.booleanAnd({
                        raster: greaterThanSlope0,
                        raster2: remapAspectFunction
                    });

                    const colorMapFinal = rasterFunctionUtils.colormap({
                        colormap: [[1, ...color]],
                        raster: combineAspectSlope
                    });

                    return colorMapFinal;
                }

                const analysisLayer = new ImageryTileLayer({
                    url: "https://elevation3d.arcgis.com/arcgis/rest/services/WorldElevation3D/Terrain3D/ImageServer",
                    title: "Custom Analysis",
                    rasterFunction: createCustomAnalysis(customColor),
                    opacity: 0.8
                });


                let scene = new Map({
                    basemap: 'hybrid',
                    ground: 'world-elevation'
                });
                scene.add(analysisLayer);

                let view = new SceneView({
                    container: 'viewDiv',
                    map: scene,
                    camera: {
                        heading: 11.318022273157128,
                        fov: 55,
                        tilt: 64.97027885113135,
                        position: {
                            longitude: 102.01508901208386,
                            latitude: 28.892260981774943,
                            z: 19722.28977170773
                        }
                    }
                });

                view.when(function () {
                    console.log(view.map);
                    analysisLayer.rasterFunction = colorMapElevation;
                    const slider = new Slider({
                        container: "opacitySlider",
                        min: 0,
                        max: 100,
                        values: [20],
                        steps: 1,
                        snapOnClickEnabled: false,
                        visibleElements: {
                            labels: true,
                            rangeLabels: true
                        }
                    });
                    slider.on('thumb-drag', (evt) => {
                        if (evt.state === 'stop') {
                            analysisLayer.opacity = 1 - evt.value / 100;
                        }
                    });
                })

                const colorMapElevation = rasterFunctionUtils.colormap({
                    colorRampName: "elevation1"
                });
                view.ui.add('opacitySliderDiv', 'top-right')
            })());
    </script>
</head>
<body>
    <div id="viewDiv">
        <div id="opacitySliderDiv">
            <label htmlFor="bloomContrast">高程分析 | 透明度:</label>
            <div id="opacitySlider" style="width: 300px;height: 20px;margin: 10px 0px">
            </div>
        </div>
    </div>
    </div>
</body>

</html>
结果