
以这样一个仪表盘为例
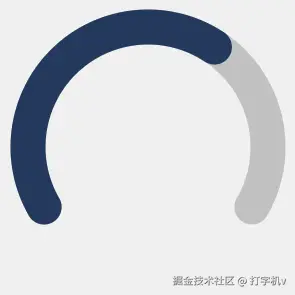
- 首先要绘制一个底色圆弧
- 绘制一个进度圆弧,和底色圆弧重叠
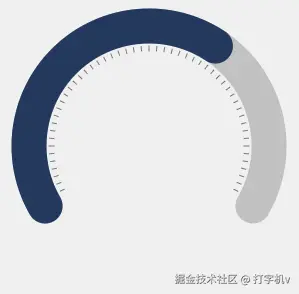
- 绘制第二层的刻度线
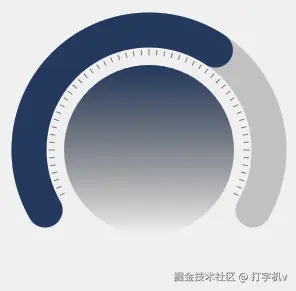
- 绘制里面的仪表盘面板
- 绘制文案
- 增加动画
1. 绘制底色圆弧
html
<!DOCTYPE html>
<html lang="en">
  <head>
    <meta charset="UTF-8" />
    <meta name="viewport" content="width=device-width, initial-scale=1.0" />
    <title>进度圆弧</title>
    <style>
      body {
        display: flex;
        justify-content: center;
        align-items: center;
        height: 100vh;
      }
      canvas {
        background-color: #f0f0f0;
      }
    </style>
  </head>
  <body>
    <canvas id="canvas" width="300" height="300"></canvas>
    <script>
      const canvas = document.getElementById('canvas');
      const ctx = canvas.getContext('2d');
      // 获取canvas的中心点 ( centerX , centerY )就是中心点
      const centerX = canvas.width / 2;
      const centerY = canvas.height / 2;
      // 设置半径
      const radius = 120;
      // 圆弧宽度
      const lineWidth = 35;
      // 圆弧起始角度
      const startAngle = (Math.PI * 150) / 180; // 150°
      // 圆弧结束角度,起始角度 + 你圆弧一共想显示多少度,这里希望显示240度
      const endAngle = (Math.PI * (150 + 240)) / 180; // 390°,共240°
      /**
       * 绘制圆弧函数
       * @param {number} centerX 圆心x
       * @param {number} centerY 圆心y
       * @param {number} radius 半径
       * @param {number} startAngle 圆弧起始角度
       * @param {number} endAngle 圆弧结束角度
       * @param {number} lineWidth 圆弧宽度
       * @param {string} color 圆弧颜色(单色)
       */
      const handleDrawArc = (options = { centerX, centerY, radius, startAngle, endAngle, lineWidth, color }) => {
        // 1. 绘制底色圆弧
        ctx.beginPath();
        ctx.lineWidth = options.lineWidth;
        ctx.strokeStyle = options.color; // 你想要的底色
        // 设置圆弧的端点样式
        ctx.lineCap = 'round';
        // 添加圆弧路径,参数分别是
        // 圆心X坐标,圆心Y坐标,半径,起始角度,结束角度,是否逆时针
        // 起始绘制角度以X轴方向开始计算,也就是起始点是3点钟方向,顺时针绘制
        ctx.arc(options.centerX, options.centerY, options.radius, options.startAngle, options.endAngle, false);
        // 绘制圆弧线条
        ctx.stroke();
      };
      // 绘制底色圆弧
      handleDrawArc({
        centerX,
        centerY,
        radius,
        startAngle,
        endAngle,
        lineWidth,
        color: '#C1C1C1', // 你想要的底色
      });
    </script>
  </body>
</html>
效果:

2. 绘制一个进度圆弧,和底色圆弧重叠
js
<!DOCTYPE html>
<html lang="en">
  <head>
    <meta charset="UTF-8" />
    <meta name="viewport" content="width=device-width, initial-scale=1.0" />
    <title>进度圆弧</title>
    <style>
      body {
        display: flex;
        justify-content: center;
        align-items: center;
        height: 100vh;
      }
      canvas {
        background-color: #f0f0f0;
      }
    </style>
  </head>
  <body>
    <canvas id="canvas" width="300" height="300"></canvas>
    <script>
      const canvas = document.getElementById('canvas');
      const ctx = canvas.getContext('2d');
      // 获取canvas的中心点 ( centerX , centerY )就是中心点
      const centerX = canvas.width / 2;
      const centerY = canvas.height / 2;
      // 设置半径
      const radius = 120;
      // 圆弧宽度
      const lineWidth = 35;
      // 圆弧起始角度
      const startAngle = (Math.PI * 150) / 180; // 150°
      // 圆弧结束角度
      const endAngle = (Math.PI * (150 + 240)) / 180; // 390°,共240°
      /**
       * 绘制圆弧函数
       * @param {number} centerX 圆心x
       * @param {number} centerY 圆心y
       * @param {number} radius 半径
       * @param {number} startAngle 圆弧起始角度
       * @param {number} endAngle 圆弧结束角度
       * @param {number} lineWidth 圆弧宽度
       * @param {string} color 圆弧颜色(单色)
       */
      const handleDrawArc = (options = { centerX, centerY, radius, startAngle, endAngle, lineWidth, color }) => {
        // 1. 绘制底色圆弧
        ctx.beginPath();
        ctx.lineWidth = options.lineWidth;
        ctx.strokeStyle = options.color; // 你想要的底色
        // 设置圆弧的端点样式
        ctx.lineCap = 'round';
        // 添加圆弧路径,参数分别是
        // 圆心X坐标,圆心Y坐标,半径,起始角度,结束角度,是否逆时针
        // 起始绘制角度以X轴方向开始计算,也就是起始点是3点钟方向,顺时针绘制
        ctx.arc(options.centerX, options.centerY, options.radius, options.startAngle, options.endAngle, false);
        // 绘制圆弧线条
        ctx.stroke();
      };
      // 绘制底色圆弧
      handleDrawArc({
        centerX,
        centerY,
        radius,
        startAngle,
        endAngle,
        lineWidth,
        color: '#C1C1C1', // 你想要的底色
      });
      // 绘制进度圆弧
      // 最大值
      const maxValue = 100;
      // 当前值
      const currentValue = 64;
      // 进度,65/100,就是一个比例,然后乘240,表示占据240度中的多少比例
      const progress = currentValue / maxValue;
      handleDrawArc({
        centerX,
        centerY,
        radius,
        startAngle,
        endAngle: startAngle + (Math.PI * (240 * progress)) / 180,
        lineWidth,
        color: '#23395D', // 你想要的底色
      });
    </script>
  </body>
</html>
效果:
3. 绘制第二层的刻度线
js
<!DOCTYPE html>
<html lang="en">
  <head>
    <meta charset="UTF-8" />
    <meta name="viewport" content="width=device-width, initial-scale=1.0" />
    <title>进度圆弧</title>
    <style>
      body {
        display: flex;
        justify-content: center;
        align-items: center;
        height: 100vh;
      }
      canvas {
        background-color: #f0f0f0;
      }
    </style>
  </head>
  <body>
    <canvas id="canvas" width="300" height="300"></canvas>
    <script>
      const canvas = document.getElementById('canvas');
      const ctx = canvas.getContext('2d');
      // 获取canvas的中心点 ( centerX , centerY )就是中心点
      const centerX = canvas.width / 2;
      const centerY = canvas.height / 2;
      // 设置半径
      const radius = 120;
      // 圆弧宽度
      const lineWidth = 35;
      // 圆弧起始角度
      const startAngle = (Math.PI * 150) / 180; // 150°
      // 圆弧结束角度
      const endAngle = (Math.PI * (150 + 240)) / 180; // 390°,共240°
      /**
       * 绘制圆弧函数
       * @param {number} centerX 圆心x
       * @param {number} centerY 圆心y
       * @param {number} radius 半径
       * @param {number} startAngle 圆弧起始角度
       * @param {number} endAngle 圆弧结束角度
       * @param {number} lineWidth 圆弧宽度
       * @param {string} color 圆弧颜色(单色)
       */
      const handleDrawArc = (options = { centerX, centerY, radius, startAngle, endAngle, lineWidth, color }) => {
        // 1. 绘制底色圆弧
        ctx.beginPath();
        ctx.lineWidth = options.lineWidth;
        ctx.strokeStyle = options.color; // 你想要的底色
        // 设置圆弧的端点样式
        ctx.lineCap = 'round';
        // 添加圆弧路径,参数分别是
        // 圆心X坐标,圆心Y坐标,半径,起始角度,结束角度,是否逆时针
        // 起始绘制角度以X轴方向开始计算,也就是起始点是3点钟方向,顺时针绘制
        ctx.arc(options.centerX, options.centerY, options.radius, options.startAngle, options.endAngle, false);
        // 绘制圆弧线条
        ctx.stroke();
      };
      // 绘制底色圆弧
      handleDrawArc({
        centerX,
        centerY,
        radius,
        startAngle,
        endAngle,
        lineWidth,
        color: '#C1C1C1', // 你想要的底色
      });
      // 绘制进度圆弧
      // 最大值
      const maxValue = 100;
      // 当前值
      const currentValue = 64;
      // 进度,65/100,就是一个比例,然后乘240,表示占据240度中的多少比例
      const progress = currentValue / maxValue;
      handleDrawArc({
        centerX,
        centerY,
        radius,
        startAngle,
        endAngle: startAngle + (Math.PI * (240 * progress)) / 180,
        lineWidth,
        color: '#23395D', // 你想要的底色
      });
      /**
       * 绘制圆形刻度
       * @param {Object} options - 配置选项
       * @param {number} options.radius - 刻度半径 (默认: 150)
       * @param {number} options.interval - 刻度间隔角度 (默认: 10度)
       * @param {number} options.tickWidth - 刻度宽度 (默认: 2)
       * @param {number} options.tickLength - 刻度长度 (默认: 10)
       * @param {string} options.tickColor - 刻度颜色 (默认: '#333')
       * @param {number} options.centerX - 圆心X坐标 (默认: canvas宽度的一半)
       * @param {number} options.centerY - 圆心Y坐标 (默认: canvas高度的一半)
       * @param {boolean} options.showCenter - 是否显示中心点 (默认: false)
       */
      const handleDrawScale = (options = {}) => {
        // 默认配置
        const config = {
          radius: options.radius || 150,
          interval: options.interval || 10,
          tickWidth: options.tickWidth || 2,
          tickLength: options.tickLength || 10,
          tickColor: options.tickColor || '#333',
          centerX: options.centerX || canvas.width / 2,
          centerY: options.centerY || canvas.height / 2,
          showCenter: options.showCenter || false,
        };
        // 设置样式
        ctx.strokeStyle = config.tickColor;
        ctx.fillStyle = config.tickColor;
        ctx.lineWidth = config.tickWidth;

        // 绘制刻度,从零开始绘制360度,同样是以3点钟方向为起始点
        for (let angle = 0; angle < 360; angle += config.interval) {
          // 跳过这部分的角度不进行绘制
          if (angle >= 30 && angle <= 150) continue;
          const radians = ((angle) * Math.PI) / 180; // 从3点钟方向开始,换算成度数
          // 计算刻度起点和终点
          const startX = config.centerX + (config.radius - config.tickLength) * Math.cos(radians);
          const startY = config.centerY + (config.radius - config.tickLength) * Math.sin(radians);
          const endX = config.centerX + config.radius * Math.cos(radians);
          const endY = config.centerY + config.radius * Math.sin(radians);
          // 绘制刻度线
          ctx.beginPath();
          ctx.moveTo(startX, startY);
          ctx.lineTo(endX, endY);
          ctx.stroke();
        }

        // 绘制中心点
        if (options.showCenter) {
          ctx.beginPath();
          ctx.arc(config.centerX, config.centerY, 3, 0, 2 * Math.PI);
          ctx.fill();
        }
      };

      // 示例1: 基本刻度
      handleDrawScale({
        radius: 100,
        interval: 4.5,
        tickLength: 5,
        tickWidth: 0.5,
        tickColor: '#000',
      });
    </script>
  </body>
</html>
效果:
4. 绘制里面的仪表盘面板
js
<!DOCTYPE html>
<html lang="en">
  <head>
    <meta charset="UTF-8" />
    <meta name="viewport" content="width=device-width, initial-scale=1.0" />
    <title>进度圆弧</title>
    <style>
      body {
        display: flex;
        justify-content: center;
        align-items: center;
        height: 100vh;
      }
      canvas {
        background-color: #f0f0f0;
      }
    </style>
  </head>
  <body>
    <canvas id="canvas" width="300" height="300"></canvas>
    <script>
      const canvas = document.getElementById('canvas');
      const ctx = canvas.getContext('2d');
      // 获取canvas的中心点 ( centerX , centerY )就是中心点
      const centerX = canvas.width / 2;
      const centerY = canvas.height / 2;
      // 设置半径
      const radius = 120;
      // 圆弧宽度
      const lineWidth = 35;
      // 圆弧起始角度
      const startAngle = (Math.PI * 150) / 180; // 150°
      // 圆弧结束角度
      const endAngle = (Math.PI * (150 + 240)) / 180; // 390°,共240°
      /**
       * 绘制圆弧函数
       * @param {number} centerX 圆心x
       * @param {number} centerY 圆心y
       * @param {number} radius 半径
       * @param {number} startAngle 圆弧起始角度
       * @param {number} endAngle 圆弧结束角度
       * @param {number} lineWidth 圆弧宽度
       * @param {string} color 圆弧颜色(单色)
       */
      const handleDrawArc = (options = { centerX, centerY, radius, startAngle, endAngle, lineWidth, color }) => {
        // 1. 绘制底色圆弧
        ctx.beginPath();
        ctx.lineWidth = options.lineWidth;
        ctx.strokeStyle = options.color; // 你想要的底色
        // 设置圆弧的端点样式
        ctx.lineCap = 'round';
        // 添加圆弧路径,参数分别是
        // 圆心X坐标,圆心Y坐标,半径,起始角度,结束角度,是否逆时针
        // 起始绘制角度以X轴方向开始计算,也就是起始点是3点钟方向,顺时针绘制
        ctx.arc(options.centerX, options.centerY, options.radius, options.startAngle, options.endAngle, false);
        // 绘制圆弧线条
        ctx.stroke();
      };
      // 绘制底色圆弧
      handleDrawArc({
        centerX,
        centerY,
        radius,
        startAngle,
        endAngle,
        lineWidth,
        color: '#C1C1C1', // 你想要的底色
      });
      // 绘制进度圆弧
      // 最大值
      const maxValue = 100;
      // 当前值
      const currentValue = 64;
      // 进度,65/100,就是一个比例,然后乘240,表示占据240度中的多少比例
      const progress = currentValue / maxValue;
      handleDrawArc({
        centerX,
        centerY,
        radius,
        startAngle,
        endAngle: startAngle + (Math.PI * (240 * progress)) / 180,
        lineWidth,
        color: '#23395D', // 你想要的底色
      });
      /**
       * 绘制圆形刻度
       * @param {Object} options - 配置选项
       * @param {number} options.radius - 刻度半径 (默认: 150)
       * @param {number} options.interval - 刻度间隔角度 (默认: 10度)
       * @param {number} options.tickWidth - 刻度宽度 (默认: 2)
       * @param {number} options.tickLength - 刻度长度 (默认: 10)
       * @param {string} options.tickColor - 刻度颜色 (默认: '#333')
       * @param {number} options.centerX - 圆心X坐标 (默认: canvas宽度的一半)
       * @param {number} options.centerY - 圆心Y坐标 (默认: canvas高度的一半)
       * @param {boolean} options.showCenter - 是否显示中心点 (默认: false)
       */
      const handleDrawScale = (options = {}) => {
        // 默认配置
        const config = {
          radius: options.radius || 150,
          interval: options.interval || 10,
          tickWidth: options.tickWidth || 2,
          tickLength: options.tickLength || 10,
          tickColor: options.tickColor || '#333',
          centerX: options.centerX || canvas.width / 2,
          centerY: options.centerY || canvas.height / 2,
          showCenter: options.showCenter || false,
        };
        // 设置样式
        ctx.strokeStyle = config.tickColor;
        ctx.fillStyle = config.tickColor;
        ctx.lineWidth = config.tickWidth;

        // 绘制刻度,从零开始绘制360度,同样是以3点钟方向为起始点
        for (let angle = 0; angle < 360; angle += config.interval) {
          // 跳过这部分的角度不进行绘制
          if (angle >= 30 && angle <= 150) continue;
          const radians = (angle * Math.PI) / 180; // 从3点钟方向开始,换算成度数
          // 计算刻度起点和终点
          const startX = config.centerX + (config.radius - config.tickLength) * Math.cos(radians);
          const startY = config.centerY + (config.radius - config.tickLength) * Math.sin(radians);
          const endX = config.centerX + config.radius * Math.cos(radians);
          const endY = config.centerY + config.radius * Math.sin(radians);
          // 绘制刻度线
          ctx.beginPath();
          ctx.moveTo(startX, startY);
          ctx.lineTo(endX, endY);
          ctx.stroke();
        }

        // 绘制中心点
        if (options.showCenter) {
          ctx.beginPath();
          ctx.arc(config.centerX, config.centerY, 3, 0, 2 * Math.PI);
          ctx.fill();
        }
      };

      // 示例1: 基本刻度
      handleDrawScale({
        radius: 100,
        interval: 4.5,
        tickLength: 5,
        tickWidth: 0.5,
        tickColor: '#000',
      });

      /**
       * 绘制可配置渐变的圆形
       * @param {CanvasRenderingContext2D} ctx 画布上下文
       * @param {number} centerX 圆心x
       * @param {number} centerY 圆心y
       * @param {number} radius 半径
       * @param {Array<{pos:number, color:string}>} colorStops 渐变阶段数组,pos为0-1,color为颜色
       */
      const drawGradientCircle = (options = {}) => {
        // 创建线性渐变(从上到下)
        const gradient = ctx.createLinearGradient(
          options.centerX,
          options.centerY - options.radius,
          options.centerX,
          options.centerY + options.radius
        );
        options.colorStops.forEach((stop) => {
          gradient.addColorStop(stop.pos, stop.color);
        });
        ctx.save();
        ctx.beginPath();
        ctx.arc(options.centerX, options.centerY, options.radius, 0, Math.PI * 2);
        ctx.closePath();
        ctx.clip();
        ctx.fillStyle = gradient;
        ctx.fillRect(options.centerX - options.radius, options.centerY - options.radius, options.radius * 2, options.radius * 2);
        ctx.restore();
      };

      drawGradientCircle({
        centerX,
        centerY,
        radius: 85,
        colorStops: [
          { pos: 0, color: '#23395D' },
          { pos: 1, color: 'transparent' },
        ],
      });
    </script>
  </body>
</html>
效果:
5. 绘制文案
js
<!DOCTYPE html>
<html lang="en">
  <head>
    <meta charset="UTF-8" />
    <meta name="viewport" content="width=device-width, initial-scale=1.0" />
    <title>进度圆弧</title>
    <style>
      body {
        display: flex;
        justify-content: center;
        align-items: center;
        height: 100vh;
      }
      canvas {
        background-color: #f0f0f0;
      }
    </style>
  </head>
  <body>
    <canvas id="canvas" width="300" height="300"></canvas>
    <script>
      const canvas = document.getElementById('canvas');
      const ctx = canvas.getContext('2d');
      // 获取canvas的中心点 ( centerX , centerY )就是中心点
      const centerX = canvas.width / 2;
      const centerY = canvas.height / 2;
      // 设置半径
      const radius = 120;
      // 圆弧宽度
      const lineWidth = 35;
      // 圆弧起始角度
      const startAngle = (Math.PI * 150) / 180; // 150°
      // 圆弧结束角度
      const endAngle = (Math.PI * (150 + 240)) / 180; // 390°,共240°
      /**
       * 绘制圆弧函数
       * @param {number} centerX 圆心x
       * @param {number} centerY 圆心y
       * @param {number} radius 半径
       * @param {number} startAngle 圆弧起始角度
       * @param {number} endAngle 圆弧结束角度
       * @param {number} lineWidth 圆弧宽度
       * @param {string} color 圆弧颜色(单色)
       */
      const handleDrawArc = (options = { centerX, centerY, radius, startAngle, endAngle, lineWidth, color }) => {
        // 1. 绘制底色圆弧
        ctx.beginPath();
        ctx.lineWidth = options.lineWidth;
        ctx.strokeStyle = options.color; // 你想要的底色
        // 设置圆弧的端点样式
        ctx.lineCap = 'round';
        // 添加圆弧路径,参数分别是
        // 圆心X坐标,圆心Y坐标,半径,起始角度,结束角度,是否逆时针
        // 起始绘制角度以X轴方向开始计算,也就是起始点是3点钟方向,顺时针绘制
        ctx.arc(options.centerX, options.centerY, options.radius, options.startAngle, options.endAngle, false);
        // 绘制圆弧线条
        ctx.stroke();
      };
      // 绘制底色圆弧
      handleDrawArc({
        centerX,
        centerY,
        radius,
        startAngle,
        endAngle,
        lineWidth,
        color: '#C1C1C1', // 你想要的底色
      });
      // 绘制进度圆弧
      // 最大值
      const maxValue = 100;
      // 当前值
      const currentValue = 64;
      // 进度,65/100,就是一个比例,然后乘240,表示占据240度中的多少比例
      const progress = currentValue / maxValue;
      handleDrawArc({
        centerX,
        centerY,
        radius,
        startAngle,
        endAngle: startAngle + (Math.PI * (240 * progress)) / 180,
        lineWidth,
        color: '#23395D', // 你想要的底色
      });
      /**
       * 绘制圆形刻度
       * @param {Object} options - 配置选项
       * @param {number} options.radius - 刻度半径 (默认: 150)
       * @param {number} options.interval - 刻度间隔角度 (默认: 10度)
       * @param {number} options.tickWidth - 刻度宽度 (默认: 2)
       * @param {number} options.tickLength - 刻度长度 (默认: 10)
       * @param {string} options.tickColor - 刻度颜色 (默认: '#333')
       * @param {number} options.centerX - 圆心X坐标 (默认: canvas宽度的一半)
       * @param {number} options.centerY - 圆心Y坐标 (默认: canvas高度的一半)
       * @param {boolean} options.showCenter - 是否显示中心点 (默认: false)
       */
      const handleDrawScale = (options = {}) => {
        // 默认配置
        const config = {
          radius: options.radius || 150,
          interval: options.interval || 10,
          tickWidth: options.tickWidth || 2,
          tickLength: options.tickLength || 10,
          tickColor: options.tickColor || '#333',
          centerX: options.centerX || canvas.width / 2,
          centerY: options.centerY || canvas.height / 2,
          showCenter: options.showCenter || false,
        };
        // 设置样式
        ctx.strokeStyle = config.tickColor;
        ctx.fillStyle = config.tickColor;
        ctx.lineWidth = config.tickWidth;

        // 绘制刻度,从零开始绘制360度,同样是以3点钟方向为起始点
        for (let angle = 0; angle < 360; angle += config.interval) {
          // 跳过这部分的角度不进行绘制
          if (angle >= 30 && angle <= 150) continue;
          const radians = (angle * Math.PI) / 180; // 从3点钟方向开始,换算成度数
          // 计算刻度起点和终点
          const startX = config.centerX + (config.radius - config.tickLength) * Math.cos(radians);
          const startY = config.centerY + (config.radius - config.tickLength) * Math.sin(radians);
          const endX = config.centerX + config.radius * Math.cos(radians);
          const endY = config.centerY + config.radius * Math.sin(radians);
          // 绘制刻度线
          ctx.beginPath();
          ctx.moveTo(startX, startY);
          ctx.lineTo(endX, endY);
          ctx.stroke();
        }

        // 绘制中心点
        if (options.showCenter) {
          ctx.beginPath();
          ctx.arc(config.centerX, config.centerY, 3, 0, 2 * Math.PI);
          ctx.fill();
        }
      };

      // 示例1: 基本刻度
      handleDrawScale({
        radius: 97,
        interval: 4.5,
        tickLength: 5,
        tickWidth: 0.5,
        tickColor: '#000',
      });

      /**
       * 绘制可配置渐变的圆形
       * @param {CanvasRenderingContext2D} ctx 画布上下文
       * @param {number} centerX 圆心x
       * @param {number} centerY 圆心y
       * @param {number} radius 半径
       * @param {Array<{pos:number, color:string}>} colorStops 渐变阶段数组,pos为0-1,color为颜色
       */
      const drawGradientCircle = (options = {}) => {
        // 创建线性渐变(从上到下)
        const gradient = ctx.createLinearGradient(
          options.centerX,
          options.centerY - options.radius,
          options.centerX,
          options.centerY + options.radius
        );
        options.colorStops.forEach((stop) => {
          gradient.addColorStop(stop.pos, stop.color);
        });
        ctx.save();
        ctx.beginPath();
        ctx.arc(options.centerX, options.centerY, options.radius, 0, Math.PI * 2);
        ctx.closePath();
        ctx.clip();
        ctx.fillStyle = gradient;
        ctx.fillRect(options.centerX - options.radius, options.centerY - options.radius, options.radius * 2, options.radius * 2);
        ctx.restore();
      };

      drawGradientCircle({
        centerX,
        centerY,
        radius: 85,
        colorStops: [
          { pos: 0, color: '#23395D' },
          { pos: 1, color: 'transparent' },
        ],
      });

      // 绘制文字
      const handleDrawText = (options = {}) => {
        ctx.font = 'bold 45px PingFang SC';
        ctx.fillStyle = '#000';
        ctx.textAlign = 'center';
        ctx.textBaseline = 'middle';
        ctx.fillText(options.text, options.centerX, options.centerY + 5);
      };

      handleDrawText({
        text: currentValue,
        centerX,
        centerY,
      });
    </script>
  </body>
</html>
效果:

6. 增加动画效果,删除多余的注释
js
<!DOCTYPE html>
<html lang="en">
  <head>
    <meta charset="UTF-8" />
    <meta name="viewport" content="width=device-width, initial-scale=1.0" />
    <title>进度圆弧</title>
    <style>
      body {
        display: flex;
        justify-content: center;
        align-items: center;
        height: 100vh;
      }
      canvas {
        background-color: #f0f0f0;
      }
    </style>
  </head>
  <body>
    <canvas id="canvas" width="300" height="300"></canvas>
    <script>
      const canvas = document.getElementById('canvas');
      const ctx = canvas.getContext('2d');
      const centerX = canvas.width / 2;
      const centerY = canvas.height / 2;
      const radius = 120;
      const lineWidth = 35;
      const startAngle = (Math.PI * 150) / 180; // 150°
      const endAngle = (Math.PI * (150 + 240)) / 180; // 390°,共240°
      const maxValue = 100;
      const currentValue = 64;
      // 动画相关
      let progress = 0; // 进度百分比 0~1
      let displayValue = 0; // 当前显示的数字
      const duration = 1.5 * 1000; // 动画时长,毫秒
      let startTime = null;

      // 绘制圆弧函数
      const handleDrawArc = (options = { centerX, centerY, radius, startAngle, endAngle, lineWidth, color }) => {
        ctx.beginPath();
        ctx.lineWidth = options.lineWidth;
        ctx.strokeStyle = options.color;
        ctx.lineCap = 'round';
        ctx.arc(options.centerX, options.centerY, options.radius, options.startAngle, options.endAngle, false);
        ctx.stroke();
      };

      // 绘制刻度
      const handleDrawScale = (options = {}) => {
        const config = {
          radius: options.radius || 150,
          interval: options.interval || 10,
          tickWidth: options.tickWidth || 2,
          tickLength: options.tickLength || 10,
          tickColor: options.tickColor || '#333',
          centerX: options.centerX || canvas.width / 2,
          centerY: options.centerY || canvas.height / 2,
          showCenter: options.showCenter || false,
        };
        ctx.strokeStyle = config.tickColor;
        ctx.fillStyle = config.tickColor;
        ctx.lineWidth = config.tickWidth;
        for (let angle = 0; angle < 360; angle += config.interval) {
          if (angle >= 30 && angle <= 150) continue;
          const radians = (angle * Math.PI) / 180;
          const startX = config.centerX + (config.radius - config.tickLength) * Math.cos(radians);
          const startY = config.centerY + (config.radius - config.tickLength) * Math.sin(radians);
          const endX = config.centerX + config.radius * Math.cos(radians);
          const endY = config.centerY + config.radius * Math.sin(radians);
          ctx.beginPath();
          ctx.moveTo(startX, startY);
          ctx.lineTo(endX, endY);
          ctx.stroke();
        }
        if (options.showCenter) {
          ctx.beginPath();
          ctx.arc(config.centerX, config.centerY, 3, 0, 2 * Math.PI);
          ctx.fill();
        }
      };

      // 绘制渐变圆
      const drawGradientCircle = (options = {}) => {
        const gradient = ctx.createLinearGradient(
          options.centerX,
          options.centerY - options.radius,
          options.centerX,
          options.centerY + options.radius
        );
        options.colorStops.forEach((stop) => {
          gradient.addColorStop(stop.pos, stop.color);
        });
        ctx.save();
        ctx.beginPath();
        ctx.arc(options.centerX, options.centerY, options.radius, 0, Math.PI * 2);
        ctx.closePath();
        ctx.clip();
        ctx.fillStyle = gradient;
        ctx.fillRect(options.centerX - options.radius, options.centerY - options.radius, options.radius * 2, options.radius * 2);
        ctx.restore();
      };

      // 绘制文字
      const handleDrawText = (options = {}) => {
        ctx.font = 'bold 45px PingFang SC';
        ctx.fillStyle = '#000';
        ctx.textAlign = 'center';
        ctx.textBaseline = 'middle';
        ctx.fillText(options.text, options.centerX, options.centerY + 5);
      };

      // 动画主函数
      function animate(timestamp) {
        console.log('timestamp', timestamp);
        // 如果是动画的第一帧,记录下动画的起始时间
        if (!startTime) startTime = timestamp;
        // 计算动画已经运行的时间
        const elapsed = timestamp - startTime;
        // 进度百分比(0~1)(当前毫秒数/总毫秒数)
        let percent = Math.min(elapsed / duration, 1);
        // 进度百分比(0~1)(当前进度/最大进度)
        progress = percent * (currentValue / maxValue);
        // 当前显示的数字
        displayValue = Math.round(percent * currentValue);

        // 清空画布
        ctx.clearRect(0, 0, canvas.width, canvas.height);
        // 1. 底色圆弧
        handleDrawArc({
          centerX,
          centerY,
          radius,
          startAngle,
          endAngle,
          lineWidth,
          color: '#C1C1C1',
        });
        // 2. 进度圆弧
        handleDrawArc({
          centerX,
          centerY,
          radius,
          startAngle,
          endAngle: startAngle + (Math.PI * (240 * progress)) / 180,
          lineWidth,
          color: '#23395D',
        });
        // 3. 刻度
        handleDrawScale({
          radius: 97,
          interval: 4.5,
          tickLength: 5,
          tickWidth: 0.5,
          tickColor: '#000',
        });
        // 4. 渐变圆
        drawGradientCircle({
          centerX,
          centerY,
          radius: 85,
          colorStops: [
            { pos: 0, color: '#23395D' },
            { pos: 1, color: 'transparent' },
          ],
        });
        // 5. 文字
        handleDrawText({
          text: displayValue,
          centerX,
          centerY,
        });
        // 动画未结束则继续
        if (percent < 1) {
          requestAnimationFrame(animate);
        }
      }

      // 启动动画
      requestAnimationFrame(animate);
    </script>
  </body>
</html>