一、创建文件
py
# 首先导入pandas
import pandas as pd

# 创建DataFrame
df=pd.DataFrame() # 此时创建的是个空文件,无数据
# 调用to_excel并给它一个路径
df.to_excel('C:\\Temp\\output.xlsx')
print('Done!')
# 此时output文件就被创建到文件夹中了
如果想要在创建的同时给文件数据:
py
df=pd.DataFrame({'ID':[1,2,3],'Name':['iop','qwe','wer']})
最前面一列是自动索引,如果想要把ID当作索引:
py
df=pd.DataFrame({'ID':[1,2,3],'Name':['iop','qwe','wer']})
print(df) # 会在运行窗口输出数据表格
py
df=pd.DataFrame({'ID':[1,2,3],'Name':['iop','qwe','wer']})
df=df.set_index('ID') # set_index()会产生一个新的DataFrame,然后再赋给df
print(df) 
py
df=pd.DataFrame({'ID':[1,2,3],'Name':['iop','qwe','wer']})
df=df.set_index('ID')
df.to_excel('C:\\Temp\\output.xlsx')
print('Done!')
成功了!
二、读取文件
2.1 导入文件及打印相关信息
py
import pandas as pd

# 导入文件地址
people=pd.read_excel('C:\\Temp\\people.xlsx')
# 打印输出表格行列数据
print(people.shape) # shape能告诉我们表格有多少行多少列  (行,列)
# 打印输出表格列名称
print(people.columns) # columns能告诉我们表格列的名称
# 打印输出表格的前几行
print(people.head()) # 通常情况下表格数据很多,都打印出来看不全,所以一般只打印表格的head部分
# 打印输出表格的后几行
print(people.tail()) # tail可以看表格的末尾几行
2.1.1 shape 行列数
py
print(people.shape) # shape能告诉我们表格有多少行多少列 (行,列)
2.1.2 columns 列名
py
print(people.columns) # columns能告诉我们表格列的名称 
2.1.3 head 开头几行
py
print(people.head()) # 通常情况下表格数据很多,都打印出来看不全,所以一般只打印表格的head部分
只想看前3行:
py
print(people.head(3)) 
有时列的信息太多,只看前几行的时候也会隐藏一部分:
py
pd.options.display.max_columns=999 # 随便设置一个大的数字,可以让隐藏的信息都显示出来2.1.4 tail 末尾几行
py
print(people.tail()) # tail可以看表格的末尾几行
2.2 常见问题情况
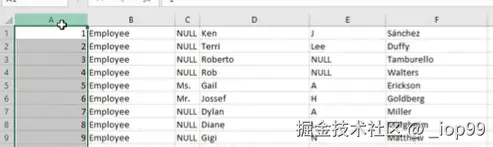
2.2.1 数据第1行是乱码
有时候表格数据第1行是错误的:
此时使用
columns读取出来的列名是错误的,因为列名不再在第1行

解决方法:
py
people=pd.read_excel('C:\\Temp\\people.xlsx',header=1) # header默认为0在读取文件时将header值改为1
2.2.2 数据第1行是空白
有时候表格数据第1行是空的,数据错位:
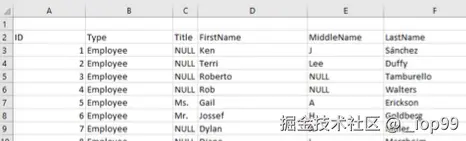
此时就算不重新赋值header都能正确输出
解决方法: 不用管
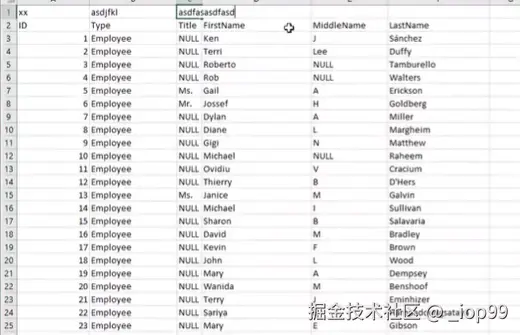
2.2.3 文件就没有header
文件就没有列名,只有一堆数据:
此时使用
columns读取出来的列名是错误的
解决方法:
py
people=pd.read_excel('C:\\Temp\\people.xlsx',header=None) 在读取文件时将header值设为None

人为设置一个header:
py
people=pd.read_excel('C:\\Temp\\people.xlsx',header=None)
people.columns=['ID','Type','FirstName','MiddleName','LastName']
# 将其放入表格
people.to_excel('C:\\Temp\\people.xlsx')

2.2.4 索引又出来了!
- 方法一:
set_index
py
people=people.set_index('ID') - 方法二:
inplace
py
people.set_index('ID',inplace=True) # 直接在DataFrame上面改,不生成新的- 方法三:
inplace
py
people=pd.read_excel('C:\\Temp\\people.xlsx',index_col='ID') # 在读取文件时就修改三、行、列、单元格
3.1 创建序列的三种方法
py
import pandas as pd
d={'x':100,'y':200,'z':300}
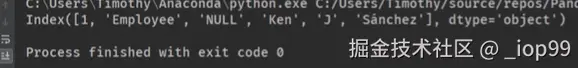
s1=pd.Series(d) # 把字典的key转化为s1的index,把value转化为data
print(s1.index) # Index(['x', 'y', 'z'], dtype='object')
print(s1)
py
import pandas as pd

L1=[100,200,300]
L2=['x','y','z']
s1=pd.Series(L1,index=L2)
print(s1)
py
import pandas as pd

s1=pd.Series([100,200,300],index=['x','y','z'])
print(s1)
3.2 以列的形式加入
py
import pandas as pd

s1=pd.Series([1,2,3],index=[1,2,3],name='A') # 把s1当作一列加入DataFrame,index为行号
s2=pd.Series([10,20,30],index=[1,2,3],name='B')
s3=pd.Series([100,200,300],index=[1,2,3],name='C')

# 如果想要作为列加入,需要使用字典的形式加入
df=pd.DataFrame({s1.name:s1,s2.name:s2,s3.name:s3})
print(df)
3.3 以行的形式加入
py
import pandas as pd

s1=pd.Series([1,2,3],index=[1,2,3],name='A') # 把s1当作一列加入DataFrame,index为行号
s2=pd.Series([10,20,30],index=[1,2,3],name='B')
s3=pd.Series([100,200,300],index=[1,2,3],name='C')

# 如果想要作为行加入,需要使用列表的形式加入
df=pd.DataFrame([s1,s2,s3]) # 把name看作行号,把每个列表看作一行
print(df)
3.4 对齐
对齐的原理是根据index,相同的对齐
当把s3的index改为2,3,4:
py
import pandas as pd

s1=pd.Series([1,2,3],index=[1,2,3],name='A')
s2=pd.Series([10,20,30],index=[1,2,3],name='B')
s3=pd.Series([100,200,300],index=[2,3,4],name='C')

# 对齐的原理是根据index,相同的对齐
df=pd.DataFrame({s1.name:s1,s2.name:s2,s3.name:s3})
print(df)
四、数据区域读取填充数字
已知有一个这样的文件:

此时打印表格,无法自动跳过前面的空行和空列:
py
import pandas as pd

books=pd.read_excel('C:\\Temp\\books.xlsx')
print(books)
- 使用
skiprows跳过空行:skiprows=3 - 使用
usecols指定要看的列:usecols=C,D,E,F或usecols=C:F
py
import pandas as pd

books=pd.read_excel('C:\\Temp\\books.xlsx',skiprows=3,usecols='C:F')
print(books)
- 使用
at给ID列索引为0处赋值为100
py
books['ID'].at[0]=100
- 使用
for循环给ID赋值
py
for i in books.index:
    books['ID'].at[i]=i+1 # 因为索引index是从0开始的
# books.at[i,'ID']=i+1 也可以 
- 使用
dtype将ID数据类型改为str型(默认是float型)
py
books=pd.read_excel('C:\\Temp\\books.xlsx',skiprows=3,usecols='C:F',dtype={'ID':str})
- 使用
for循环给InStore交替赋值Yes和No
py
for i in books.index:
    books['InStore'].at[i]='Yes'if i%2==0 else 'No'
# books.at[i,'InStore']='Yes'if i%2==0 else 'No' 也可以 
完整代码:
py
import pandas as pd

books=pd.read_excel('C:\\Temp\\books.xlsx',skiprows=3,usecols='C:F',dtype={'ID':str})
for i in books.index:
    books['ID'].at[i]=i+1 # 因为索引index是从0开始的
    books['InStore'].at[i]='Yes'if i%2==0 else 'No'

print(books)
五、填充日期序列
- 导入日期模块并在
for循环中赋值
py
from datetime import date,timedelta # 导入日期

start=date(2019,1,1) # 设置初始日期
for i in books.index:
    books['Date'].at[i]=start # 将start赋值给Date
- 使用
timedelta和for循环实现日期变更
py
for i in books.index:
    books['Date'].at[i]=start+timedelta(days=i)
    # 在start日期的基础上加上i天,注意timedelta最多能以天为单位,不能加周、月、年等
加年:
py
for i in books.index:
    books['Date'].at[i]=date(start.year+i,start.month,start.day)
    # 相当于重新赋值
加月:
py
# 定义一个加月函数
def add_month(d,md):
    yd=md//12
    m=d.month+md%12
    if m!=12:
        yd+=m//12
        m=m%12
    return date(d.year+yd,m,d.day)

for i in books.index:
    books['Date'].at[i]=add_month(start,i)
    # books.at[i,'Date']=add_month(start,i) 也可以
完整代码:
py
import pandas as pd
from datetime import date,timedelta # 导入日期

# 定义一个加月函数
def add_month(d,md):
    yd=md//12
    m=d.month+md%12
    if m!=12:
        yd+=m//12
        m=m%12
    return date(d.year+yd,m,d.day)

books=pd.read_excel('C:\\Temp\\books.xlsx',skiprows=3,usecols='C:F',dtype={'ID':str})
start=date(2019,1,1)
for i in books.index:
    books['ID'].at[i]=i+1 # 因为索引index是从0开始的
    books['InStore'].at[i]='Yes'if i%2==0 else 'No'
    books['Date'].at[i]=add_month(start,i)

books.set_index('ID',inplace=True)
books.to_excel('C:\\Temp\\books.xlsx') # 将修改保存至文件
print('Done!')
六、函数填充、计算列
计算:

然后拖动右下角的填充(或者双击填充点),将Price列填满:

用 pandas 操作:
py
import pandas as pd

books=pd.read_excel('C:\Temp\books.xlsx',index_col='ID')
books['Price']=books['ListPrice']*books['Discount']

books.to_excel('C:\Temp\books.xlsx') # 将修改保存至文件
print('Done!')也可以使用for循环
py
for i in books.index:
    books['Price'].at[i]=books['ListPrice'].at[i]*books['Discount'].at[i]
    # 这种方式常常用于不想从头到尾全部运算,而是只运算其中某一段
如:
py
for i in range(5,16):
    books['Price'].at[i]=books['ListPrice'].at[i]*books['Discount'].at[i]
给 Price 统一加2元:
方法一:直接+2
py
books['Price']=books['Price']+2方法二:使用自定义函数
py
def add_2(x):
    return x+2
books['Price']=books['Price'].apply(add_2)方法三:使用lambda匿名函数
py
books['Price']=books['Price'].apply(lambda x:x+2)七、排序、多重排序
按照 Price 和 Worthy 排序:

用 pandas 操作:
- 使用
sort_values进行排序
py
products.sort_values(by='Price',inplace=True) # by根据什么排序(默认是升序),inplace=True就会在当前的进行排序,而不会生成一个新的
py
# 如果想要降序,即从大到小:将ascending设置为False
products.sort_values(by='Price',inplace=True,ascending=False) 
py
products.sort_values(by=['Worthy','Price'],inplace=True,ascending=False) # 对字母是默认A-Z,如果没有ascending=False就会No在前,Yes在后
# 注意不能写多行sort_values,否则后面的会覆盖前面的,应该把多个排序因素写在一起
- 那么如何使价格按照大到小,价值按照Z-A呢?
py
products.sort_values(by=['Worthy','Price'],inplace=True,ascending=[True,False])
# 需要将ascending也分开写
完整代码:
py
import pandas as pd

products=pd.read_excel('C:\Temp\list.xlsx')
products=products.set_index('ID')

products.sort_values(by=['Worthy','Price'],inplace=True,ascending=[True,False])

products.to_excel('C:\Temp\list.xlsx')
print(products)
八、数据筛选、过滤
筛选出年龄在18-30岁,分数在85以上的学生:

用 pandas 操作:
- 先定义筛选函数
py
# 自定义筛选函数
def age_18_to_30(a):
    return 18<=a<=30

def level_A(s):
return 85<=s<=100- 使用
loc进行过滤
py
students=students.loc[students['Age'].apply(age_18_to_30)] # 使用这个函数过滤一遍Age数据
# students=students.loc[students.Age.apply(age_18_to_30)] 也可以
- 继续过滤
py
students=students.loc[students['Age'].apply(age_18_to_30)].loc[students['Score'].apply(level_A)]
# 注意是在后面接着写
完整代码:
py
import pandas as pd

def age_18_to_30(a):
    return 18<=a<=30

def level_A(s):
    return 85<=s<=100

students=pd.read_excel('C:\Temp\student.xlsx')
students=students.set_index('ID')

students=students.loc[students.Age.apply(age_18_to_30)].loc[students.Score.apply(level_A)]

students.to_excel('C:\Temp\student.xlsx')
print(students)
也可以使用lambda,就不用在前面定义筛选函数了:
py
import pandas as pd

students=pd.read_excel('C:\Temp\student.xlsx')
students=students.set_index('ID')

students=students.loc[students.Age.apply(lambda a:18<=a<=30)].loc[students.Score.apply(lambda s:85<=s<=100)]

print(students)
九、柱状图

并且从高到低排序:

9.1 基础柱状图
9.1.1 用 pandas 操作
- 引入
matplotlib
py
import matplotlib # 由于PyCharm内置的Matplotlib后端与我当前使用的Matplotlib版本不兼容,解决方法:切换Matplotlib后端(第1-2行)
matplotlib.use('TkAgg')  # 或 'Qt5Agg'
import matplotlib.pyplot as plt- 使用
plot.bar制作柱状图
py
students.plot.bar(x='Field',y='Number') # x轴为Field,y轴为Number
plt.show() # 显示图像
完整代码:
py
import pandas as pd
import matplotlib # 由于PyCharm内置的Matplotlib后端与我当前使用的Matplotlib版本不兼容,解决方法:切换Matplotlib后端(第2-3行)
matplotlib.use('TkAgg')  # 或 'Qt5Agg'
import matplotlib.pyplot as plt

students=pd.read_excel('C:\Temp\student.xlsx')
students.plot.bar(x='Field',y='Number') # x轴为Field,y轴为Number
plt.show() # 显示图像- 使用
sort_values进行排序,默认为升序,如果要降序就加上ascending=False
py
students.sort_values(by='Number',inplace=True)
- 发现x轴标签怎么都被截断了?
tight_layout()
py
plt.tight_layout() # 紧凑型布局- 设置颜色
color和标题title
py
students.plot.bar(x='Field',y='Number',color='green',title='Students by Field')
完整代码:
py
import pandas as pd
import matplotlib # 由于PyCharm内置的Matplotlib后端与我当前使用的Matplotlib版本不兼容,解决方法:切换Matplotlib后端(第2-3行)
matplotlib.use('TkAgg')  # 或 'Qt5Agg'
import matplotlib.pyplot as plt

students=pd.read_excel('C:\Temp\student.xlsx')
students.sort_values(by='Number',inplace=True)
# students.plot.bar(x='Field',y='Number',color='green',title='Students by Field')
plt.bar(students.Field,students.Number,color='green')

plt.tight_layout() # 紧凑型布局
plt.show() # 显示图像
9.1.2 用 matplotlib 制作
py
plt.bar(students.Field,students.Number,color='green')
- 注意现在的标签是叠在一起的,可以使用
xticks让标签旋转一下
py
plt.xticks(students.Field,rotation=90) # 将标签旋转一下,旋转为90度
- 使用
xlabel和ylabel添加坐标轴标签
py
plt.xlabel('Field')
plt.ylabel('Number')title设置图标标题
py
plt.title('Students bu Field',fontsize=16) # 字号为16完整代码:
py
import pandas as pd
import matplotlib
matplotlib.use('TkAgg')
import matplotlib.pyplot as plt

students=pd.read_excel('C:\Temp\student.xlsx')
students.sort_values(by='Number',inplace=True)
plt.bar(students.Field,students.Number,color='green')
plt.xticks(students.Field,rotation=90)
plt.xlabel('Field')
plt.ylabel('Number')
plt.title('Student by Field',fontsize=16) # 字号16
plt.tight_layout()
plt.show()
9.2 分组柱图

- 用列表打印分组柱图
py
students.plot.bar(x='Field',y=[2021,2022],color=['green','orange'])
- 使用
sort_values进行排序
py
students.sort_values(by=2021,inplace=True,ascending=False) # 根据2021数据从大到小排序
- 设置标题并加粗
plt.title
py
plt.title('Student by Field',fontsize=16,fontweight='bold') # 16号字,加粗
- 将x轴坐标斜45度 调用
plt.gca()函数
py
# 优化轴部分
ax=plt.gca() # 调用函数,拿到当前的轴
ax.set_xticklabels(students['Field'],rotation=45,ha='right') # 重新铺一遍x轴上的文字  rotation角度,ha水平对齐
- 如果觉得图像外的空白太多了或太少了,想要调整 调用
plt.gcf()函数
py
f=plt.gcf() # 函数gcf(),拿到当前的图像
f.subplots_adjust(left=0.2,bottom=0.42) # 左边留出20%宽度,底部留出42%的宽度
完整代码:
py
import pandas as pd
import matplotlib
matplotlib.use('TkAgg')
import matplotlib.pyplot as plt

students=pd.read_excel('C:\Temp\student.xlsx')
students.sort_values(by=2021,inplace=True,ascending=False) # 根据2021数据从大到小排序
students.plot.bar(x='Field',y=[2021,2022],color=['green','orange'])
plt.title('Student by Field',fontsize=16,fontweight='bold') # 16号字,加粗
plt.xlabel('Field',fontweight='bold') # 坐标轴标题加粗
plt.ylabel('Number',fontweight='bold')
# 优化轴部分
ax=plt.gca() # 调用函数,拿到当前的轴
ax.set_xticklabels(students['Field'],rotation=45,ha='right') # 重新铺一遍x轴上的文字  rotation角度,ha水平对齐
f=plt.gcf() # 函数gcf(),拿到当前的图像
f.subplots_adjust(left=0.2,bottom=0.42) # 左边留出20%宽度,底部留出42%的宽度

plt.show() # 显示图像
9.3 叠加水平柱状图

- 首先在分组柱状图的基础上,使用
stacked让它们在同一柱展示(叠加柱状图)
py
users.plot.bar(x='Name',y=['Oct','Nov','Dec'],stacked=True)
- 按照总量排序
py
# 新建一列Total
users['Total']=users['Oct']+users['Nov']+users['Dec']
# 按照Total排序
users.sort_values(by='Total',inplace=True,ascending=False)
- 在打印图片时使用
plot.barh改为横版的
py
users.plot.barh(x='Name',y=['Oct','Nov','Dec'],stacked=True,title='User Behavior')
完整代码:
py
import pandas as pd
import matplotlib
matplotlib.use('TkAgg')
import matplotlib.pyplot as plt

users=pd.read_excel('C:\Temp\users.xlsx')
users['Total']=users['Oct']+users['Nov']+users['Dec'] # 新建一列Total
users.sort_values(by='Total',inplace=True,ascending=False) # 按照Total排序
users.plot.barh(x='Name',y=['Oct','Nov','Dec'],stacked=True,title='User Behavior')
plt.tight_layout()

plt.show()
十、饼图

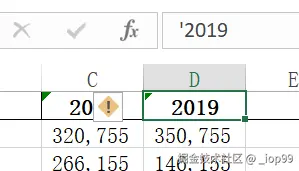
注意:表格中年份的前面加个单引号告诉excel这不是数字而是字符串
- 使用
plot.pie()画饼图
py
students['2018'].plot.pie()
- 修改
index_col值
py
students=pd.read_excel('C:\Temp\students.xlsx',index_col='From')
- 使用
sort_values或counterclock将数据顺时针排列
py
students['2018'].sort_values(ascending=True).plot.pie(fontsize=8) # sort_values的ascending默认就是True,所以ascending=True可写可不写
py
students['2018'].plot.pie(fontsize=8,counterclock=False) # counterclock设置为False,变逆时针为顺时针
- 设置
startangle角度,让饼图起点从上面开始
py
students['2018'].sort_values(ascending=True).plot.pie(fontsize=8,startangle=-270)
完整代码:
py
import pandas as pd
import matplotlib
matplotlib.use('TkAgg')
import matplotlib.pyplot as plt

students=pd.read_excel('C:\Temp\students.xlsx',index_col='From')
students['2018'].plot.pie(fontsize=8,counterclock=False,startangle=-270)
plt.title('Source of International Students',fontsize=16,fontweight='bold') # 设置标题
plt.ylabel('2018',fontsize=14,fontweight='bold') # 重写y轴标题
plt.show()
十一、折线趋势图、叠加区域图
-
折线图:
-
叠加区域图:
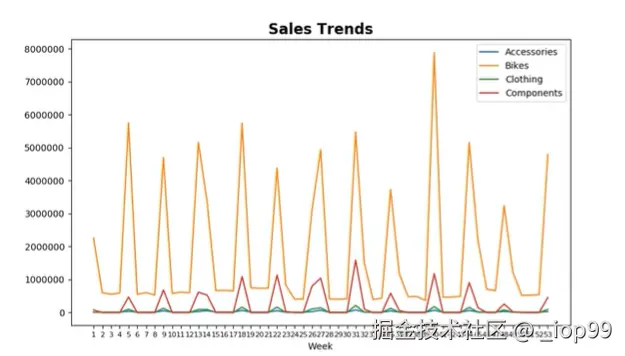
11.1 折线图
plot画折线图
py
weeks.plot(y=['Accessories','Bikes','Clothing','Components']) # 如果只有一个,就是一条折线,如果有多个,就是多条折线
# 也可以给一列color来调整它们的颜色
- 使用
xlabel的.index修改x轴的间隔
py
plt.xlabel(weeks.index)
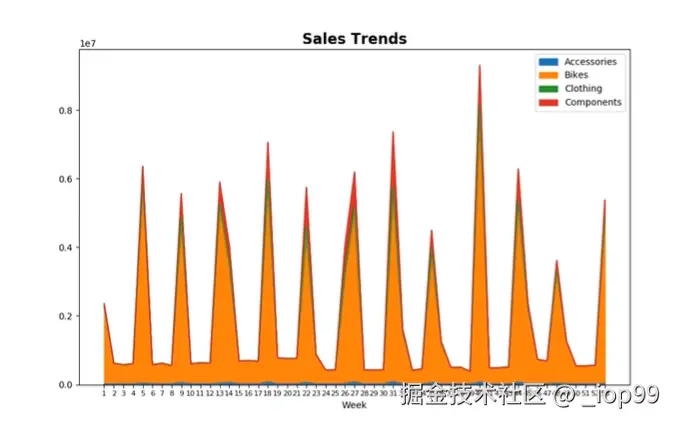
11.2 叠加区域图
- 想要画叠加区域图,只需要加上
.area
py
weeks.plot.area(y=['Accessories','Bikes','Clothing','Components'])
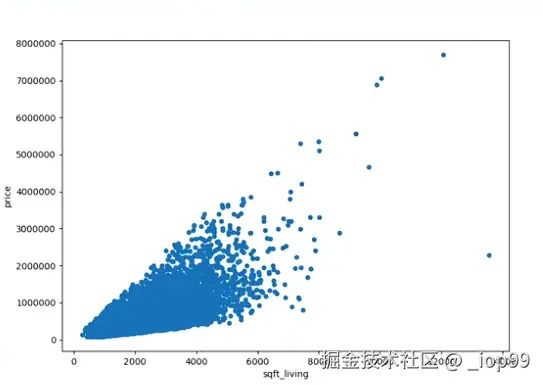
十二、散点图、直方图
- 散点图:
- 直方图:

太多数据excel会承受不起
- 散点图
.plot.scatter
py
homes.plot.scatter(x='sqft_living',y='price')十三、密度图、数据相关性
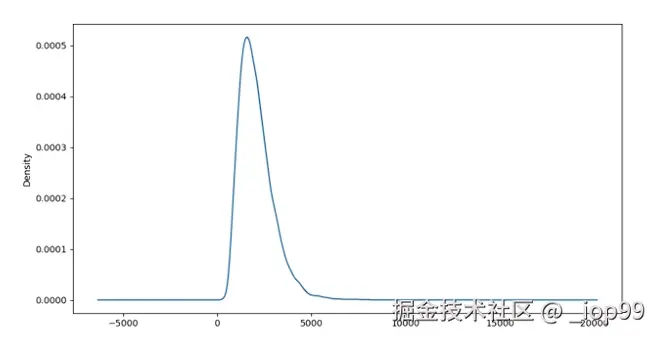
- 密度图: