虽然也在工作使用使用ai 补全代码或者完善代码,但还是没有完全使用ai 做一款应用,不依赖手工编程、不依赖人查找资料
所以决定自己写一个应用玩玩,感受一下全完使用ai开发一款应用的乐趣, 跟上时代发展的步伐
不得不说以前写玩具项目挺枯燥,现在用ai写 还是挺有意思的
应用的需求:
使用ai 分析 k线,并进行点评,让天底下的韭菜没有看不懂的k线,让ai进行cosplay 扮演各路专家进行点评,这不是一款应用这是一款ai驱动的综艺节目
考虑我国复杂的金融监管环境,对股票分析限制非常多,所以对 美股 和港股还有web3 领域的token 进行分析
下面是项目和代码文件
主要是一个图表组件TradingChart.tsx和首页 page.tsx
TradingChart.tsx
'use client'; // 确保只在客户端渲染

import { useEffect, useRef } from 'react';
import {
  createChart,
  CandlestickSeries,
  HistogramSeries,
} from 'lightweight-charts';

export interface KLine {
  time: string; // 'YYYY-MM-DD'
  open: number;
  high: number;
  low: number;
  close: number;
  volume: number;
}

interface Props {
  data: KLine[];
}

export default function TradingChart({ data }: Props) {
  console.log(data);
  const containerRef = useRef<HTMLDivElement>(null);

  useEffect(() => {
    if (!containerRef.current || !data.length) return;

    const chart = createChart(containerRef.current, {
      width: containerRef.current.clientWidth,
      height: containerRef.current.clientHeight,
      layout: { textColor: '#d1d4dc', background: { color: '#111' } },
      grid:   { vertLines: { color: '#2a2e39' }, horzLines: { color: '#2a2e39' } },
      rightPriceScale: { visible: true },
      leftPriceScale:  { visible: true },

      crosshair: { mode: 1 },
      timeScale: {

        fixLeftEdge: false,
        fixRightEdge: false,
        barSpacing: 10,
        minBarSpacing: 5,
      },
    });
   chart.applyOptions({
    localization:{
      dateFormat: 'yyyy-MM-dd',
    }
   })
    /* ---- 蜡烛图 Pane(上方)---- */
    const candlePane = chart.panes()[0];
    const candleSeries = candlePane.addSeries(CandlestickSeries, {
      upColor: '#26a69a',
      downColor: '#ef5350',
      borderVisible: false,
      wickUpColor: '#26a69a',
      wickDownColor: '#ef5350',
      priceScaleId: 'right',
    });
    candleSeries.setData(
      data.map(({ time, open, high, low, close }) => ({ time, open, high, low, close }))
    );

    /* ---- 成交量 Pane(下方 30%)---- */
    const volumePane = chart.addPane();
    volumePane.setHeight(80);
    const volumeSeries = volumePane.addSeries(HistogramSeries, {
      color: '#26a69a',
      priceScaleId: 'right',
      base: 0,
    });

    // 格式化成交量Y轴标签 - 调整为20%高度
    volumePane.priceScale('right').applyOptions({
      //设置高度

      scaleMargins: {
        top: 0.2,
        bottom: 0,
      },
      borderVisible: false,
    });

    // 自定义成交量格式化
    volumeSeries.priceScale().applyOptions({
      invertScale: false,
      borderColor: '#2a2e39',
    });

    // 使用priceFormatter来格式化成交量数值
    volumeSeries.applyOptions({
      priceFormat: {
        type: 'custom',
        minMove: 1,
        formatter: (price: number) => {
          if (price >= 1000000) {
            return (price / 1000000).toFixed(1) + 'M';
          } else if (price >= 1000) {
            return (price / 1000).toFixed(0) + 'K';
          } else {
            return price.toFixed(0);
          }
        }
      }
    });
    volumeSeries.setData(
      data.map(d => ({
        time: d.time,
        value: d.volume,
        color: d.close >= d.open ? '#26a69a' : '#ef5350',
      }))
    );
    chart.timeScale().fitContent();

    /* 自适应窗口大小 */
    const ro = new ResizeObserver(() => chart.applyOptions({
      width: containerRef.current!.clientWidth,
      height: containerRef.current!.clientHeight,

    }));
    ro.observe(containerRef.current);

    return () => {
      ro.disconnect();
      chart.remove();
    };
  }, [data]);

  return <div ref={containerRef} style={{ width: '100%', height: '100%' }} />;
}
page.tsx
// app/page.tsx 或 pages/index.tsx
"use client"
import dynamic from 'next/dynamic';
import { KLine } from '@/components/TradingChart';
import TradingChart from '@/components/TradingChart';
import { useState, useEffect } from 'react';


interface Coin {
  id: string;
  symbol: string;
  name: string;
}

export default function HomePage() {
  const [kLineData, setKLineData] = useState<KLine[]>([]);
  const [coins, setCoins] = useState<Coin[]>([]);
  const [selectedCoin, setSelectedCoin] = useState<string>('bitcoin');

  useEffect(() => {
    const fetchCoins = async () => {
      try {
        const response = await fetch('https://api.coingecko.com/api/v3/coins/markets?vs_currency=usd&order=market_cap_desc&per_page=100&page=1&sparkline=false');
        const data = await response.json();
        setCoins(data);
      } catch (error) {
        console.error('获取币种列表失败:', error);
      }
    };

    fetchCoins();
  }, []);

  useEffect(() => {
    const fetchData = async () => {
      if (!selectedCoin) return;

      try {
        // 180 天 和30天数据
        // 并行获取OHLC和成交量数据
        const [ohlcRes, volumeRes] = await Promise.all([
          fetch(`https://api.coingecko.com/api/v3/coins/${selectedCoin}/ohlc?vs_currency=usd&days=180`),
          fetch(`https://api.coingecko.com/api/v3/coins/${selectedCoin}/market_chart?vs_currency=usd&days=180&interval=daily`,{cache:'force-cache'})
        ]);
        const ohlcData = await ohlcRes.json();
        const volumeData = await volumeRes.json();

        // 合并数据并转换格式
        const formattedData = ohlcData.map(([timestamp, open, high, low, close]: [number, number, number, number, number]) => {
          // 匹配对应时间戳的成交量
          const volumeEntry = volumeData.total_volumes?.find(([volTimestamp]: [number, number]) => volTimestamp === timestamp);
          const volume = volumeEntry ? volumeEntry[1] : 0;

          // 转换时间戳为YYYY-MM-DD格式
          const date = new Date(timestamp);
          // const time = `${date.getFullYear()}-${String(date.getMonth() + 1).padStart(2, '0')}-${String(date.getDate()).padStart(2, '0')}`;

          return { time:timestamp/1000, open, high, low, close, volume };
        });

        setKLineData(formattedData);
      } catch (error) {
        console.error('数据获取失败:', error);
      }
    };

    fetchData();
  }, [selectedCoin]);

  return (
    <div >
        <div className='w-[70%]' style={{ height: '600px' }}>
        <div className=' flex  align-center'>
           <select
          value={selectedCoin}
          onChange={(e) => setSelectedCoin(e.target.value)}
          className="px-4 py-2 border border-gray-300 rounded-lg bg-white text-gray-700 shadow-sm focus:outline-none focus:ring-2 focus:ring-blue-500 focus:border-blue-500 hover:border-gray-400 transition-colors duration-200"
        >
          {coins.map((coin) => (
            <option key={coin.id} value={coin.id} className="py-1">
              {coin.name} ({coin.symbol.toUpperCase()})
            </option>
          ))}
        </select>
        {/* 显示 下拉列表中选中的币种的current_price */}
        <div className='flex items-center'>
          {coins.find((coin) => coin.id === selectedCoin)?.current_price} usdt
        </div>


        </div>


        <TradingChart data={kLineData} />
      </div>
      <div className='w-[30%]'>
       对话框组件
      </div>

    </div>

    );
  }
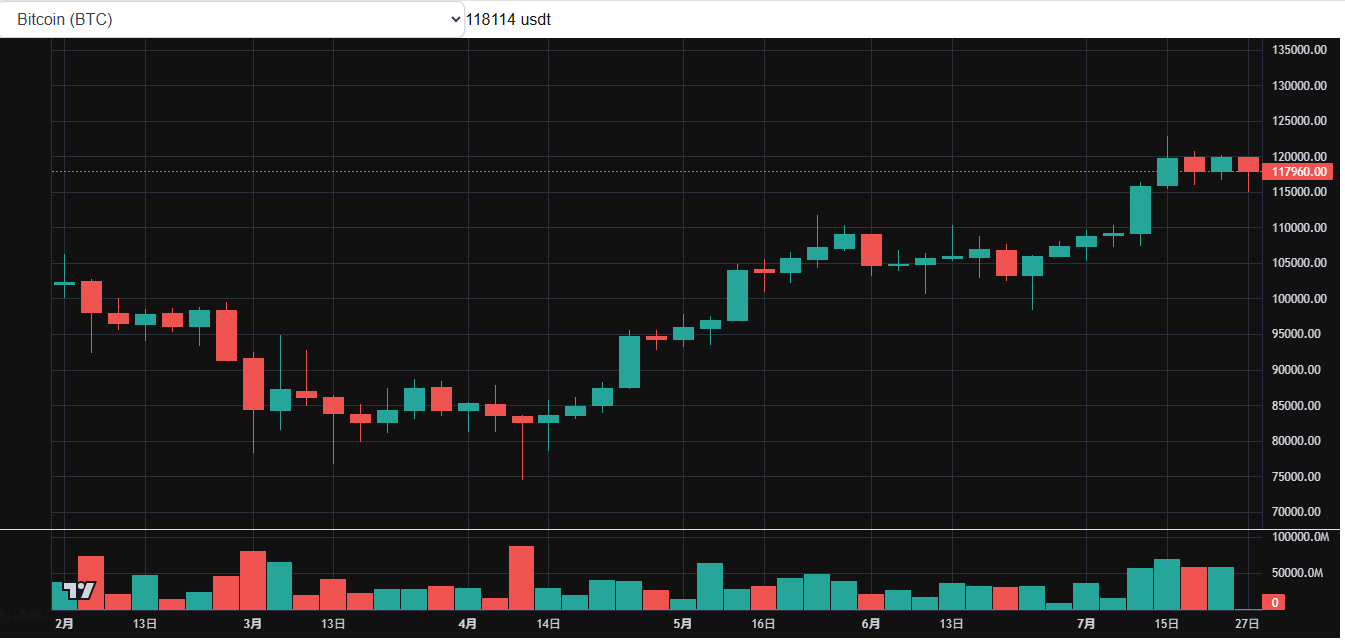
下面是上周工作的成果 绘制了k线和显示了下拉列表还有价格
下面说一下我开发的步骤
1 首选是使用ai 进行需求分析
使用豆包进行的需求分析
https://www.doubao.com/thread/w0e5291f6269dbb19
2 使用ai 分析用什么工具才能绘制交易专用的图表
https://www.doubao.com/thread/wf2ef2d222fdba7eb
3 使用ai 寻找提供的数据源
使用kimi 寻找数据源
https://www.kimi.com/share/d23na3djqedfoaoeplr0
4 使用ai 开发图表组件
怎么使用ai 开发专业的交易图表组件?现在多数ai 都支持html 在线预览 例如 豆包和kimi
例如我需要绘制k线和成交量在一起的一个图表
先使用ai 制作一个html页面,进行在线预览,如果对效果不满意就完善提示词
我分别使用 豆包 deepseek kimi 若干次 最后在kimi 成功制作了交易组件的html页面
使用kimi制作html 页面
https://www.kimi.com/share/d23na3djqedfoaoeplr0
在制作完成html 页面之后,在用ai将html的内容用react 或者vue 重写一遍
然后就是复制到ide 中 进行进一步的完善