前言
之前我写了一篇 《如何实现echarts地图下钻》的文章,用的是echarts5是实现, 但是echarts5中地图切换的过渡动画已经没了,翻阅github issues的记录,发现到现在还没有修复,那么就需要自己编写代码实现,这篇文章就介绍我是怎么处理的。
上一篇文章:🗾3分钟学会Echart地图下钻
方法1 、通过设置zoom实现过渡
核心代码
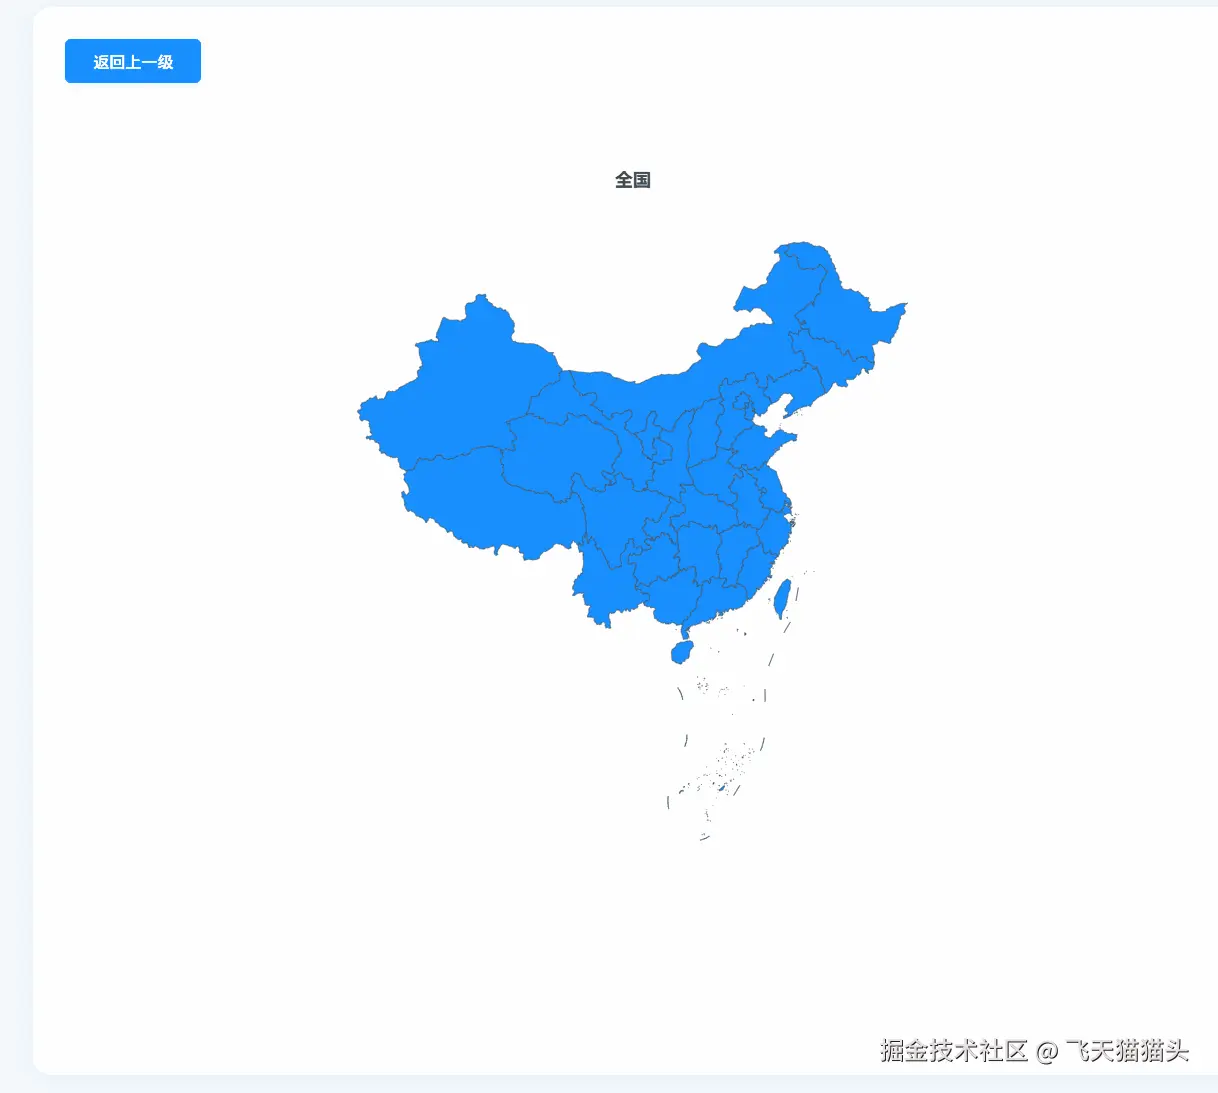
效果如下:
核心代码如下:
js
// 下钻动画
const runAnimation = () => {
    // 地图放大然后消失
    option['animation'] = true
    option['series'][0]['itemStyle']['opacity'] = 0
    chart.setOption(option)
    setTimeout(() => {
      option['animation'] = false
      option['series'][0]['zoom'] = 0.1
      option['series'][0]['itemStyle']['opacity'] = 1
      chart.setOption(option)
    }, 300)
    setTimeout(() => {
      option['animation'] = true
      option['series'][0]['zoom'] = 1
      chart.setOption(option)
    }, 600)
} 原理就是通过,设置zoom属性,和间接关闭animation属性实现的,如果你还要设置平移效果或者别的也可以通过设置中心点或者别的属性进行实现.echarts5的实现方式都差不多.
完整代码
完整使用代码如下:
html
<!DOCTYPE html>
<html lang="zh-CN">
  <head>
    <meta charset="UTF-8" />
    <meta name="viewport" content="width=device-width, initial-scale=1.0" />
    <title>地图下钻</title>
    <style>
      :root {
        --primary: #1890ff;
        --primary-hover: #40a9ff;
        --bg: #f4f8fb;
        --radius: 18px;
        --shadow: 0 4px 24px 0 rgba(24, 144, 255, 0.08);
      }
      body {
        margin: 0;
        padding: 0;
        font-family: Arial, sans-serif;
        background: var(--bg);
        min-height: 100vh;
        display: flex;
        flex-direction: column;
        align-items: center;
        justify-content: center;
      }
      .center-box {
        display: flex;
        flex-direction: column;
        align-items: center;
        justify-content: center;
        width: 100vw;
        height: 100vh;
      }
      .map-container {
        width: 80vw;
        max-width: 1200px;
        height: 80vh;
        min-height: 400px;
        background: #fff;
        border-radius: var(--radius);
        box-shadow: var(--shadow);
        position: relative;
        overflow: hidden;
        display: flex;
        align-items: center;
        justify-content: center;
        transition: box-shadow 0.3s;
      }
      #main {
        width: 100%;
        height: 70%;
        border-radius: var(--radius);
      }
      .btns {
        position: absolute;
        top: 32px;
        left: 32px;
        display: flex;
        gap: 24px;
      }
      .btn {
        padding: 10px 28px;
        background-color: var(--primary);
        color: #fff;
        border: none;
        border-radius: 6px;
        cursor: pointer;
        font-size: 16px;
        font-weight: 500;
        box-shadow: 0 2px 8px 0 rgba(24, 144, 255, 0.12);
        transition: background 0.2s, transform 0.2s, box-shadow 0.2s;
        z-index: 10;
      }

      .btn:hover {
        background-color: var(--primary-hover);
        transform: translateY(-2px) scale(1.04);
        box-shadow: 0 4px 16px 0 rgba(24, 144, 255, 0.18);
      }
      @media (max-width: 900px) {
        .map-container {
          width: 98vw;
          height: 70vh;
        }
        .btn {
          top: 16px;
          left: 16px;
          padding: 8px 18px;
          font-size: 14px;
        }
      }
      @media (max-width: 600px) {
        .map-container {
          width: 100vw;
          height: 60vh;
          min-height: 220px;
        }
        .btn {
          top: 8px;
          left: 8px;
          padding: 6px 10px;
          font-size: 13px;
        }
      }
    </style>
    <script src="./axios.js"></script>
    <script
      src="https://cdnjs.cloudflare.com/ajax/libs/echarts/5.6.0/echarts.min.js"
      integrity="sha512-XSmbX3mhrD2ix5fXPTRQb2FwK22sRMVQTpBP2ac8hX7Dh/605hA2QDegVWiAvZPiXIxOV0CbkmUjGionDpbCmw=="
      crossorigin="anonymous"
      referrerpolicy="no-referrer"
    ></script>
  </head>
  <body>
    <div class="center-box">
      <div class="map-container">
        <div id="main"></div>
        <div class="btns">
          <input
            type="button"
            class="btn"
            onClick="reutrnUp()"
            value="返回上一级"
          />
        </div>
      </div>
    </div>
    <script>
      // 获取echartsDOM元素
      const echartDOM = document.getElementById('main')
      const chart = echarts.init(echartDOM)
      let menus = [
        {
          adcode: 100000,
          name: '全国'
        }
      ]
      /**
       *  @function 获取地区数据
       *  @param {number} adcode - 地区编码,默认为100000(全国)
       * */
      const getGeoJson = async (adcode = 100000) => {
        try {
          const url = `https://geo.datav.aliyun.com/areas_v2/bound/${adcode}_full.json`
          const result = await axios.get(url)
          return result.data
        } catch (err) {
          return void 0
        }
      }
      let option = null

      const updateEcharts = async (adcode, name) => {
        // 默认获取全国行政区数据
        const geoJson = await getGeoJson(adcode)
        if (!geoJson) {
          throw new Error('已经是最后一级了')
        }
        // 注册地图
        echarts.registerMap(name, geoJson)
        // 设置地图配置项
        option = {
          title: {
            text: name,
            left: 'center'
          },
          series: [
            {
              type: 'map',
              map: name,
              itemStyle: {
                areaColor: '#1890ff'
              },
              data: geoJson['features'].map((item) => {
                return {
                  name: item.properties.name,
                  value: item.properties.adcode
                }
              })
            }
          ]
        }
      }
      // 下钻动画
      const runAnimation = () => {
        // 地图放大然后消失
        option['animation'] = true
        option['series'][0]['itemStyle']['opacity'] = 0
        chart.setOption(option)
        setTimeout(() => {
          option['animation'] = false
          option['series'][0]['zoom'] = 0.1
          option['series'][0]['itemStyle']['opacity'] = 1
          chart.setOption(option)
        }, 300)
        setTimeout(() => {
          option['animation'] = true
          option['series'][0]['zoom'] = 1
          chart.setOption(option)
        }, 600)
      }

      // 返回上一级
      const reutrnUp = async () => {
        if (menus.length > 1) {
          menus.pop()
          const { adcode, name } = menus[menus.length - 1]
          await updateEcharts(adcode, name)
          runAnimation()
        } else {
          menus = [
            {
              adcode: 100000,
              name: '全国'
            }
          ]
          await updateEcharts(100000, '全国')
          runAnimation()
          alert('已经是最开始一级了。')
        }
      }
      ;(async () => {
        await updateEcharts(100000, '全国')
        // 设置图表配置项
        chart.setOption(option)
        // 点击行政区的时候,重新加载这个行政区的数据
        chart.on('click', async (params) => {
          const { value, name } = params.data
          if (value) {
            try {
              await updateEcharts(value, name)
              runAnimation()
              menus.push({
                adcode: value,
                name
              })
            } catch (err) {
              alert(err.message)
            }
          }
        })
      })()
    </script>
  </body>
</html>
方法2、换回旧版本
如果你觉得像上面这样实现很麻烦,想要直接就有,那么最好的办法就是换回v4版本的echarts,因为老版本的echarts地图切换的时候自带,切换动画.
比如下面我换成了4.3.0版本的echarts

效果如下:

可以看到这种老版本的动画效果,比前面我自己做的效果会好很多
如果你想要echarts5也用这种效果也是可以实现的,参考方法1,然后改造一下过渡代码逻辑就可以.就是会比较麻烦