正文
D3.js (Data-Driven Documents) 是一个强大被数据驱动的js库,用于基于数据创建动态、交互式的可视化。
D3 可以接受几乎任何数字数组,字符串,或对象(本身包含其他数组或键 / 值对),可以处理 JSON 和 GeoJSON。比如说:
js
[
  { source: 'Microsoft', target: 'Amazon', type: 'licensing' },
  { source: 'Microsoft', target: 'HTC', type: 'licensing' },
  { source: 'Samsung', target: 'Apple', type: 'suit' },
  { source: 'Motorola', target: 'Apple', type: 'suit' },
  { source: 'Nokia', target: 'Apple', type: 'resolved' },
  { source: 'HTC', target: 'Apple', type: 'suit' },
  { source: 'Kodak', target: 'Apple', type: 'suit' },
  { source: 'Microsoft', target: 'Barnes & Noble', type: 'suit' },
  { source: 'Microsoft', target: 'Foxconn', type: 'suit' },
  ...
]
一、D3.js基础入门
1. D3.js概述与安装
D3.j通过绑定数据到DOM元素,然后根据这些数据驱动文档的变换,实现数据可视化。它结合了强大的可视化组件和数据驱动的DOM操作方法。
安装方法:
html
<!-- 直接引入CDN -->
<script src="https://d3js.org/d3.v7.min.js"></script>

<!-- 或者使用npm安装 -->
npm install d3
2. 元素操作基础
D3使用类似jQuery的选择器语法来操作DOM元素:
javascript
// 选择所有p元素并设置样式
d3.selectAll("p")
  .style("color", "blue")
  .attr("class", "highlight")
  .text("Hello D3!");

// 添加新元素
d3.select("body")
  .append("div")
  .attr("id", "new-div")
  .html("<p>This is a new div</p>");
二、数据绑定与更新
1. 数据绑定基础
D3的核心是数据绑定机制,它通过.data()方法将数据数组与DOM元素绑定:
javascript
const dataset = [10, 20, 30, 40, 50];

// 绑定数据并创建新元素
d3.select("body").selectAll("div")
  .data(dataset)
  .enter()
  .append("div")
  .text(d => d)
  .style("height", d => d + "px");
2. 数据更新模式
D3提供了enter、update和exit三种状态处理数据变化:
javascript
// 更新数据
const newData = [15, 25, 35];

// 选择现有元素
const bars = d3.select("body").selectAll("div").data(newData);

// 处理新增元素
bars.enter()
  .append("div")
  .text(d => d);

// 处理更新元素
bars.text(d => d);

// 处理删除元素
bars.exit().remove();
三、比例尺与坐标轴
1. 线性比例尺应用
比例尺将数据值映射到可视化空间:
javascript
const dataset = [10, 25, 50, 100, 150, 200, 250];

// 创建线性比例尺
const xScale = d3.scaleLinear()
  .domain([0, d3.max(dataset)])  // 数据范围
  .range([0, 500]);              // 输出范围

// 使用比例尺
d3.selectAll("div")
  .style("width", d => xScale(d) + "px");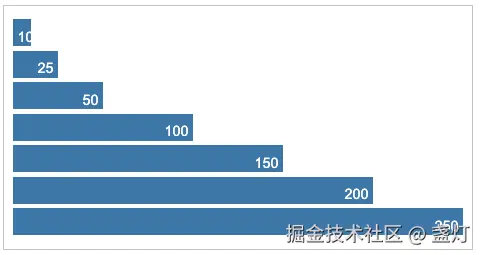
2. 坐标轴绘制
D3提供了方便的坐标轴生成器:
javascript
// 创建坐标轴
const xAxis = d3.axisBottom(xScale)
  .ticks(5)
  .tickFormat(d => "¥" + d);

// 添加坐标轴到SVG
d3.select("svg")
  .append("g")
  .attr("transform", "translate(0, 300)")
  .call(xAxis);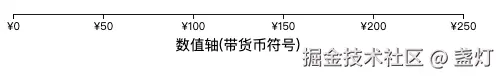
四、图形生成器
1. 饼图实现
javascript
const pie = d3.pie()
  .value(d => d.value);

const arc = d3.arc()
  .innerRadius(0)
  .outerRadius(100);

const arcs = pie([
  {value: 35, name: "A"},
  {value: 25, name: "B"},
  {value: 40, name: "C"}
]);

d3.select("svg").selectAll("path")
  .data(arcs)
  .enter()
  .append("path")
  .attr("d", arc)
  .attr("fill", (d, i) => d3.schemeCategory10[i]);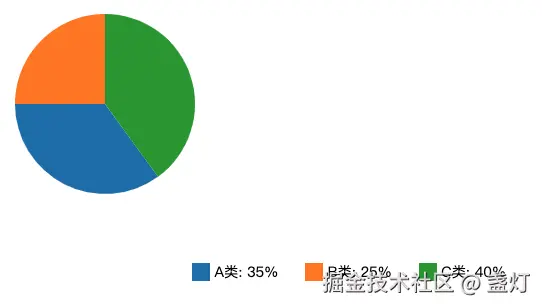
2. 折线图实现
html
<div class="chart-container">
    <svg width="100%" height="100%"></svg>
</div>
javascript
const line = d3.line()
  .x(d => xScale(d.date))
  .y(d => yScale(d.value))
  .curve(d3.curveBasis);

d3.select("svg")
  .append("path")
  .datum(data)
  .attr("d", line)
  .attr("fill", "none")
  .attr("stroke", "steelblue")
  .attr("stroke-width", 2);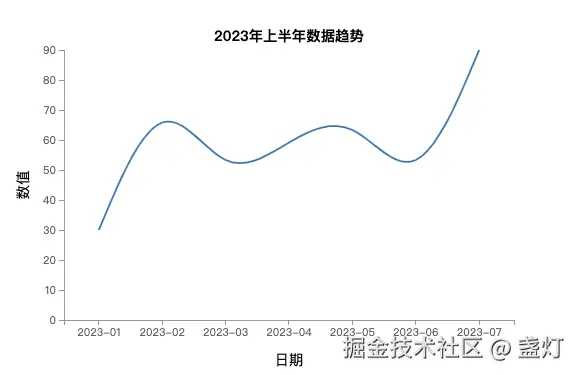
五、交互与动画
1. 过渡动画
javascript
d3.selectAll("circle")
  .transition()
  .duration(1000)
  .attr("r", d => d * 2)
  .attr("fill", "red")
  .transition()
  .duration(500)
  .attr("fill", "blue");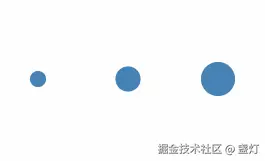
2. 拖拽交互
javascript
const drag = d3.drag()
  .on("drag", function(event) {
    d3.select(this)
      .attr("cx", event.x)
      .attr("cy", event.y);
  });
d3.select("circle").call(drag);
中国地图实现
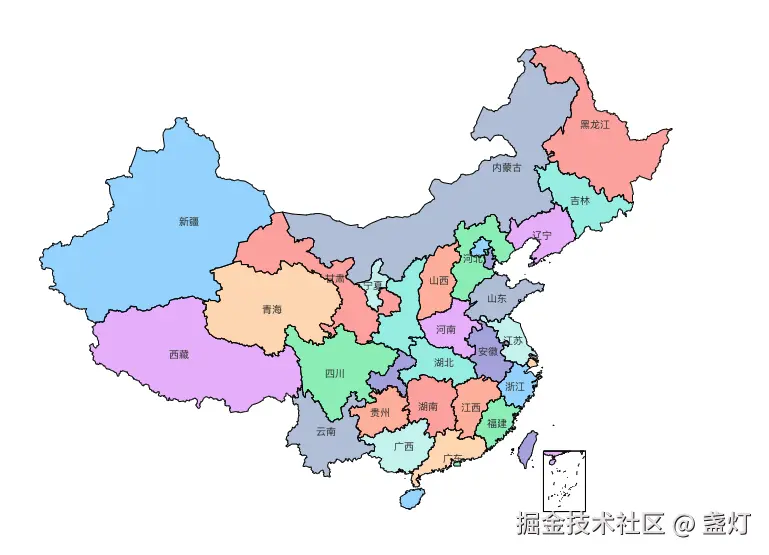
javascript
// 创建投影
const projection = d3.geoMercator()
  .center([105, 38])
  .scale(800)
  .translate([width/2, height/2]);

// 创建路径生成器
const path = d3.geoPath()
  .projection(projection);

// 加载GeoJSON数据并绘制
d3.json("https://geojson.cn/api/china/1.6.2/china.topo.json").then(function(data) {
  svg.selectAll("path")
    .data(data.features)
    .enter()
    .append("path")
    .attr("d", path)
    .attr("fill", "#69b3a2")
    .attr("stroke", "#fff");
});
总结
借助SVG, Canvas 以及 HTML一些dom去把json一些数据根据一些图形展示出来。
官网有现成的例子,可以直接拿来用。借助SVG, Canvas 以及 HTML一些dom去把json一些数据根据一些图形展示出来。
一开始有时候有人看到这种很多很奇特的图形效果,很容易被吓住,觉得自己一定搞不赢。其实很多时候是数据的变动和不同,再结合人家已经写好的封装好的东西,再具体情况具体分析去一步步做出来的。