一.html dom运用
查找html元素的三种方式
- 通过 id 找到 HTML 元素
- 通过标签名找到 HTML 元素
- 通过类名找到 HTML 元素
1.通过 id 找到 HTML 元素
<!DOCTYPE html>
<html>
<head>
<meta charset="utf-8">
<title>msf的网页</title>
</head>
<body>

<p id="msf">你干什么呢?</p>
<p id="hello">你好世界!</p>

<script>
    y=document.getElementById("msf")
    document.write(y.innerHTML)
</script>

<script>
    x=document.getElementById("hello");
    document.write(x.innerHTML + "</p>"); //p段落
</script>

</body>
</html>
2.通过标签名找html元素
<!DOCTYPE html>
<html>
<head>
<meta charset="utf-8">
<title>msf的网页</title>
</head>
<body>
        <div id="main">
            <p> msf</p>
            <p>mzy</p>
        </div>
    <script>
        var x=document.getElementById("main");
        var y=x.getElementsByTagName("p");
        document.write('id="main"元素中的第一个段落为:' + y[0].innerHTML);
    </script>
</body>
</html>
3.通过类名找html元素
<!DOCTYPE html>
<html>
<head>
<meta charset="utf-8">
<title>msf的网页</title>
</head>
<body>
<p class="hello">你好世界!</p>
    <script>
        x=document.getElementsByClassName("hello");
        document.write("<p>文本来自 class 为 hello段落: " + x[0].innerHTML + "</p>");
    </script>
</body>
</html>
二、echars
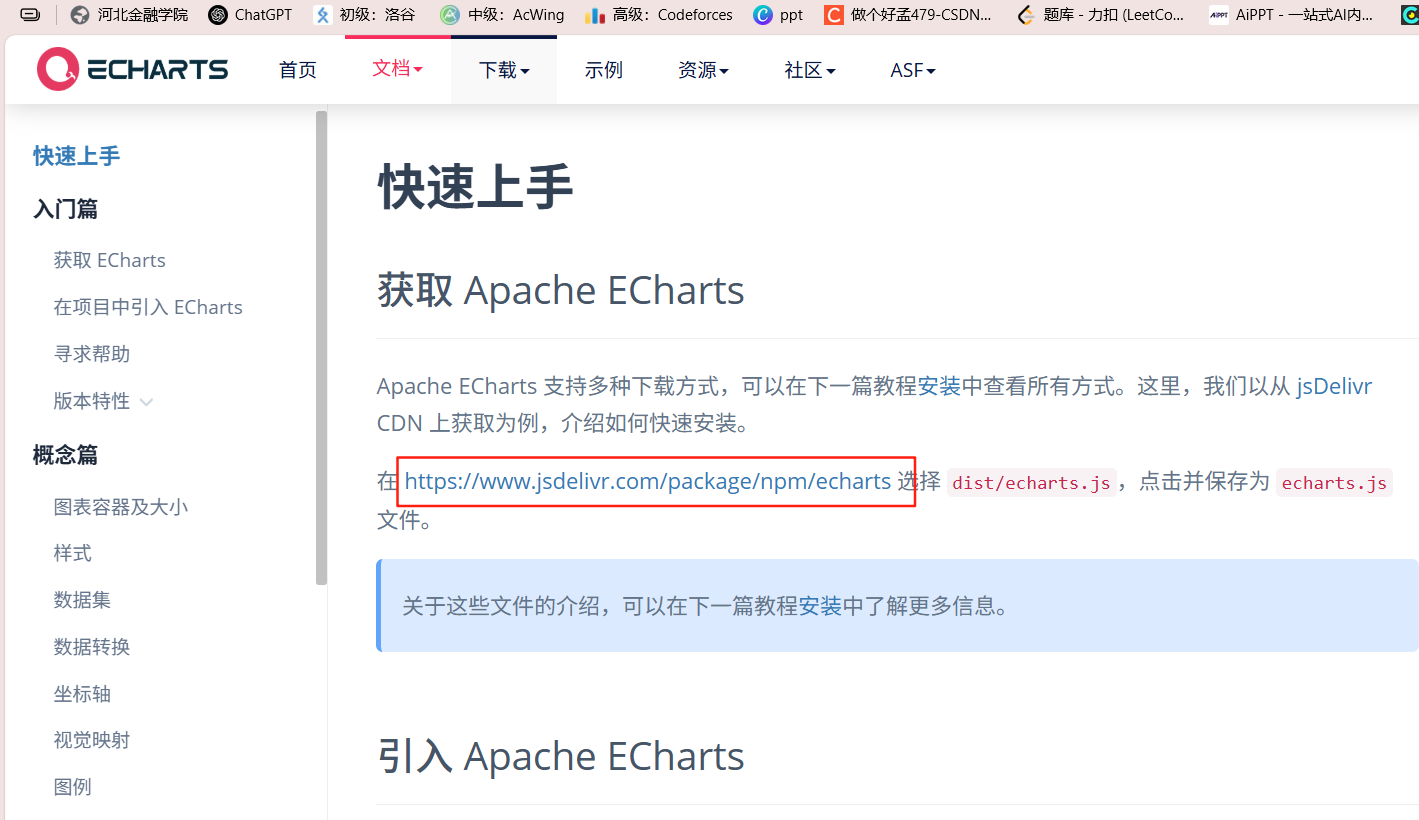
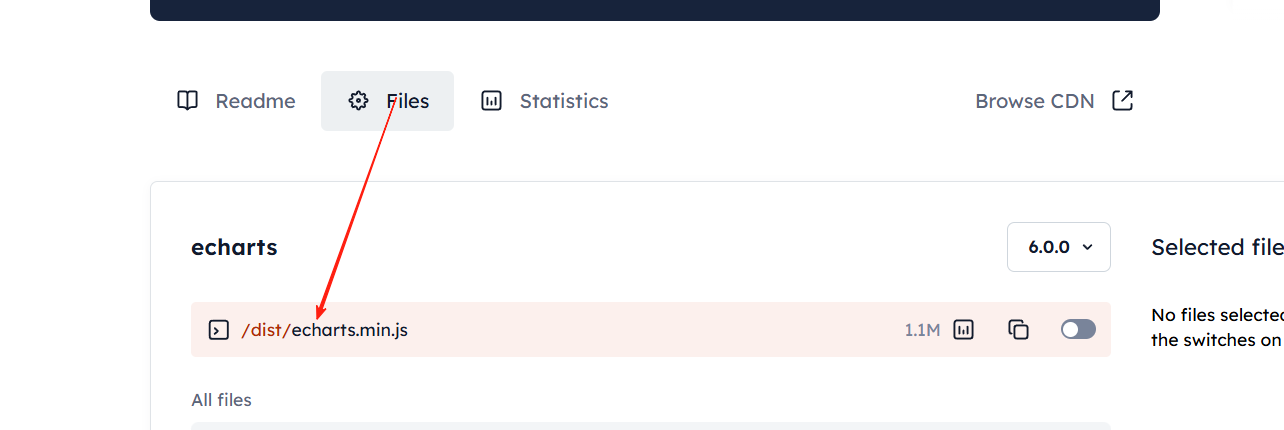
另存为后,用vscode打开,粘贴人家给的模板代码
当js放到body里面,直接粘贴就行
<!DOCTYPE html>
<html lang="en">
<head>
    <meta charset="UTF-8">
    <meta name="viewport" content="width=device-width, initial-scale=1.0">
    <title>Document</title>
    <!-- 引入资源 -->
    <script src="echarts.min.js"></script>
</head>
<body>
      <body>
    <!-- 为 ECharts 准备一个定义了宽高的 DOM -->
    <div id="main" style="width: 600px;height:400px;"></div>
    <!-- 这个js是放到了body里面 -->
    <script type="text/javascript">
      // 基于准备好的dom,初始化echarts实例
      var myChart = echarts.init(document.getElementById('main'));

      // 指定图表的配置项和数据
      var option = {
        title: {
          text: 'ECharts 入门示例'
        },
        tooltip: {},
        legend: {
          data: ['销量']
        },
        xAxis: {
          data: ['衬衫', '羊毛衫', '雪纺衫', '裤子', '高跟鞋', '袜子']
        },
        yAxis: {},
        series: [
          {
            name: '销量',
            type: 'bar',
            data: [5, 20, 36, 10, 10, 20]
          }
        ]
      };

      // 使用刚指定的配置项和数据显示图表。
      myChart.setOption(option);
    </script>
  </body>
</html>
</body>
</html>
当js想放在上面,不放在body里面了,需要绑定window.onload事件,表示这个文件执行之后再触发
<!DOCTYPE html>
<html lang="en">
<head>
    <meta charset="UTF-8">
    <meta name="viewport" content="width=device-width, initial-scale=1.0">
    <title>Document</title>
    <!-- 引入资源 -->
    <script src="echarts.min.js"></script>
        <script type="text/javascript">
        window.onload=function(){
      // 基于准备好的dom,初始化echarts实例
      var myChart = echarts.init(document.getElementById('main'));

      // 指定图表的配置项和数据
      var option = {
        title: {
          text: 'ECharts 入门示例'
        },
        tooltip: {},
        legend: {
          data: ['销量']
        },
        xAxis: {
          data: ['衬衫', '羊毛衫', '雪纺衫', '裤子', '高跟鞋', '袜子']
        },
        yAxis: {},
        series: [
          {
            name: '销量',
            type: 'bar',
            data: [5, 20, 36, 10, 10, 20]
          }
        ]
      };
      // 使用刚指定的配置项和数据显示图表。
      myChart.setOption(option);
    }
    </script>

</head>
<body>
      <body>
    <!-- 为 ECharts 准备一个定义了宽高的 DOM -->
    <div id="main" style="width: 600px;height:400px;"></div>

  </body>
</html>
</body>
</html>
知识点:width可以设置百分数,是针对于父级元素来说的,但是height是不能设置百分数的,因为高度可变,但可以设置vh,代表占整个视口的百分比
eg:width:40%
eg:height:35vh
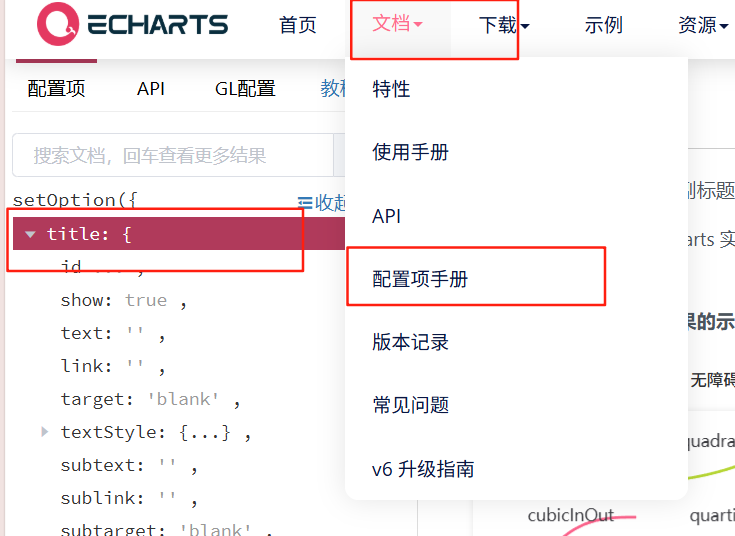
想要什么效果可以自己查
<!DOCTYPE html>
<html lang="en">
<head>
    <meta charset="UTF-8">
    <meta name="viewport" content="width=device-width, initial-scale=1.0">
    <title>Document</title>
    <!-- 引入资源 -->
    <script src="echarts.min.js"></script>
        <script type="text/javascript">
        window.onload=function(){
      // 基于准备好的dom,初始化echarts实例
      var myChart = echarts.init(document.getElementById('main'));

      // 指定图表的配置项和数据
option = {
  // 标题组件
  title: {
    // 标题文本内容
    text: 'msf',
    // 还可以设置别的,具体查一下
    //逗号隔开
    backgroundColor:'yellow',
    borderColor:'pink',
    borderWidth:4,
    // 文字样式
    textStyle:{
      // 文字颜色
      color:'blue',
      // 文字大小
      fontSize:30,
    },
    // 距离左边的距离
    left:20,
    top:10,
  },
  // 提示框组件
  tooltip: {
    trigger: 'axis'
  },
  // 图例组件
  legend: {
    data: ['Email', 'Union Ads', 'Video Ads', 'Direct', 'Search Engine']
  },
  // 网格区域
  grid: {
    left: '3%',
    right: '4%',
    bottom: '3%',
    containLabel: true
  },
  // 工具箱组件
  toolbox: {
    feature: {
      saveAsImage: {}
    }
  },
  // x轴
  xAxis: {
    type: 'category',
    boundaryGap: false,
    data: ['Mon', 'Tue', 'Wed', 'Thu', 'Fri', 'Sat', 'Sun']
  },
  // y轴
  yAxis: {
    type: 'value'
  },
  // 系列列表
  series: [
    {
      name: 'Email',
      // line折线图,bar柱状图
      type: 'line',
      // 表示累加
      stack: 'Total',
      data: [120, 132, 101, 134, 90, 230, 210]
    },
    {
      name: 'Union Ads',
      type: 'line',
      stack: 'Total',
      data: [220, 182, 191, 234, 290, 330, 310]
    },
    {
      name: 'Video Ads',
      type: 'line',
      stack: 'Total',
      data: [150, 232, 201, 154, 190, 330, 410]
    },
    {
      name: 'Direct',
      type: 'line',
      stack: 'Total',
      data: [320, 332, 301, 334, 390, 330, 320]
    },
    {
      name: 'Search Engine',
      type: 'line',
      stack: 'Total',
      data: [820, 932, 901, 934, 1290, 1330, 1320]
    }
  ],
  // 调色板
  color:['pink','black','red','green','blue'],
  };
      // 使用刚指定的配置项和数据显示图表。
      myChart.setOption(option);
    }
    </script>
    <!-- 想调这个表格的样式 -->
     <style>
        #main{
            width:40%;
            height:35vh;
            background: rgb(239, 199, 199);
        }

     </style>

</head>
<body>
      <body>
    <!-- 为 ECharts 准备一个定义了宽高的 DOM -->
    <div id="main" style="width: 600px;height:400px;"></div>

  </body>
</html>
</body>
</html>