上一期讲了:
根据Wireshark捕获数据包时间和长度绘制电脑发射信号波形-CSDN博客
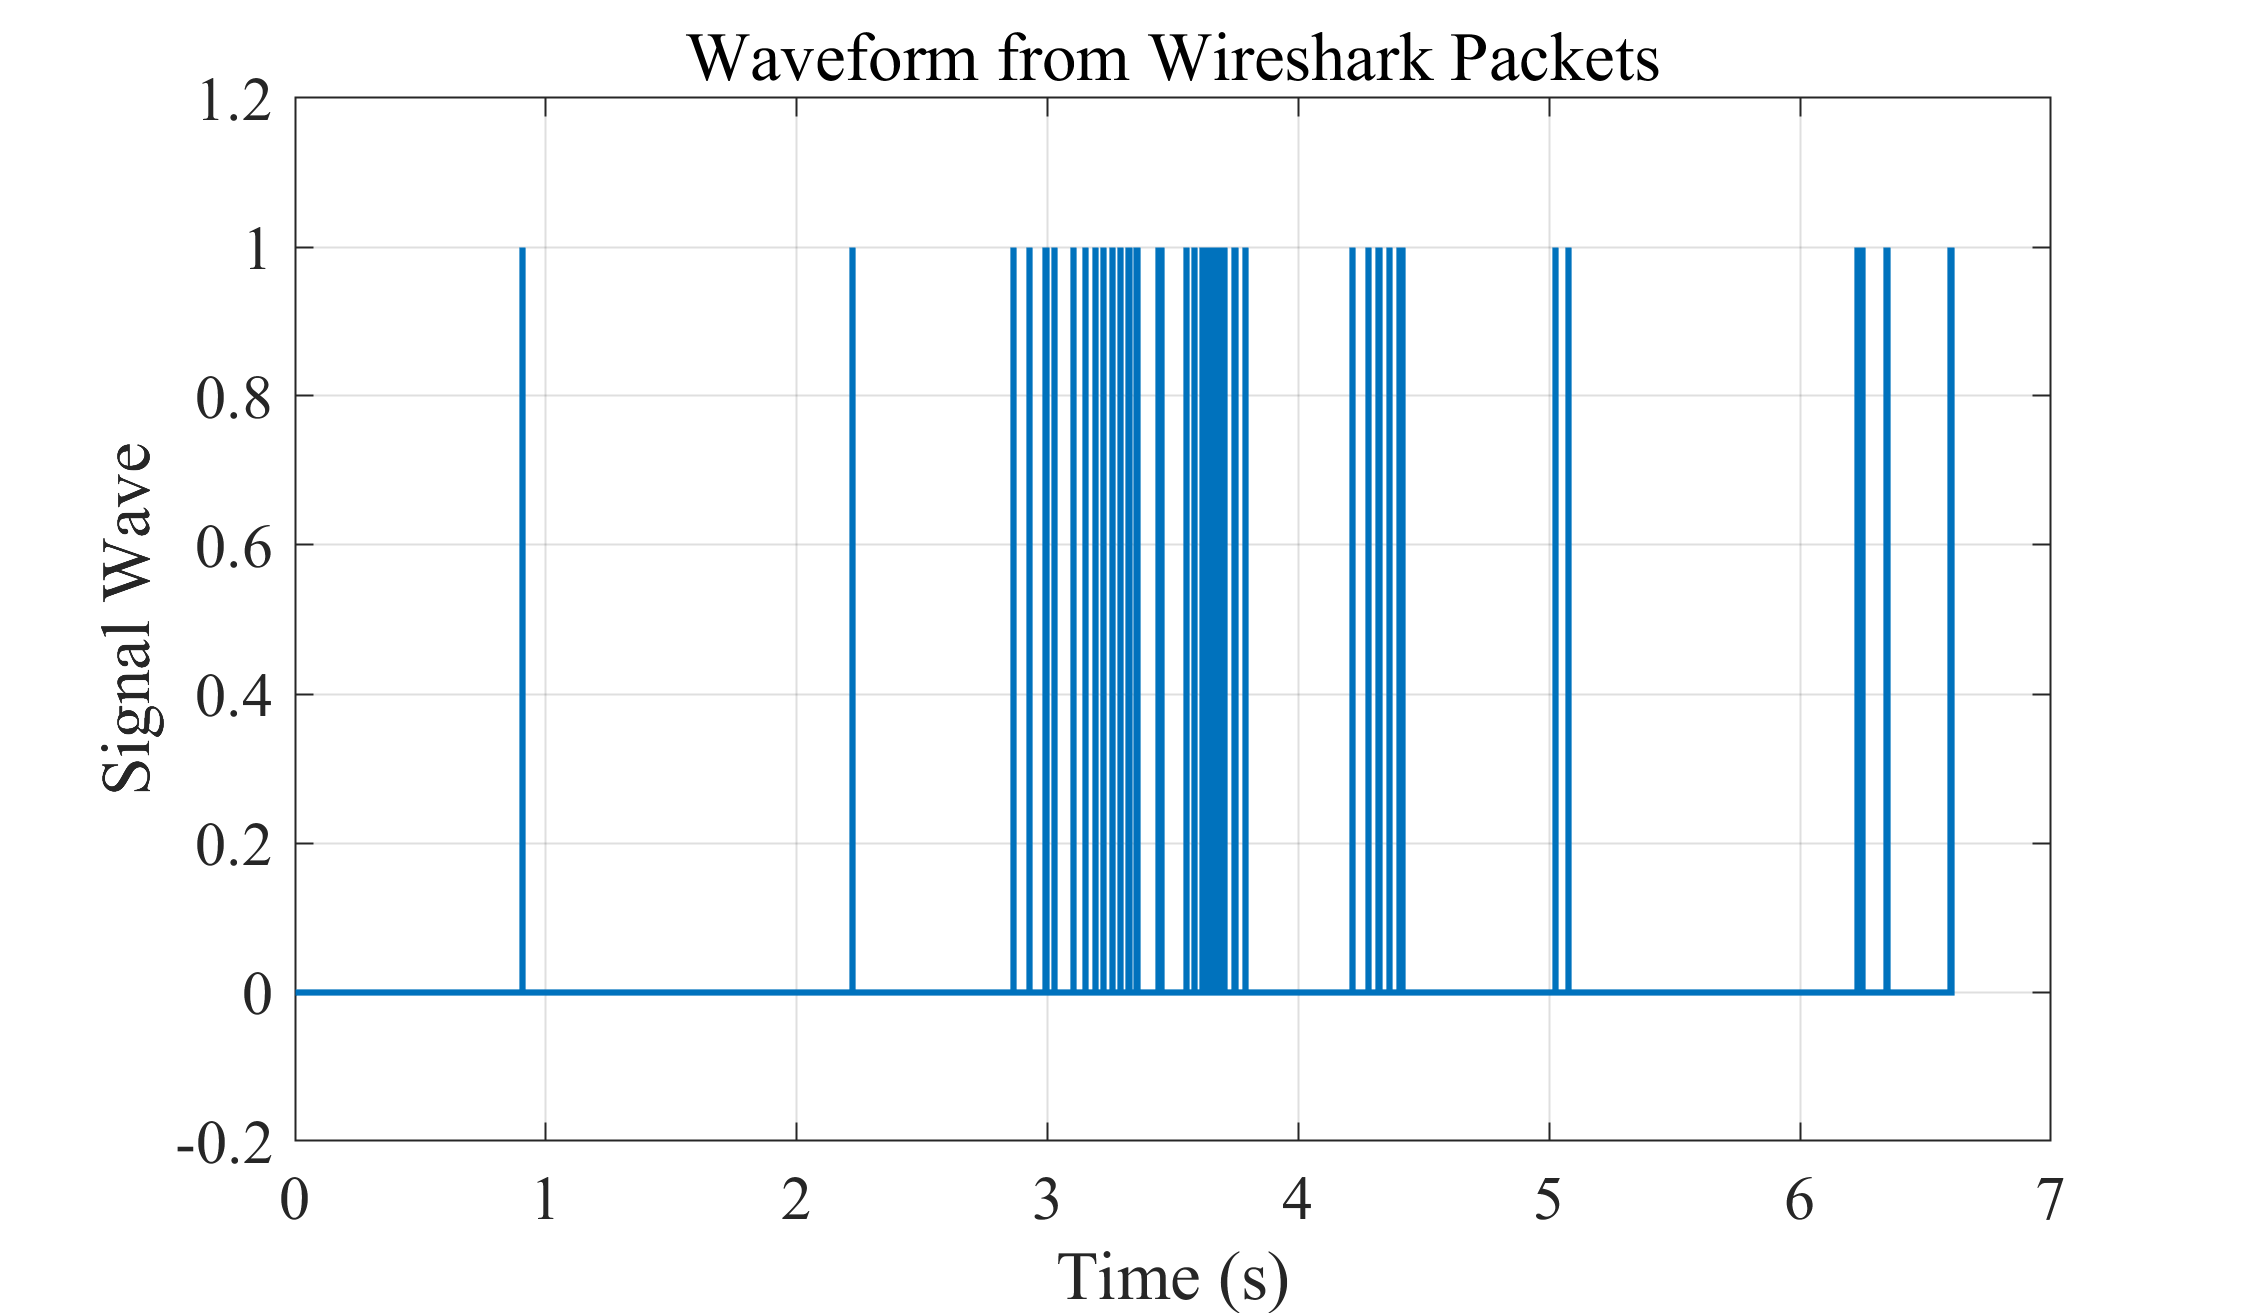
这一期绘制路由器路由器发送给电脑数据的信号波形,这样可以比对电脑、路由器互相发送数据信号波形的关系。
一、筛选数据
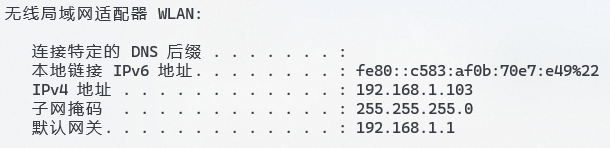
192.168.1.103是我电脑的ip:
从Wireshark导出的数据中筛选发送给我电脑的部分:
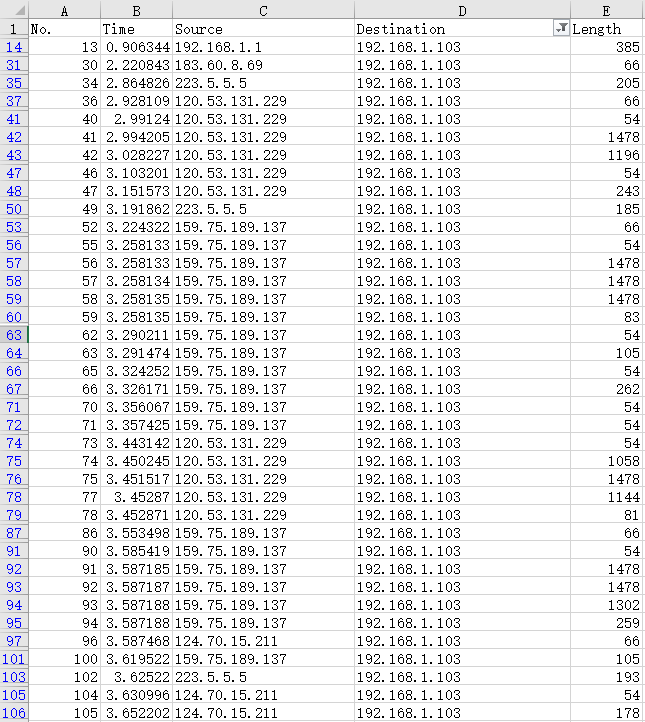
无论Source是不是我的路由器ip:
数据包最终都是经由路由器发送给我的电脑。因为我的电脑连接路由器WiFi上网:
二、绘制波形
程序:
Matlab
%zhouzhichao
%2025年8月20日
%把Wireshark捕获的数据绘制为波形图
%路由器发送给电脑的信号

clc
clear
close all

% 读取 Excel 文件
data = readtable('time and length direction=192.168.1.103.xlsx');

% 查看前几行
head(data)

% 单独取出时间和长度
time = data.Time;
length = data.Length;
% 基本清洗
mask = ~isnan(time) & ~isnan(length);
time   = time(mask);
length = length(mask);

%% 参数:每字节耗时
t_per_byte = 26.7e-9;     % 26.7 ns/Byte

%% 计算每个包的起止时间
t_end   = time(:);
t_start = t_end - length(:) .* t_per_byte;

% 若有负起点,截到 0(可按需要注释)
t_start = max(t_start, 0);

% 以起点升序排序
intervals = sortrows([t_start t_end], 1);

%% (可选)合并重叠或紧邻的区间,减少锯齿段数量
% "紧邻"的阈值(例如 < 1 ns 认为相连)
touch_eps = 1e-9;  % 1 ns
merged = [];
for k = 1:size(intervals,1)
    s = intervals(k,1); e = intervals(k,2);
    if isempty(merged)
        merged = [s e];
    else
        if s <= merged(end,2) + touch_eps
            % 重叠/相邻:向后扩展
            merged(end,2) = max(merged(end,2), e);
        else
            merged = [merged; s e];
        end
    end
end

%% 生成阶梯波形的 (t, y) 点列
t_plot = [];
y_plot = [];
for k = 1:size(merged,1)
    s = merged(k,1); e = merged(k,2);
    % 对于每个区间 [s, e],追加四个点: (s,0)->(s,1)->(e,1)->(e,0)
    t_plot = [t_plot; s; s; e; e];
    y_plot = [y_plot; 0; 1; 1; 0];
end

% 若希望在图上从 0 持续到首个 s 前也显示 0,可以在最前面加一个点
if ~isempty(t_plot)
    t_plot = [min(0, t_plot(1)); t_plot];
    y_plot = [0; y_plot];
end

%% 绘图
figure;
stairs(t_plot, y_plot, 'LineWidth', 1.5);
ylim([-0.2 1.2]);
xlabel('Time (s)');
ylabel('Signal Wave');
title('Waveform from Wireshark Packets');
grid on;

set(gca, 'FontName', 'Times New Roman')
set(gca, 'FontSize', 15)
绘制效果: