需求预测与库存优化 (快消品) - 自定义组件
概述
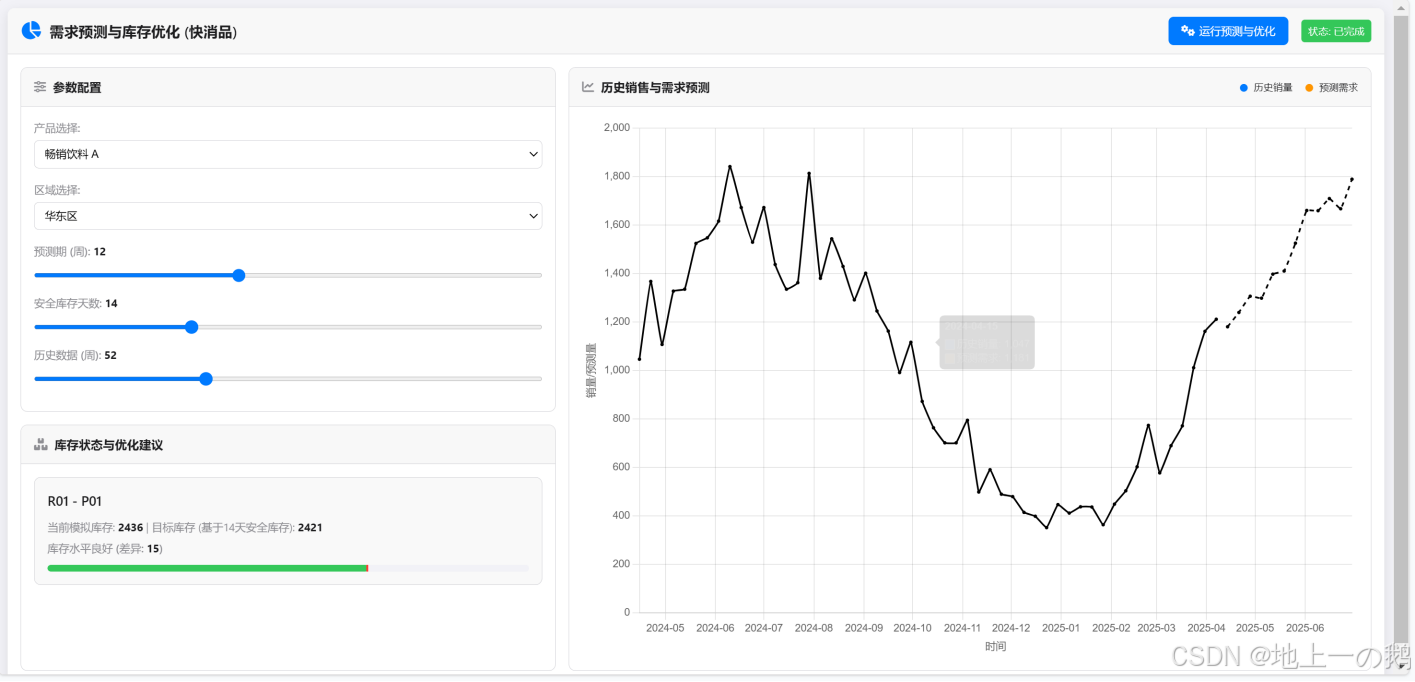
这是一个用于模拟和可视化快消品 (FMCG) 需求预测与库存优化流程的组件。用户可以选择不同的产品和区域,调整预测参数和库存策略,然后运行模拟以查看历史销售、预测需求以及基于目标安全库存的优化建议。
组件旨在帮助理解季节性对销售的影响、需求预测的基本方法以及如何根据预测和库存策略来指导补货决策。
功能特性
- 参数化模拟:
- 选择不同的模拟产品(如饮料、零食、洗护)和销售区域。
- 调整预测期长度(未来预测多少周)。
- 调整目标安全库存覆盖天数。
- 调整用于预测的历史数据长度。
- 数据生成与模拟:
- 模拟生成带有明显季节性特征和随机波动的历史周销售数据。
- 基于历史数据和季节性指数,使用简化的季节性移动平均法生成未来需求预测。
- 模拟当前的库存水平(基于近期销售表现随机生成)。
- 库存优化:
- 根据预测期的平均需求和设定的安全库存天数,计算目标库存水平。
- 比较当前库存与目标库存,生成明确的"增加库存"、"减少库存"或"库存平衡"的建议及数量。
- 数据可视化:
- 使用 Chart.js 动态绘制折线图,清晰展示历史销售曲线和预测需求曲线。
- 在专门的面板中展示关键信息:当前库存、目标库存和优化建议。
- 使用条形图直观表示当前库存相对于目标库存的水平。
- 交互式体验:
- 通过滑块和下拉菜单轻松调整模拟参数。
- 参数变化实时反馈到界面。
- 点击按钮触发预测和优化计算。
- 清晰的状态指示(未运行、运行中、已完成)。
- Appsmith 兼容性:
- 采用健壮的初始化逻辑(多次尝试、延迟)以适应 Appsmith 自定义组件的加载环境。
- 使用
container.querySelector进行 DOM 元素查找。 - 全面的错误处理和用户友好的错误消息提示。
文件结构
/供应链管理组件
└── /fmcg-inventory-optimization
    ├── index.html         # 组件的 HTML 结构
    ├── styles.css         # 组件的 CSS 样式 (苹果科技工业风格)
    ├── script.js          # 组件的核心 JavaScript 逻辑
    └── README.md          # 本说明文件
使用方法
- 将
index.html的内容复制到 HTML 编辑器中。 - 将
styles.css的内容复制到 CSS 编辑器中。 - 将
script.js的内容复制到 JavaScript 编辑器中。 - 调整组件大小以适应内容展示,建议宽度较宽,高度适中(例如 600px)。
交互流程:
- 通过配置面板选择产品、区域,并使用滑块调整预测期、安全库存天数和历史数据长度。
- 点击"运行预测与优化"按钮。
- 组件状态将变为"运行中",然后计算完成变为"已完成"。
- 图表区域将显示历史销售和预测需求曲线。
- 库存状态面板将显示当前模拟库存、计算出的目标库存以及相应的增加/减少/平衡建议。
技术栈
- HTML5
- CSS3 (Flexbox, Grid)
- JavaScript (ES6+)
- Chart.js (用于图表绘制)
- Chart.js Date Adapter (date-fns)
- Font Awesome (用于图标)
模拟逻辑说明
- 历史销售:
BaseSales * SeasonalityIndex * (1 + RandomNoise) - 需求预测: 基于过去 N 周(例如 4 周)的去季节性销量估算基础销量,然后乘以未来周期的季节性指数。
- 当前库存: 基于最近几周的平均销量乘以一个随机系数(0.5 到 2.5 之间)来模拟。
- 目标库存: (未来 N 天的平均预测日销量) * 安全库存天数,其中 N 等于安全库存天数。
- 优化建议: 基于当前库存与目标库存的差异百分比(阈值设为 +/- 10%)决定。
注意事项与限制
- 这是一个 模拟 组件,所有数据(历史销售、当前库存)都是动态生成的,并非真实数据。
- 预测模型(季节性移动平均)相对 简化,仅用于演示目的,实际应用中需要更复杂的模型(如 ARIMA, Prophet 等)。
- 库存优化逻辑基于单一产品的安全库存策略,未考虑多产品关联、供应链延迟、最小订单量等复杂因素。
- 组件的性能可能受历史数据量和预测期长度影响。
未来可扩展方向
- 集成更高级的预测模型。
- 支持多产品、多区域同时分析和优化。
- 考虑补货提前期、运输成本等因素进行更复杂的库存策略模拟。
- 允许用户上传或连接外部数据源。
- 添加更详细的 KPI 指标,如缺货率、库存周转率等。
效果展示
源码
index.html
javascript
<!DOCTYPE html>
<html lang="zh-CN">
<head>
    <meta charset="UTF-8">
    <meta name="viewport" content="width=device-width, initial-scale=1.0">
    <title>需求预测与库存优化 (快消品)</title>
    <link rel="stylesheet" href="styles.css">
    <!-- Chart.js for visualization -->
    <script src="https://cdn.jsdelivr.net/npm/chart.js"></script>
    <script src="https://cdn.jsdelivr.net/npm/chartjs-adapter-date-fns/dist/chartjs-adapter-date-fns.bundle.min.js"></script>
     <!-- Font Awesome for Icons -->
     <link rel="stylesheet" href="https://cdnjs.cloudflare.com/ajax/libs/font-awesome/6.0.0/css/all.min.css">
</head>
<body>
    <div class="app-container">
        <!-- Header -->
        <header class="app-header">
            <div class="header-title">
                <i class="fas fa-chart-pie header-icon"></i>
                <h1>需求预测与库存优化 (快消品)</h1>
            </div>
            <div class="simulation-controls">
                 <button id="run-simulation-btn" class="btn btn-primary"><i class="fas fa-cogs"></i> 运行预测与优化</button>
                 <span id="simulation-status" class="status-badge">状态: 未运行</span>
            </div>
        </header>

        <!-- Main Content Area -->
        <main class="app-content">
            <!-- Configuration Panel -->
            <section class="panel config-panel">
                <div class="panel-header">
                    <h2><i class="fas fa-sliders-h"></i> 参数配置</h2>
                </div>
                <div class="panel-content">
                    <div class="config-group">
                        <label for="product-select">产品选择:</label>
                        <select id="product-select">
                            <option value="P01">畅销饮料 A</option>
                            <option value="P02">热门零食 B</option>
                            <option value="P03">日用洗护 C</option>
                        </select>
                    </div>
                    <div class="config-group">
                        <label for="region-select">区域选择:</label>
                        <select id="region-select">
                            <option value="R01">华东区</option>
                            <option value="R02">华南区</option>
                            <option value="R03">华北区</option>
                            <option value="R04">西南区</option>
                        </select>
                    </div>
                     <div class="config-group">
                        <label for="forecast-horizon-slider">预测期 (周): <span id="forecast-horizon-value">12</span></label>
                        <input type="range" id="forecast-horizon-slider" min="4" max="24" value="12" step="1">
                    </div>
                     <div class="config-group">
                        <label for="safety-stock-days-slider">安全库存天数: <span id="safety-stock-days-value">14</span></label>
                        <input type="range" id="safety-stock-days-slider" min="7" max="30" value="14" step="1">
                    </div>
                     <div class="config-group">
                        <label for="historical-data-weeks-slider">历史数据 (周): <span id="historical-data-weeks-value">52</span></label>
                        <input type="range" id="historical-data-weeks-slider" min="26" max="104" value="52" step="1">
                    </div>
                </div>
            </section>

            <!-- History & Forecast Panel -->
            <section class="panel chart-panel">
                <div class="panel-header">
                    <h2><i class="fas fa-chart-line"></i> 历史销售与需求预测</h2>
                     <div class="chart-legend">
                        <span class="legend-item history"><i class="fas fa-circle"></i> 历史销量</span>
                        <span class="legend-item forecast"><i class="fas fa-circle"></i> 预测需求</span>
                    </div>
                </div>
                <div class="panel-content chart-container">
                    <canvas id="sales-forecast-chart"></canvas>
                     <p id="chart-placeholder" class="placeholder">请点击"运行预测与优化"生成图表。</p>
                </div>
            </section>

            <!-- Inventory & Optimization Panel -->
            <section class="panel inventory-panel">
                <div class="panel-header">
                    <h2><i class="fas fa-boxes"></i> 库存状态与优化建议</h2>
                </div>
                <div class="panel-content scrollable">
                     <div id="inventory-details">
                         <p class="placeholder">请选择产品和区域,并运行模拟。</p>
                        <!-- Inventory details and optimization suggestions will be loaded here -->
                        <!-- Example Structure:
                        <div class="inventory-item">
                            <h4>华东区 - 畅销饮料 A</h4>
                            <p>当前库存: <span class="current-stock">1500</span> | 目标库存: <span class="target-stock">2500</span></p>
                            <p class="optimization-suggestion increase">建议增加库存: <span class="suggestion-amount">1000</span></p>
                            <div class="inventory-bar">
                                <div class="bar-current" style="width: 60%;"></div>
                                <div class="bar-target" style="left: 100%;"></div>
                            </div>
                        </div>
                        -->
                    </div>
                </div>
            </section>
        </main>
    </div>

    <script src="script.js"></script>
</body>
</html>
styles.css
javascript
:root {
    --primary-color: #007aff; /* Apple Blue */
    --secondary-color: #5856d6; /* Apple Purple */
    --background-color: #f2f2f7; /* Apple Light Gray */
    --panel-background-color: #ffffff;
    --text-color: #1c1c1e; /* Near Black */
    --text-color-secondary: #8e8e93; /* Gray */
    --border-color: #d1d1d6;
    --success-color: #34c759; /* Apple Green */
    --warning-color: #ff9500; /* Apple Orange */
    --error-color: #ff3b30; /* Apple Red */
    --history-color: #007aff;
    --forecast-color: #ff9500;
    --inventory-current-color: #34c759;
    --inventory-target-color: #ff3b30;

    --font-family: -apple-system, BlinkMacSystemFont, "Segoe UI", Roboto, Helvetica, Arial, sans-serif;
    --border-radius: 8px;
    --panel-padding: 15px;
    --panel-header-height: 45px;
}

* {
    box-sizing: border-box;
    margin: 0;
    padding: 0;
}

body {
    font-family: var(--font-family);
    background-color: var(--background-color);
    color: var(--text-color);
    line-height: 1.5;
    font-size: 14px;
    overflow-x: hidden; /* Prevent horizontal scroll */
}

.app-container {
    display: flex;
    flex-direction: column;
    height: 100vh; /* Fallback for older browsers */
    height: 100dvh; /* Dynamic viewport height */
    max-height: 800px; /* Limit height as requested */
    overflow: hidden; /* Prevent whole container scroll */
    background-color: var(--panel-background-color);
    border-radius: var(--border-radius);
    box-shadow: 0 4px 12px rgba(0, 0, 0, 0.1);
    margin: 10px; /* Add some margin around the container */
}

/* Header */
.app-header {
    display: flex;
    justify-content: space-between;
    align-items: center;
    padding: 10px var(--panel-padding);
    border-bottom: 1px solid var(--border-color);
    background-color: #f8f8f8;
    border-top-left-radius: var(--border-radius);
    border-top-right-radius: var(--border-radius);
}

.header-title {
    display: flex;
    align-items: center;
}

.header-icon {
    font-size: 1.5em;
    color: var(--primary-color);
    margin-right: 10px;
}

.app-header h1 {
    font-size: 1.2em;
    font-weight: 600;
    color: var(--text-color);
}

.simulation-controls {
    display: flex;
    align-items: center;
    gap: 15px;
}

/* Buttons */
.btn {
    padding: 8px 15px;
    border: none;
    border-radius: 6px;
    cursor: pointer;
    font-size: 0.9em;
    font-weight: 500;
    transition: background-color 0.2s ease, transform 0.1s ease;
    display: inline-flex;
    align-items: center;
    gap: 5px;
}

.btn-primary {
    background-color: var(--primary-color);
    color: #fff;
}

.btn-primary:hover {
    background-color: #005ec4;
}

.btn:active {
    transform: scale(0.98);
}

.status-badge {
    font-size: 0.85em;
    padding: 4px 8px;
    border-radius: 4px;
    background-color: var(--text-color-secondary);
    color: #fff;
}

/* Main Content Area */
.app-content {
    display: grid;
    grid-template-columns: 2fr 3fr; /* Adjust ratio as needed */
    grid-template-rows: auto 1fr; /* Config row, then charts/inventory */
    grid-template-areas:
        "config chart"
        "inventory chart";
    gap: var(--panel-padding);
    padding: var(--panel-padding);
    flex-grow: 1;
    overflow: hidden; /* Prevent content scroll */
}

/* Panels */
.panel {
    background-color: var(--panel-background-color);
    border: 1px solid var(--border-color);
    border-radius: var(--border-radius);
    display: flex;
    flex-direction: column;
    overflow: hidden; /* Important for scrollable content */
}

.panel-header {
    display: flex;
    justify-content: space-between;
    align-items: center;
    padding: 10px var(--panel-padding);
    border-bottom: 1px solid var(--border-color);
    background-color: #f8f8f8;
    height: var(--panel-header-height);
    flex-shrink: 0;
}

.panel-header h2 {
    font-size: 1em;
    font-weight: 600;
    display: flex;
    align-items: center;
    gap: 8px;
}

.panel-header h2 i {
    color: var(--text-color-secondary);
}

.panel-content {
    padding: var(--panel-padding);
    flex-grow: 1;
    overflow-y: auto; /* Allow vertical scroll within content */
}

.scrollable {
    overflow-y: auto;
}

/* Specific Panel Assignments */
.config-panel {
    grid-area: config;
}

.inventory-panel {
    grid-area: inventory;
}

.chart-panel {
    grid-area: chart;
}

/* Configuration Styles */
.config-group {
    margin-bottom: 15px;
}

.config-group label {
    display: block;
    font-size: 0.9em;
    font-weight: 500;
    margin-bottom: 5px;
    color: var(--text-color-secondary);
}

.config-group select,
.config-group input[type="range"] {
    width: 100%;
    padding: 8px;
    border: 1px solid var(--border-color);
    border-radius: 6px;
    font-size: 0.9em;
    background-color: #fff;
}

.config-group input[type="range"] {
    padding: 0;
    height: 5px;
    cursor: pointer;
    accent-color: var(--primary-color);
}

.config-group label span {
    font-weight: bold;
    color: var(--text-color);
}

/* Chart Styles */
.chart-container {
    position: relative; /* Needed for placeholder */
    height: 100%; /* Ensure canvas can take height */
    min-height: 200px; /* Prevent collapsing */
}

#sales-forecast-chart {
    display: block;
    width: 100% !important;
    height: 100% !important;
}

.chart-legend {
    display: flex;
    gap: 15px;
    font-size: 0.8em;
    align-items: center;
}

.legend-item i {
    margin-right: 4px;
    font-size: 0.8em;
}
.legend-item.history i { color: var(--history-color); }
.legend-item.forecast i { color: var(--forecast-color); }

/* Inventory Styles */
#inventory-details .placeholder {
    text-align: center;
    color: var(--text-color-secondary);
    padding-top: 20px;
}

.inventory-item {
    border: 1px solid var(--border-color);
    border-radius: var(--border-radius);
    padding: 15px;
    margin-bottom: 15px;
    background-color: #f9f9f9;
}

.inventory-item h4 {
    font-size: 1.1em;
    font-weight: 600;
    margin-bottom: 10px;
}

.inventory-item p {
    font-size: 0.9em;
    margin-bottom: 5px;
    color: var(--text-color-secondary);
}

.inventory-item .current-stock,
.inventory-item .target-stock,
.inventory-item .suggestion-amount {
    font-weight: bold;
    color: var(--text-color);
}

.optimization-suggestion.increase {
    color: var(--success-color);
    font-weight: 500;
}

.optimization-suggestion.decrease {
    color: var(--error-color);
    font-weight: 500;
}

.optimization-suggestion.balanced {
    color: var(--text-color-secondary);
    font-weight: 500;
}

.inventory-bar {
    height: 8px;
    background-color: var(--background-color);
    border-radius: 4px;
    margin-top: 10px;
    position: relative;
    overflow: hidden;
}

.inventory-bar .bar-current {
    position: absolute;
    left: 0;
    top: 0;
    height: 100%;
    background-color: var(--inventory-current-color);
    border-radius: 4px;
    transition: width 0.5s ease;
}

.inventory-bar .bar-target {
    position: absolute;
    top: -2px; /* Slightly offset to be visible */
    bottom: -2px;
    width: 2px;
    background-color: var(--inventory-target-color);
    transition: left 0.5s ease;
}

/* Placeholder */
.placeholder {
    text-align: center;
    color: var(--text-color-secondary);
    font-style: italic;
    padding: 20px;
}

/* Responsive Adjustments */
@media (max-width: 768px) {
    .app-content {
        grid-template-columns: 1fr; /* Stack panels */
        grid-template-rows: auto auto auto; /* One row per panel type */
        grid-template-areas:
            "config"
            "chart"
            "inventory";
        overflow-y: auto; /* Allow scrolling on mobile */
    }

    .app-container {
        max-height: none; /* Allow full height on mobile */
         margin: 0;
         border-radius: 0;
    }

    .panel-content {
         min-height: 150px; /* Give panels some min height */
    }

     .chart-container {
         min-height: 250px; /* Make chart taller on mobile */
     }

    .app-header h1 {
        font-size: 1em;
    }
}
script.js
javascript
/* =============================================================================
FMCG Demand Forecasting & Inventory Optimization - Script
============================================================================= */
// --- Configuration & Constants ---
const WEEKS_PER_YEAR = 52;
const DAYS_PER_WEEK = 7;
// --- Simulation Data (Product & Region Specific Base Sales & Seasonality) ---
const BASE_SALES = {
P01: { R01: 1000, R02: 1200, R03: 800, R04: 600 },
P02: { R01: 500, R02: 400, R03: 600, R04: 300 },
P03: { R01: 700, R02: 800, R03: 500, R04: 450 },
};
// Simplified weekly seasonality index (0-51 weeks), peak around week 20-30
const SEASONALITY_INDEX = Array.from({ length: WEEKS_PER_YEAR }, (_, i) => {
// Simple sine wave + noise for seasonality
const peakWeek = 26;
const troughWeek = 0;
const amplitude = 0.6; // Peak is 1 + 0.6 = 1.6 times base
const phaseShift = -Math.PI / 2; // Start near trough
const index = 1 + amplitude * Math.sin((i / WEEKS_PER_YEAR) * 2 * Math.PI + phaseShift);
return Math.max(0.4, index + (Math.random() - 0.5) * 0.2); // Add noise, ensure min 0.4
});
// --- Global State ---
let state = {
selectedProduct: 'P01',
selectedRegion: 'R01',
forecastHorizonWeeks: 12,
safetyStockDays: 14,
historicalDataWeeks: 52,
isRunning: false,
historicalSales: [], // [{ date: Date, sales: number }]
forecast: [], // [{ date: Date, forecast: number }]
currentInventory: 0,
targetInventory: 0,
optimizationSuggestion: { type: 'none', amount: 0 },
chartInstance: null,
};
// --- DOM Elements Cache ---
const elements = {};
// =============================================================================
// Initialization (Appsmith Optimized)
// =============================================================================
let initializationAttempts = 0;
const MAX_INITIALIZATION_ATTEMPTS = 10;
const INITIALIZATION_RETRY_DELAY = 500;
function attemptInitialization() {
console.log(`Attempting to initialize FMCG app (Attempt ${initializationAttempts + 1}/${MAX_INITIALIZATION_ATTEMPTS})`);
if (document.readyState === 'loading') {
console.log("Document still loading, waiting for DOMContentLoaded.");
document.addEventListener('DOMContentLoaded', () => setTimeout(attemptInitialization, 100));
return;
}
const appContainer = document.querySelector('.app-container');
if (!appContainer) {
initializationAttempts++;
if (initializationAttempts < MAX_INITIALIZATION_ATTEMPTS) {
console.log(`App container not found, retrying in ${INITIALIZATION_RETRY_DELAY}ms...`);
setTimeout(attemptInitialization, INITIALIZATION_RETRY_DELAY);
} else {
console.error(`Failed to find app container after ${MAX_INITIALIZATION_ATTEMPTS} attempts.`);
showErrorMessage("应用容器加载失败,请刷新重试。");
}
return;
}
console.log("App container found, proceeding with initialization.");
initializeApp(appContainer);
}
function initializeApp(container) {
console.log("Initializing FMCG App...");
try {
if (!queryDOMElements(container)) {
console.error("Initialization failed: Missing essential DOM elements.");
showErrorMessage("界面元素加载不完整,请刷新重试。");
return;
}
setupEventListeners();
updateConfigDisplay(); // Update display based on initial state
renderPlaceholder(); // Show initial placeholder message
console.log("FMCG App Initialized.");
} catch (error) {
console.error("Error during app initialization:", error);
showErrorMessage(`初始化出错: ${error.message}`);
}
}
function queryDOMElements(container) {
console.log("Querying DOM elements...");
const ids = [
'run-simulation-btn',
'simulation-status',
'product-select',
'region-select',
'forecast-horizon-slider',
'forecast-horizon-value',
'safety-stock-days-slider',
'safety-stock-days-value',
'historical-data-weeks-slider',
'historical-data-weeks-value',
'sales-forecast-chart',
'chart-placeholder',
'inventory-details'
];
let allFound = true;
elements.container = container; // Store container reference
ids.forEach(id => {
// Try finding by ID first, then fallback to more specific selectors if needed
elements[id] = container.querySelector(`#${id}`);
if (!elements[id]) {
console.warn(`DOM element not found: #${id}`);
// Attempt fallback selectors for specific elements if necessary
if (id === 'sales-forecast-chart') elements[id] = container.querySelector('canvas');
// Add more fallbacks if needed
if (!elements[id]) {
allFound = false;
}
}
});
if (!allFound) {
console.error("关键 DOM 元素缺失,请检查 HTML 结构。 Missing elements logged above.");
return false;
}
console.log("DOM elements queried successfully.");
return true;
}
function setupEventListeners() {
console.log("Setting up event listeners...");
try {
if (elements['run-simulation-btn']) {
elements['run-simulation-btn'].addEventListener('click', handleRunSimulation);
} else console.error("run-simulation-btn not found for event listener");
// Config sliders
if (elements['forecast-horizon-slider']) {
elements['forecast-horizon-slider'].addEventListener('input', handleConfigChange);
} else console.error("forecast-horizon-slider not found");
if (elements['safety-stock-days-slider']) {
elements['safety-stock-days-slider'].addEventListener('input', handleConfigChange);
} else console.error("safety-stock-days-slider not found");
if (elements['historical-data-weeks-slider']) {
elements['historical-data-weeks-slider'].addEventListener('input', handleConfigChange);
} else console.error("historical-data-weeks-slider not found");
// Config selects
if (elements['product-select']) {
elements['product-select'].addEventListener('change', handleConfigChange);
} else console.error("product-select not found");
if (elements['region-select']) {
elements['region-select'].addEventListener('change', handleConfigChange);
} else console.error("region-select not found");
console.log("Event listeners set up.");
} catch (error) {
console.error("Error setting up event listeners:", error);
}
}
// =============================================================================
// Event Handlers
// =============================================================================
function handleConfigChange(event) {
console.log("Configuration changed:", event.target.id);
try {
// Update state based on which element triggered the change
switch (event.target.id) {
case 'product-select':
state.selectedProduct = event.target.value;
break;
case 'region-select':
state.selectedRegion = event.target.value;
break;
case 'forecast-horizon-slider':
state.forecastHorizonWeeks = parseInt(event.target.value);
break;
case 'safety-stock-days-slider':
state.safetyStockDays = parseInt(event.target.value);
break;
case 'historical-data-weeks-slider':
state.historicalDataWeeks = parseInt(event.target.value);
break;
}
updateConfigDisplay();
// Optionally, clear results or re-run simulation automatically?
// For now, require manual click on "Run"
renderPlaceholder(); // Clear results on config change
} catch (error) {
console.error("Error handling config change:", error);
}
}
function handleRunSimulation() {
console.log("Run Simulation button clicked.");
if (state.isRunning) {
console.log("Simulation already running.");
return;
}
state.isRunning = true;
updateStatus('运行中...');
disableControls(true);
// Simulate the process asynchronously
setTimeout(() => {
try {
console.log("Starting simulation logic...");
// 1. Generate historical data
state.historicalSales = generateHistoricalSales(
state.selectedProduct,
state.selectedRegion,
state.historicalDataWeeks
);
console.log(`Generated ${state.historicalSales.length} weeks of historical data.`);
// 2. Generate forecast
state.forecast = generateDemandForecast(
state.historicalSales,
state.forecastHorizonWeeks
);
console.log(`Generated ${state.forecast.length} weeks of forecast data.`);
// 3. Simulate current inventory (e.g., based on last few weeks sales)
state.currentInventory = simulateCurrentInventory(state.historicalSales);
console.log(`Simulated current inventory: ${state.currentInventory}`);
// 4. Calculate target inventory & optimization
const optimizationResult = calculateInventoryOptimization(
state.forecast,
state.safetyStockDays,
state.currentInventory
);
state.targetInventory = optimizationResult.target;
state.optimizationSuggestion = optimizationResult.suggestion;
console.log(`Calculated target inventory: ${state.targetInventory}, Suggestion: ${optimizationResult.suggestion.type} ${optimizationResult.suggestion.amount}`);
// 5. Render results
renderResults();
console.log("Simulation and rendering complete.");
} catch (error) {
console.error("Error during simulation run:", error);
showErrorMessage(`模拟运行时出错: ${error.message}`);
renderPlaceholder(); // Show placeholder on error
} finally {
state.isRunning = false;
updateStatus('已完成');
disableControls(false);
}
}, 50); // Small delay to allow UI update for status
}
// =============================================================================
// Simulation Logic
// =============================================================================
function generateHistoricalSales(productId, regionId, weeks) {
const salesData = [];
const base = BASE_SALES[productId]?.[regionId] || 500; // Default base sales
const today = new Date();
today.setHours(0, 0, 0, 0);
for (let i = weeks; i > 0; i--) {
const date = new Date(today);
date.setDate(today.getDate() - i * DAYS_PER_WEEK);
const weekOfYear = getWeekOfYear(date);
const seasonality = SEASONALITY_INDEX[weekOfYear];
// Add random noise
const noise = 1 + (Math.random() - 0.5) * 0.3; // +/- 15% noise
const sales = Math.max(0, Math.round(base * seasonality * noise));
salesData.push({ date, sales });
}
return salesData;
}
function generateDemandForecast(historicalSales, forecastWeeks) {
const forecastData = [];
if (!historicalSales || historicalSales.length === 0) return forecastData;
const lastHistoricalDate = historicalSales[historicalSales.length - 1].date;
const historicalValues = historicalSales.map(d => d.sales);
// Simple Seasonal Moving Average (using full cycle for seasonality index)
const cycleLength = WEEKS_PER_YEAR;
const movingAveragePeriod = 4; // Use 4-week moving average
for (let i = 1; i <= forecastWeeks; i++) {
const forecastDate = new Date(lastHistoricalDate);
forecastDate.setDate(lastHistoricalDate.getDate() + i * DAYS_PER_WEEK);
const forecastWeekOfYear = getWeekOfYear(forecastDate);
const forecastSeasonality = SEASONALITY_INDEX[forecastWeekOfYear];
// Calculate base using recent historical data, adjusted for seasonality
let recentBaseSum = 0;
let count = 0;
for (let j = 1; j <= movingAveragePeriod; j++) {
if (historicalSales.length >= j) {
const pastData = historicalSales[historicalSales.length - j];
const pastWeekOfYear = getWeekOfYear(pastData.date);
const pastSeasonality = SEASONALITY_INDEX[pastWeekOfYear];
if (pastSeasonality > 0.1) { // Avoid division by zero/small numbers
recentBaseSum += pastData.sales / pastSeasonality;
count++;
}
}
}
const estimatedBase = count > 0 ? recentBaseSum / count : (BASE_SALES[state.selectedProduct]?.[state.selectedRegion] || 500);
const forecastValue = Math.max(0, Math.round(estimatedBase * forecastSeasonality));
forecastData.push({ date: forecastDate, forecast: forecastValue });
}
return forecastData;
}
function simulateCurrentInventory(historicalSales) {
// Simple simulation: Assume current inventory is related to recent sales volatility + a base level
if (!historicalSales || historicalSales.length < 4) return 500; // Default if not enough data
const recentSales = historicalSales.slice(-4).map(d => d.sales);
const avgRecentSales = recentSales.reduce((a, b) => a + b, 0) / recentSales.length;
// Simulate current inventory between 0.5 and 2.5 weeks of average recent sales
const inventoryWeeks = 0.5 + Math.random() * 2;
return Math.max(0, Math.round(avgRecentSales * inventoryWeeks));
}
function calculateInventoryOptimization(forecast, safetyStockDays, currentInventory) {
if (!forecast || forecast.length === 0) {
return { target: currentInventory, suggestion: { type: 'none', amount: 0 } };
}
// Calculate total forecast demand over the safety stock period
const safetyStockWeeks = safetyStockDays / DAYS_PER_WEEK;
const relevantForecast = forecast.slice(0, Math.ceil(safetyStockWeeks));
const avgWeeklyForecast = relevantForecast.reduce((sum, item) => sum + item.forecast, 0) / relevantForecast.length;
// Target inventory = Safety Stock Demand
// Simplified: Average weekly forecast * safety stock weeks
const target = Math.round(avgWeeklyForecast * safetyStockWeeks);
const difference = target - currentInventory;
let suggestionType = 'balanced';
let suggestionAmount = 0;
if (difference > target * 0.1) { // Need > 10% increase
suggestionType = 'increase';
suggestionAmount = difference;
} else if (difference < -target * 0.1) { // Need > 10% decrease
suggestionType = 'decrease';
suggestionAmount = Math.abs(difference);
} else {
suggestionType = 'balanced';
suggestionAmount = Math.abs(difference);
}
return {
target: target,
suggestion: {
type: suggestionType,
amount: Math.round(suggestionAmount)
}
};
}
// =============================================================================
// UI Rendering
// =============================================================================
function renderResults() {
console.log("Rendering results...");
try {
if (elements['chart-placeholder']) {
elements['chart-placeholder'].style.display = 'none';
}
if (elements['sales-forecast-chart']) {
elements['sales-forecast-chart'].style.display = 'block';
}
renderChart();
renderInventoryDetails();
} catch (error) {
console.error("Error rendering results:", error);
}
}
function renderPlaceholder() {
console.log("Rendering placeholder...");
try {
if (elements['chart-placeholder']) {
elements['chart-placeholder'].style.display = 'block';
elements['chart-placeholder'].textContent = '请点击"运行预测与优化"生成图表和建议。';
}
if (elements['sales-forecast-chart'] && state.chartInstance) {
state.chartInstance.destroy();
state.chartInstance = null;
elements['sales-forecast-chart'].style.display = 'none';
}
if (elements['inventory-details']) {
elements['inventory-details'].innerHTML = '<p class="placeholder">请选择产品和区域,并运行模拟。</p>';
}
} catch (error) {
console.error("Error rendering placeholder:", error);
}
}
function renderChart() {
console.log("Rendering chart...");
try {
const ctx = elements['sales-forecast-chart']?.getContext('2d');
if (!ctx) {
console.error("Failed to get chart canvas context.");
return;
}
const historicalData = state.historicalSales.map(d => ({ x: d.date.getTime(), y: d.sales }));
const forecastData = state.forecast.map(d => ({ x: d.date.getTime(), y: d.forecast }));
// Combine dates for the x-axis labels
const allDates = [...state.historicalSales.map(d => d.date), ...state.forecast.map(d => d.date)];
if (state.chartInstance) {
state.chartInstance.destroy();
}
state.chartInstance = new Chart(ctx, {
type: 'line',
data: {
datasets: [
{
label: '历史销量',
data: historicalData,
borderColor: 'var(--history-color)',
backgroundColor: 'rgba(0, 122, 255, 0.1)',
borderWidth: 2,
pointRadius: 1,
tension: 0.1
},
{
label: '预测需求',
data: forecastData,
borderColor: 'var(--forecast-color)',
backgroundColor: 'rgba(255, 149, 0, 0.1)',
borderWidth: 2,
pointRadius: 1,
borderDash: [5, 5], // Dashed line for forecast
tension: 0.1
}
]
},
options: {
responsive: true,
maintainAspectRatio: false,
scales: {
x: {
type: 'time',
time: {
unit: 'month',
tooltipFormat: 'yyyy-MM-dd',
displayFormats: {
month: 'yyyy-MM'
}
},
title: {
display: true,
text: '时间'
}
},
y: {
beginAtZero: true,
title: {
display: true,
text: '销量/预测量'
}
}
},
plugins: {
tooltip: {
mode: 'index',
intersect: false,
},
legend: {
display: false // Use custom legend in HTML
}
},
animation: {
duration: 500 // Add subtle animation
}
}
});
console.log("Chart rendered.");
} catch (error) {
console.error("Error rendering chart:", error);
}
}
function renderInventoryDetails() {
console.log("Rendering inventory details...");
try {
const container = elements['inventory-details'];
if (!container) {
console.error("inventory-details element not found for rendering.");
return;
}
const product = state.selectedProduct; // Use actual product name later if needed
const region = state.selectedRegion; // Use actual region name later
const current = state.currentInventory;
const target = state.targetInventory;
const suggestion = state.optimizationSuggestion;
let suggestionText = '';
let suggestionClass = suggestion.type;
if (suggestion.type === 'increase') {
suggestionText = `建议增加库存: <span class="suggestion-amount">${suggestion.amount}</span>`;
} else if (suggestion.type === 'decrease') {
suggestionText = `建议减少库存: <span class="suggestion-amount">${suggestion.amount}</span>`;
} else {
suggestionText = `库存水平良好 (差异: <span class="suggestion-amount">${suggestion.amount}</span>)`;
}
// Calculate bar percentages (relative to target or max of current/target?)
// Let's make the bar width represent target*1.5 for visual space
const maxBarValue = Math.max(current, target) * 1.5;
const currentPercent = maxBarValue > 0 ? (current / maxBarValue) * 100 : 0;
const targetPercent = maxBarValue > 0 ? (target / maxBarValue) * 100 : 0;
container.innerHTML = `
<div class="inventory-item">
<h4>${escapeHtml(region)} - ${escapeHtml(product)}</h4>
<p>当前模拟库存: <span class="current-stock">${current}</span> | 目标库存 (基于${state.safetyStockDays}天安全库存): <span class="target-stock">${target}</span></p>
<p class="optimization-suggestion ${suggestionClass}">${suggestionText}</p>
<div class="inventory-bar" title="当前: ${current} / 目标: ${target}">
<div class="bar-current" style="width: ${Math.min(100, currentPercent)}%;"></div>
<div class="bar-target" style="left: ${Math.min(100, targetPercent)}%;" title="目标库存线"></div>
</div>
</div>
`;
console.log("Inventory details rendered.");
} catch (error) {
console.error("Error rendering inventory details:", error);
}
}
function updateConfigDisplay() {
console.log("Updating config display values...");
try {
if (elements['forecast-horizon-value']) {
elements['forecast-horizon-value'].textContent = state.forecastHorizonWeeks;
} else console.warn("forecast-horizon-value element not found");
if (elements['safety-stock-days-value']) {
elements['safety-stock-days-value'].textContent = state.safetyStockDays;
} else console.warn("safety-stock-days-value element not found");
if (elements['historical-data-weeks-value']) {
elements['historical-data-weeks-value'].textContent = state.historicalDataWeeks;
} else console.warn("historical-data-weeks-value element not found");
} catch (error) {
console.error("Error updating config display:", error);
}
}
function updateStatus(message) {
try {
if (elements['simulation-status']) {
elements['simulation-status'].textContent = `状态: ${message}`;
if (message === '运行中...') {
elements['simulation-status'].style.backgroundColor = 'var(--warning-color)';
} else if (message === '已完成') {
elements['simulation-status'].style.backgroundColor = 'var(--success-color)';
} else {
elements['simulation-status'].style.backgroundColor = 'var(--text-color-secondary)';
}
} else {
console.warn("simulation-status element not found to update status");
}
} catch (error) {
console.error("Error updating status display:", error);
}
}
function disableControls(disabled) {
try {
if (elements['run-simulation-btn']) elements['run-simulation-btn'].disabled = disabled;
if (elements['product-select']) elements['product-select'].disabled = disabled;
if (elements['region-select']) elements['region-select'].disabled = disabled;
if (elements['forecast-horizon-slider']) elements['forecast-horizon-slider'].disabled = disabled;
if (elements['safety-stock-days-slider']) elements['safety-stock-days-slider'].disabled = disabled;
if (elements['historical-data-weeks-slider']) elements['historical-data-weeks-slider'].disabled = disabled;
} catch (error) {
console.error("Error disabling/enabling controls:", error);
}
}
// =============================================================================
// Utility Functions
// =============================================================================
function getWeekOfYear(date) {
const startOfYear = new Date(date.getFullYear(), 0, 1);
const diff = date - startOfYear;
const oneWeek = 1000 * 60 * 60 * 24 * 7;
const weekNumber = Math.floor(diff / oneWeek);
return weekNumber % WEEKS_PER_YEAR; // Ensure it wraps around for seasonality index
}
function escapeHtml(input) {
if (input === null || input === undefined) return '';
const str = String(input);
const map = { '&': '&', '<': '<', '>': '>', '"': '"', "'": ''' };
return str.replace(/[&<>"']/g, (match) => map[match]);
}
function showErrorMessage(message) {
console.error("Displaying error message to user:", message);
try {
const container = elements.container || document.body;
let errorDiv = container.querySelector('.app-error-message');
if (!errorDiv) {
errorDiv = document.createElement('div');
errorDiv.className = 'app-error-message';
errorDiv.style.cssText = `
position: absolute; /* Position within container */
top: 50%;
left: 50%;
transform: translate(-50%, -50%);
background-color: #f8d7da;
color: #721c24;
padding: 20px;
border-radius: 5px;
border: 1px solid #f5c6cb;
box-shadow: 0 2px 4px rgba(0,0,0,0.1);
max-width: 90%;
text-align: center;
z-index: 1000;
`;
container.appendChild(errorDiv);
}
errorDiv.innerHTML = `
<h4 style="margin-bottom:10px; color:#721c24;">发生错误</h4>
<p style="margin-bottom:15px; font-size:0.9em;">${escapeHtml(message)}</p>
<button onclick="this.parentElement.style.display='none'" style="padding: 5px 10px; background:#dc3545; color:white; border:none; border-radius:4px; cursor:pointer;">关闭</button>
`;
errorDiv.style.display = 'block';
} catch (error) {
console.error("无法显示错误消息:", error);
alert("发生严重错误,且无法显示错误提示。请检查控制台。");
}
}
// --- Start Initialization Process ---
if (document.readyState === 'complete') {
console.log("Document already complete, attempting initialization shortly.");
setTimeout(attemptInitialization, 50);
} else {
window.addEventListener('load', () => {
console.log("Window load event fired, attempting initialization shortly.");
setTimeout(attemptInitialization, 50);
});
// Fallback in case load doesn't fire or is missed
document.addEventListener('DOMContentLoaded', () => {
console.log("DOMContentLoaded event fired, attempting initialization shortly if not already done.");
setTimeout(attemptInitialization, 100);
});
}