Uniapp中自带的地图组件对支持的地图服务略有局限,同时,该组件在样式布局上层级过高且无法控制,无法满足部分高度自定义化的需求。故引入renderjs视图层工具搭配OpenLayers框架对地图功能进行实现,但由于renderjs的限制,只支持App端与H5端。
一、renderjs
renderjs是一个运行在视图层的js,可对DOM元素进行操作。它比WXS更加强大但只支持app-vue 和web(H5) 。
renderjs的主要作用有:
- 大幅降低逻辑层和视图层的通讯损耗,提供高性能视图交互能力;
- 在视图层操作dom,运行 for web 的 js库。
renderjs相关的更多信息见Uniapp官网介绍。
二、OpenLayers
OpenLayers 是一个开源的 JavaScript 库,用于在 Web 浏览器中显示和交互地图数据。它支持多种地理数据源(如 WMS、WFS、GeoJSON 等),并提供丰富的功能,如地图渲染、图层控制、坐标转换和用户交互(缩放、平移、标记等)。
主要应用场景在:
- Web GIS 系统:构建地理信息展示与分析平台。
- 数据可视化:叠加业务数据(如热力图、轨迹)。
- 自定义地图:整合第三方地图服务或离线瓦片。
OpenLayers 官网:https://openlayers.org/
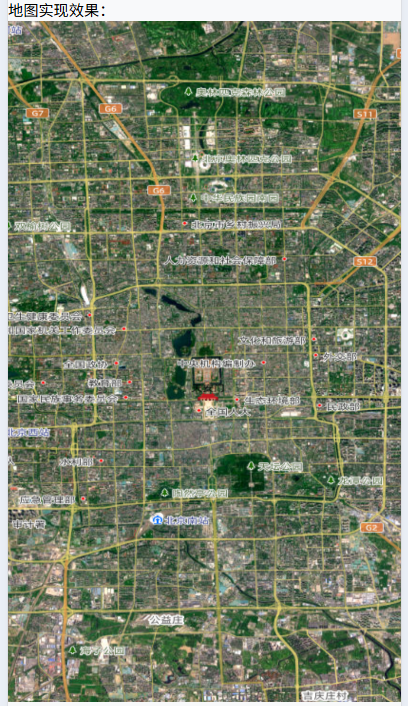
三、Uniapp展示天地图
1.依赖下载
javascript
npm install ol2.引入OpenLayers相关方法
此时,需要借助renderjs对Openlayers进行处理,另起一个script 标签<script module="ol" lang="renderjs"> ... </script>包裹相关内容。
javascript
<script module="ol" lang="renderjs">
import {
	Map,
	View
} from 'ol';
import TileLayer from 'ol/layer/Tile';
import Tile from 'ol/layer/Tile';
import VectorSource from 'ol/source/Vector';
import {
	Vector as VectorLayer,
} from 'ol/layer';
import {
	defaults as defaultControls,
} from 'ol/control';
</script>
3.初始化天地图
页面中建立一个id为map的块级元素供后续操作,其中map_page类需要设置好宽度与高度。
html
<template>
	<view>
		<view id="map" class="map_page">
		</view>
	</view>
</template>
使用renderjs操作OpenLayers对天地图进行展示。
javascript
<script module="ol" lang="renderjs">
import {
	Map,
	View
} from 'ol';
import TileLayer from 'ol/layer/Tile';
import Tile from 'ol/layer/Tile';
import VectorSource from 'ol/source/Vector';
import {
	Vector as VectorLayer,
} from 'ol/layer';
import XYZ from 'ol/source/XYZ'
import {
	defaults as defaultControls,
} from 'ol/control';

export default {
	name: 'gis-map',
	data() {
		return {
			//地图对象
			map: null,
			// 地图渲染控件
			vectorSource: null,
			vectorLayer: null,
		}
	},
	mounted() {
		this.initMap()
	},
	methods: {
		/**
		* 初始化地图
		 */
		initMap() {
			this.vectorSource = new VectorSource();
			this.vectorLayer = new VectorLayer({
				source: this.vectorSource,
			});
			// 引入天地图瓦片资源
			let source = new XYZ({
				url: 'http://t0.tianditu.gov.cn/img_w/wmts?SERVICE=WMTS&REQUEST=GetTile&VERSION=1.0.0&LAYER=img&STYLE=default&TILEMATRIXSET=w&FORMAT=tiles&TILEMATRIX={z}&TILEROW={y}&TILECOL={x}&tk=**这里用你申请的密钥**',
			})
			let tileLayer = new Tile({
				title: '天地图',
				source: source,
			})
			// 标注图层(行政区名称,道路)瓦片资源
			let sourceMark = new XYZ({
				url: "http://t0.tianditu.com/DataServer?T=cta_w&tk=**这里用你申请的密钥**&x={x}&y={y}&l={z}",
			})
			let tileMark = new Tile({
				title: '标注图层',
				source: sourceMark,
			})

			// 地铁路线图层
			// let sourceSubway = new XYZ({
			// 	url: '******'
			// })
			// let tileSubway = new Tile({
			// 	title: '地铁路线图层',
			// 	source: sourceSubway,
			// })


			// 地图实例
			this.map = new Map({
				controls: defaultControls({
					attribution: false,
					zoom: false,
					rotate: false,
				}),
				target: 'map', // 对应页面里 id 为 map 的元素
				layers: [tileLayer, tileMark], //若有其他图层如tileSubway,则可放进数组中进行初始化处理
				view: new View({
					// 地图视图
					projection: 'EPSG:4326', // 坐标系,有EPSG:4326和EPSG:3857
					center: [116.39, 39.92], // 中心坐标
					zoom: 12, // 地图缩放级别(打开页面时默认级别)
					minZoom: 1, // 地图缩放最小级别
					maxZoom: 18,
					enableRotation: false, //禁用旋转
				}),
			})
		},
	}
}
</script>
实现效果如下:
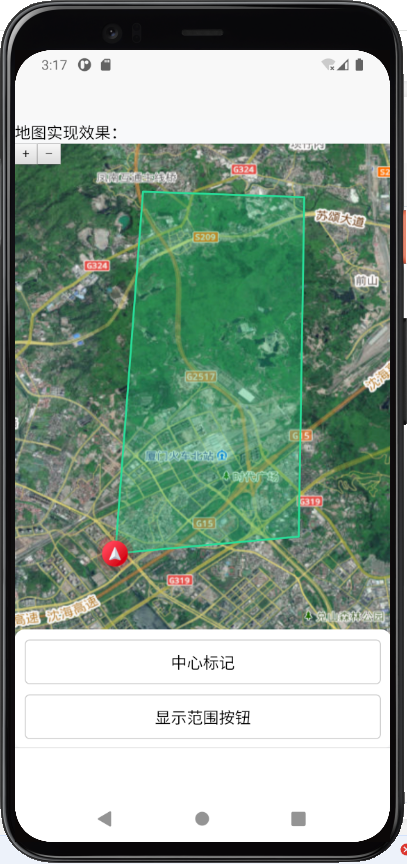
4.在地图中添加标记点与多边形
预览效果:
4.1 renderjs方法调用
4.1.1 点击调用
页面中点击按钮调用renderjs中的方法,使用ol.方法名 的方式进行调用,其中ol取标签<script module="ol" lang="renderjs">中module定义的名称,可调用的方法则需在methods: {...}内。
以示例中的按钮为例,点击按钮调用定位中心标记点: @click="ol.handleCenterIcon"。
html
<view class="btn-area_item" @click="ol.handleCenterIcon">
	中心标记
</view>
此处需要特别注意在APP端可能出现点击后调用无效的问题,主要原因可能有:
- 写法不符合"仅支持内联事件"的限制;
- 节点被其它组件(slot、v-if、自定义组件、三方组件)重新包裹,导致编译期找不到模块前缀。
其根本原因是:事件指令被编译器识别失败时,框架不会把点击消息派发到 renderjs 层。
App 端 renderjs "无法点击" 99% 都是写法或节点被转包导致编译器没有生成视图层事件绑定,只要严格遵循:行内绑定、模块前缀、裸节点,三条规则,点击事件即可在 Android、iOS 真机正常调用renderjs 里的方法。
4.1.2 监听值变化时调用
在相关块级元素的节点上绑定监听数据与监听变化的目标方法。以示例中的gps值获取为例,监听设备gps值变化并调用renderjs中的getGps()方法:
html
<view id="map" class="map_x" :style="{height:mapHeightStr}" :gps="deviceGps" :change:gps="ol.getGps">
</view>其中:gps=绑定需要监听的目标值,:change:gps=绑定监听后调用的方法。getGps()方法中则可接收新旧值,如getGps(newValue, oldValue)。
4.2 绘制标记点与多边形范围
4.2.1 绘制标记点图标
目前在renderjs中需要使用图标等图片资源时,无法直接使用图标的路径进行处理,需要将图标资源转化为base64后再引入使用,以当前处理的方式为例:在地图组件文件夹内创建一个resource.js文件,在文件中定义好图标资源的名称,如const localtion = ""data:image/png;base64,iVBORw0KG...";,最后再统一export供renderjs进行使用。
绘制图标的主要方法如下:
javascript
// 定位中心点
handleCenterIcon() {
	let vectorSource = new VectorSource();

	// 全局定义,方便后续进行其他操作,如清除等
	this.iconLayer = new VectorLayer({
		source: vectorSource,
	})

	// 添加图层
	this.map.addLayer(this.iconLayer)

	// 设置图片位置
	this.iconFeature = new Feature({
		geometry: new Point([this.gps.lng, this.gps.lat]),
	});

	// 设置图标的资源与放大倍率
	this.iconFeature.setStyle(
		new Style({
			image: new Icon({
				src: imgs.navUp,
				scale: 0.5,
			}),
		})
	);

	// 将图片Feature添加到Source
	this.iconLayer.getSource().addFeature(this.iconFeature)
}
此时,图标即可添加到地图上,但此时的图标不会随着地图的缩放而变化比例,针对实际的使用场景,需监听地图缩放,从而改变图标的显示比例。
监听地图缩放并改变图标显示比例的方法如下:
javascript
// 监听地图缩放,处理中心图标的相对大小
zoomChange() {
	let that = this
	// 监听缩放
	this.map.getView().on("change:resolution", function(res) {
		// 缩放大小
		let autoZoom = res.target.values_.zoom;
		that.realZoom = autoZoom;
		// 存在图标时,获取图标的显示倍率并按比例调整
		if (that.iconFeature) {
			let style = that.iconFeature.getStyle()
			style.getImage().setScale(autoZoom / 20);
			that.iconFeature.setStyle(style)
		}
	})
}
以上监听方法可以在地图初始化完成后进行调用。
4.2.2 绘制多边形范围
在绘制多边形时需要使用坐标数组,需根据业务实际提供的坐标,使用fromLonLat进行统一处理,并设置坐标系为EPSG:4326或EPSG:3857等其他坐标系。
js
// 循环转换坐标点
for (let i = 0; i < len; i++) {
	let point = fromLonLat([path[i].lng, path[i].lat], 'EPSG:4326')
	finalPath.push(point)
}
4326 是"经纬度(度)",3857 是"Web 墨卡托(米)";
| 坐标系 | EPSG 编码 | 单位 | 用途特点 | 天地图服务中的标识 |
|---|---|---|---|---|
| WGS84 经纬度 | EPSG:4326 | 度 | 全球通用,适合存储与计算,适合 GPS 原始坐标、OGC WFS/WMS 查询 | TILEMATRIXSET=c |
| Web 墨卡托投影 | EPSG:3857 | 米 | 网络地图通用,适合瓦片拼接、前端展示 | TILEMATRIXSET=w |
两坐标系在 OpenLayers 中的互转:
js
import {fromLonLat, toLonLat} from 'ol/proj';
// EPSG:4326 → EPSG:3857
const webMercator = fromLonLat([116.391, 39.907]);
// EPSG:3857 → EPSG:4326
const lonLat = toLonStr(webMercator);
绘制多边形范围的方法如下:
js
// 绘制任务路径范围
handlePolygon() {
	// 测试用路径
	let path = [{
			lng: 118.050,
			lat: 24.621
		},
		{
			lng: 118.083,
			lat: 24.624
		},
		{
			lng: 118.084,
			lat: 24.685
		},
		{
			lng: 118.055,
			lat: 24.686
		},
	];

	let finalPath = [];
	let len = path.length;
	// 无路径时直接返回,不渲染
	if (len == 0) {
		return false
	}

	// 循环转换坐标系
	for (let i = 0; i < len; i++) {
		let point = fromLonLat([path[i].lng, path[i].lat], 'EPSG:4326');
		finalPath.push(point);
	}

	// 配置多边形
	let polygon = new Polygon([finalPath]);
	let polygonFeature = new Feature({
		geometry: polygon,
	});
	let source = new VectorSource({
		features: [polygonFeature]
	});
	// 配置多边形样式
	let geoLayer = new VectorLayer({
		source: source,
		style: new Style({
			stroke: new Stroke({
				color: '#28dd98',
				width: 2
			}),// 描边
			fill: new Fill({
				color: '#25C67A50',
			})//填充范围颜色
		})
	});
	this.geoLayerValue = geoLayer;
	this.map.addLayer(geoLayer);
}
4.3完整示例
js
<template>
	<view>
		<view id="map" class="map_x" :style="{height:mapHeightStr}" :gps="deviceGps" :change:gps="ol.getGps">
		</view>
		<view class="btn-area">
			<view class="btn-area_item" @click="ol.handleCenterIcon">
				中心标记
			</view>
			<view class="btn-area_item" @click="ol.handlePolygon">
				显示范围按钮
			</view>
		</view>
	</view>
</template>

<script>
	export default {
		props: {
			mapHeight: {
				type: [Number, String],
				default: 220
			}
		},
		data() {
			return {
				deviceGps: null
			}
		},
		computed: {
			mapHeightStr() {
				function isNumber(val) {
					return typeof val === 'number' && Number.isFinite(val);
				}
				if (isNumber(this.mapHeight)) {
					return this.mapHeight + 'px'
				} else {
					return this.mapHeight
				}
			}
		},
		mounted() {
			this.getDeviceGps()
		},
		methods: {
			// 获取手机当前定位
			getDeviceGps(isShowTip = false) {
				let that = this
				if (isShowTip) {
					wx.showLoading({
						title: '获取当前定位中...'
					})
				}
				try {
					uni.getLocation({
						type: 'wgs84',
						geocode: true, //设置该参数为true可直接获取经纬度及城市信息
						success: function(res) {
							wx.hideLoading()
							// 此时先赋值时间戳,强制使坐标发生改变,从而触发监听方法
							that.deviceGps = {
								lng: new Date().getTime(),
								lat: new Date().getTime()
							}
							// 模拟中点坐标
							let gps = {
								lat: 24.621, // res.latitude,
								lng: 118.050 //res.longitude
							}
							that.deviceGps = gps
							that.$emit("initGps", gps)
						},
						fail: function() {
							wx.hideLoading()
							uni.showToast({
								title: '获取地址失败,将导致部分功能不可用',
								icon: 'none'
							});
						}
					});
				} catch (err) {
					wx.hideLoading()
				}
			},
		}
	}
</script>
<script module="ol" lang="renderjs">
	import {
		imgs
	} from "./resource.js"
	import {
		Map,
		View
	} from 'ol';
	import TileLayer from 'ol/layer/Tile';
	import Tile from 'ol/layer/Tile';
	import VectorSource from 'ol/source/Vector';
	import {
		Vector as VectorLayer,
	} from 'ol/layer';
	import XYZ from 'ol/source/XYZ'
	import {
		defaults as defaultControls,
	} from 'ol/control';

	// 转化经纬度
	import {
		transform,
		fromLonLat
	} from 'ol/proj';

	// 绘制形状
	import {
		LineString,
		Point,
		Polygon,
		Circle as CircleGeo
	} from 'ol/geom';
	import Feature from 'ol/Feature';
	import {
		Fill,
		Stroke,
		Style,
		Icon,
		Circle,
		Text
	} from 'ol/style'

	export default {
		name: 'gis-map',
		data() {
			return {
				map: null, //地图对象
				gps: null, //当前定位
				// 地图渲染控件
				vectorSource: null,
				vectorLayer: null,
				iconLayer: null,
				geoLayerValue: null

			}
		},
		mounted() {
			this.initMap()
		},
		methods: {
			/**
			 * 初始化地图
			 */
			initMap() {
				this.vectorSource = new VectorSource();
				this.vectorLayer = new VectorLayer({
					source: this.vectorSource,
				});
				// 引入天地图
				let source = new XYZ({
					url: '***你的天地图资源地址***',
				})
				let tileLayer = new Tile({
					title: '天地图',
					source: source,
				})
				// 标注图层(行政区名称,道路)
				let sourceMark = new XYZ({
					url: '***你的天地图资源地址***',
				})
				let tileMark = new Tile({
					title: '标注图层',
					source: sourceMark,
				})

				// 地图实例
				this.map = new Map({
					controls: defaultControls({
						attribution: false,
						zoom: true,
						rotate: false,
					}),
					target: 'map', // 对应页面里 id 为 map 的元素
					layers: [tileLayer, tileMark],
					view: new View({
						// 地图视图
						projection: 'EPSG:4326', // 坐标系,有EPSG:4326和EPSG:3857
						center: [118.050, 24.621], // 中心坐标
						zoom: 12, // 地图缩放级别(打开页面时默认级别)
						minZoom: 1, // 地图缩放最小级别
						maxZoom: 18,
						enableRotation: false, //禁用旋转
					}),
				})

				// 启动地图缩放监听
				this.zoomChange()
			},
			// 调整中心点
			changeMapCenter(gps, zoom = 12) {
				if (this.map) {
					let view = this.map.getView();
					view.setZoom(zoom);
					view.setCenter([gps.lng, gps.lat],
						"EPSG:4326");
					this.map.render();
				}
			},
			// 接收GPS数据
			getGps(newValue, oldValue) {
				console.log("接收GPS数据", newValue);
				if (newValue != undefined) {
					this.gps = newValue
					if (this.map) {
						this.changeMapCenter(this.gps, 15)
					} else {
						this.initMap()
					}
				}
			},

			// 绘制中心点图标
			handleCenterIcon() {
				if (this.iconLayer) {
					// 移除图层
					this.map.removeLayer(this.iconLayer)
					this.iconLayer = null
				}
				let vectorSource = new VectorSource();
				this.iconLayer = new VectorLayer({
					source: vectorSource,
				})
				// 添加图层
				this.map.addLayer(this.iconLayer)
				// 设置图片位置
				this.iconFeature = new Feature({
					geometry: new Point([this.gps.lng, this.gps.lat]),
				});
				this.iconFeature.setStyle(
					new Style({
						image: new Icon({
							src: imgs.navUp,
							scale: 0.5,
						}),
					})
				);
				// 将图片Feature添加到Source
				this.iconLayer.getSource().addFeature(this.iconFeature)
			},

			// 监听地图缩放,处理中心图标的相对大小
			zoomChange() {
				let that = this
				this.map.getView().on("change:resolution", function(res) {
					let autoZoom = res.target.values_.zoom;
					that.realZoom = autoZoom;
					// console.log("缩放事件", autoZoom, that.pointIconList);
					if (that.iconFeature) {
						let style = that.iconFeature.getStyle()
						style.getImage().setScale(autoZoom / 20);
						that.iconFeature.setStyle(style)
					}
				})
			},

			// 绘制任务路径范围
			handlePolygon() {
				if (this.geoLayerValue) {
					this.map.removeLayer(this.geoLayerValue);
					this.geoLayerValue = null;
				}

				let path = [{
						lng: 118.050,
						lat: 24.621
					},
					{
						lng: 118.083,
						lat: 24.624
					},
					{
						lng: 118.084,
						lat: 24.685
					},
					{
						lng: 118.055,
						lat: 24.686
					},
				];
				let finalPath = [];
				let len = path.length;
				if (len == 0) {
					return false
				}

				// 循环转换坐标系
				for (let i = 0; i < len; i++) {
					let point = fromLonLat([path[i].lng, path[i].lat], 'EPSG:4326');
					finalPath.push(point);
				}

				// 配置多边形
				let polygon = new Polygon([finalPath]);
				let polygonFeature = new Feature({
					geometry: polygon,
				});

				let source = new VectorSource({
					features: [polygonFeature]
				})

				let geoLayer = new VectorLayer({
					source: source,
					style: new Style({
						stroke: new Stroke({
							color: '#28dd98',
							width: 2
						}),
						fill: new Fill({
							color: '#25C67A50',
						})
					})
				})

				this.geoLayerValue = geoLayer;
				this.map.addLayer(geoLayer);
			},
		}
	}
</script>
5.其他地图操作方法
在Uniapp环境中,OpenLayers的操作与在Web端中的使用方法基本一致,在此不再赘述,可参考文章OpenLayers学习记录或OpenLayers 官网。
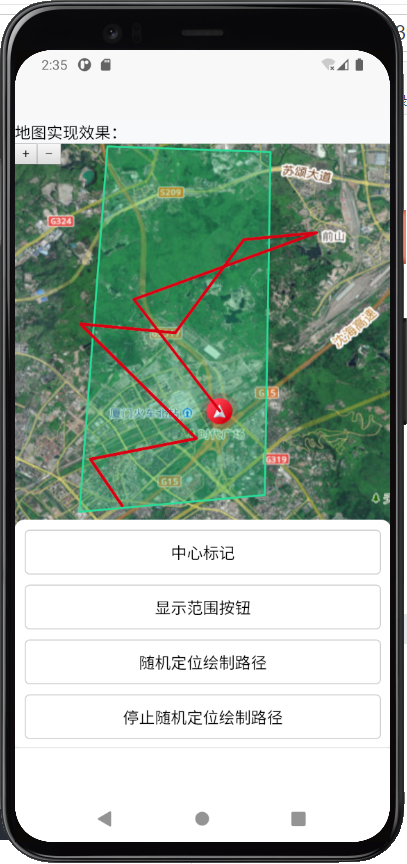
四、设备定位轨迹处理
在实际应用场景中,根据设备的实时位置绘制轨迹路线也较为常见,但由于renderjs的限制,以下仅仅介绍App端与H5端可实现的方案。
预览效果:
1.设备定位监听方法
在App端,可使用plus.geolocation.watchPosition(successCB, errorCB, option)方法对设备定位进行定时查询。
js
const watchPosition = plus.geolocation.watchPosition(function(pos) {
	console.log("==当前定位数据==", JSON.stringify(pos.coords));
	// 获取当前定位的同时,更新中心点位置与方向
	console.log("==当前方向==", pos.coords.heading);
	console.log("==当前经纬度==", pos.coords.longitude, pos.coords.latitude);
}, function(error) {
	console.error(`地理信息报错ERROR: ${error.message}`);
}, {
	enableHighAccuracy: true,
	timeout: 20000,
	maximumAge: 10000
});
其中返回的pos对象数据有:
| 属性 | 描述 |
|---|---|
| coords.latitude | 十进制数的纬度 |
| coords.longitude | 十进制数的经度 |
| coords.accuracy | 位置精度 |
| coords.altitude | 海拔,海平面以上以米计 |
| coords.altitudeAccuracy | 位置的海拔精度 |
| coords.heading | 方向,从正北开始以度计 |
| coords.speed | 速度,以米/每秒计 |
| timestamp | 响应的日期/时间 |
其中option可配置的参数有:
| 属性 | 描述 |
|---|---|
| enableHighAccuracy | 是否使用其最高精度:1. false,默认值,设备会通过更快响应、更少的电量等方法来尽可能的节约资源t;2.true,这会导致较慢的响应时间或者增加电量消耗(比如对于支持 gps 的移动设备来说) |
| timeout | 限制返回时间 |
| maximumAge | 可以返回多长时间(单位毫秒)内的缓存位置 |
在H5端上,也可以使用navigator.geolocation.watchPosition(success, error, options)方法,其返回参数与配置参数同上。
2.绘制轨迹方法
使用LineString()传入轨迹数组(格式为:\[经度,纬度,经度,纬度...])进行处理。
js
handleAddPath() {
	let line = [[118.05, 24.63],[118.050, 24.64],[118.05, 24.65]];
	let lineString = new LineString(line);
	let pathFeature = new Feature(lineString);
	const source = new VectorSource({
		features: [pathFeature]
	})

	// 创建路径实例
	this.pathLayer = new VectorLayer({
		source: source,
		style: new Style({
			fill: new Fill({ //填充路径颜色
				color: 'rgba(255,255,255,0.5)'
			}),
			stroke: new Stroke({
				color: '#d70f19',
				width: 3
			})
		})
	})
	this.map.addLayer(this.pathLayer)
	console.log("路径渲染完成", this.distance);
},
3.轨迹路径长度计算
使用2.绘制轨迹方法 中的lineString 进行计算。
js
handlePathLength(lineString) {
	let length = lineString.getLength({
		projection: 'EPSG:4326' // 确定坐标系类型
	})
	let output = ''
	output = Math.round(length * 1000) / 10 //km 保留一位小数
	console.log("路径距离", output);
	return output
}
4.监听陀螺仪判断设备指北方向
下载依赖
js
npm i kompas创建Kompas实例后监听方向,并设置箭头图标的方向:
js
// 陀螺仪变化监听,改变中心箭头方向
const compass = new Kompas();
compass.watch();
compass.on('heading', function(heading) {
	console.log("陀螺仪变化", heading);
	let style = that.iconFeature.getStyle()
	style.getImage().setRotation(Math.PI / 180 * heading);
	that.iconFeature.setStyle(style)
});
上述方法非主流设备监听方法,可能存在问题,需谨慎使用。欢迎大佬们指正!也欢迎讨论相关可行的解决方案!
5.完整示例
js
<template>
	<view>
		<view id="map" class="map_x" :style="{height:mapHeightStr}" :gps="deviceGps" :change:gps="ol.getGps">
		</view>
		<view class="btn-area">
			<view class="btn-area_item" @click="ol.handleCenterIcon">
				中心标记
			</view>
			<view class="btn-area_item" @click="ol.handlePolygon">
				显示范围按钮
			</view>
			<view class="btn-area_item" @click="ol.handleStart">
				随机定位绘制路径
			</view>
			<view class="btn-area_item" @click="ol.handleStop">
				停止随机定位绘制路径
			</view>
		</view>
	</view>
</template>

<script>
	export default {
		props: {
			mapHeight: {
				type: [Number, String],
				default: 220
			},
			// 地图多边形路径
			mapPathLatLan: {
				type: Array,
				default: () => {
					return []
				}
			},
			// 点坐标
			pointLatLng: {
				type: Array,
				default: () => {
					return []
				}
			},
		},
		data() {
			return {
				deviceGps: null
			}
		},
		computed: {
			mapHeightStr() {
				function isNumber(val) {
					return typeof val === 'number' && Number.isFinite(val);
				}
				if (isNumber(this.mapHeight)) {
					return this.mapHeight + 'px'
				} else {
					return this.mapHeight
				}
			}
		},
		mounted() {
			this.getDeviceGps()
		},
		methods: {
			// 获取手机当前定位
			getDeviceGps(isShowTip = false) {
				let that = this
				if (isShowTip) {
					wx.showLoading({
						title: '获取当前定位中...'
					})
				}
				try {
					uni.getLocation({
						type: 'wgs84',
						geocode: true, //设置该参数为true可直接获取经纬度及城市信息
						success: function(res) {
							wx.hideLoading()
							that.deviceGps = {
								lng: new Date().getTime(),
								lat: new Date().getTime()
							}
							let gps = {
								lat:  res.latitude,
								lng: res.longitude
							}
							that.deviceGps = gps
							that.$emit("initGps", gps)
						},
						fail: function() {
							wx.hideLoading()
							uni.showToast({
								title: '获取地址失败,将导致部分功能不可用',
								icon: 'none'
							});
						}
					});
				} catch (err) {
					wx.hideLoading()
				}
			},
			emitDistance(distance) {
				this.$emit("changeDistance", distance)
			},
			showToast(title) {
				uni.showToast({
					icon: 'none',
					title: title
				})
			},
		}
	}
</script>
<script module="ol" lang="renderjs">
	import {
		imgs
	} from "./resource.js"
	import {
		Map,
		View
	} from 'ol';
	import TileLayer from 'ol/layer/Tile';
	import Tile from 'ol/layer/Tile';
	import VectorSource from 'ol/source/Vector';
	import {
		Vector as VectorLayer,
	} from 'ol/layer';
	import XYZ from 'ol/source/XYZ'
	import {
		defaults as defaultControls,
	} from 'ol/control';

	// 转化经纬度
	import {
		transform,
		fromLonLat
	} from 'ol/proj';

	// 绘制形状
	import {
		LineString,
		Point,
		Polygon,
		Circle as CircleGeo
	} from 'ol/geom';
	import Feature from 'ol/Feature';
	import {
		Fill,
		Stroke,
		Style,
		Icon,
		Circle,
		Text
	} from 'ol/style';
	import Kompas from 'kompas';

	export default {
		name: 'gis-map',
		data() {
			return {
				map: null, //地图对象
				gps: null, //当前定位,
				// 巡检线条路径
				patrolPath: [],
				// 巡检距离
				distance: 0,

				// 地图渲染控件
				vectorSource: null,
				vectorLayer: null,

				iconLayer: null,
				iconFeature: null,
				geoLayerValue: null,

				// 监听方法
				watchPosition: null,
			}
		},
		mounted() {
				this.initMap()
		},
		methods: {
			/**
			 * 初始化地图
			 */
			initMap() {
				this.vectorSource = new VectorSource();
				this.vectorLayer = new VectorLayer({
					source: this.vectorSource,
				});

				// 引入天地图
				let source = new XYZ({
					url: '***你的天地图资源地址***',
				})
				let tileLayer = new Tile({
					title: '天地图',
					source: source,
				})
				// 标注图层(行政区名称,道路)
				let sourceMark = new XYZ({
					url:  '***你的天地图资源地址***',
				})
				let tileMark = new Tile({
					title: '标注图层',
					source: sourceMark,
				})

				// 地图实例
				this.map = new Map({
					controls: defaultControls({
						attribution: false,
						zoom: true,
						rotate: false,
					}),
					target: 'map', // 对应页面里 id 为 map 的元素
					layers: [tileLayer, tileMark], //tileSubway
					view: new View({
						// 地图视图
						projection: 'EPSG:4326', // 坐标系,有EPSG:4326和EPSG:3857
						center: [118.050, 24.621], // 中心坐标
						zoom: 12, // 地图缩放级别(打开页面时默认级别)
						minZoom: 1, // 地图缩放最小级别
						maxZoom: 18,
						enableRotation: false, //禁用旋转
					}),
				})
				// 启动地图缩放监听
				this.zoomChange();
			},
			// 调整中心点
			changeMapCenter(gps, zoom = 12) {
				if (this.map) {
					let view = this.map.getView();
					view.setZoom(zoom);
					view.setCenter([gps.lng, gps.lat],
						"EPSG:4326");
					this.map.render();
				}
			},
			// 接收GPS数据
			getGps(newValue, oldValue) {
				console.log("接收GPS数据", newValue);
				if (newValue != undefined) {
					this.gps = newValue
					if (this.map) {
						this.changeMapCenter(this.gps, 15)
					} else {
						this.initMap()
					}
				}
			},
			// 定位中心点
			handleCenterIcon() {
				this.removeIcon()
				let vectorSource = new VectorSource();
				this.iconLayer = new VectorLayer({
					source: vectorSource,
				})
				// 添加图层
				this.map.addLayer(this.iconLayer)
				// 设置图片位置
				// #ifdef APP
				this.iconFeature = new Feature({
					geometry: new Point([this.gps.lng, this.gps.lat]),
				});
				// #endif
				// H5端测试使用,实际生产环境与APP相同
				// #ifdef H5
				this.iconFeature = new Feature({
					geometry: new Point([118.050, 24.621]),
				});
				// #endif
				this.iconFeature.setStyle(
					new Style({
						image: new Icon({
							src: imgs.navUp,
							scale: 0.5,
						}),
					})
				);
				// 将图片Feature添加到Source
				this.iconLayer.getSource().addFeature(this.iconFeature)
			},
			// 移除图标
			removeIcon() {
				if (this.iconLayer) {
					// 移除图层
					this.map.removeLayer(this.iconLayer)
					this.iconLayer = null
				}
			},
			// 监听地图缩放,处理中心图标的相对大小
			zoomChange() {
				let that = this
				this.map.getView().on("change:resolution", function(res) {
					let autoZoom = res.target.values_.zoom;
					that.realZoom = autoZoom;
					// console.log("缩放事件", autoZoom, that.pointIconList);
					if (that.iconFeature) {
						let style = that.iconFeature.getStyle()
						style.getImage().setScale(autoZoom / 20);
						that.iconFeature.setStyle(style)
					}
				})
			},

			// 绘制任务路径范围
			handlePolygon() {
				if (this.geoLayerValue) {
					this.map.removeLayer(this.geoLayerValue);
				}
				let path = [{
						lng: 118.050,
						lat: 24.621
					},
					{
						lng: 118.083,
						lat: 24.624
					},
					{
						lng: 118.084,
						lat: 24.685
					},
					{
						lng: 118.055,
						lat: 24.686
					},
				];
				let finalPath = [];
				let len = path.length;
				if (len == 0) {
					return false
				}

				// 循环转换坐标点
				for (let i = 0; i < len; i++) {
					let point = fromLonLat([path[i].lng, path[i].lat], 'EPSG:4326');
					finalPath.push(point);
				}
				// 配置多边形
				let polygon = new Polygon([finalPath]);
				let polygonFeature = new Feature({
					geometry: polygon,
				});

				let source = new VectorSource({
					features: [polygonFeature]
				})

				let geoLayer = new VectorLayer({
					source: source,
					style: new Style({
						stroke: new Stroke({
							color: '#28dd98',
							width: 2
						}),
						fill: new Fill({
							color: '#25C67A50',
						})
					})
				})

				this.geoLayerValue = geoLayer;
				this.map.addLayer(geoLayer);
			},

			// 时间开始/暂停/结束
			handleStart() {
				console.log("开始绘制路径")
				if (this.iconFeature) {
					// H5端测试使用
					// #ifdef H5
					// 存储定位数据
					this.patrolPath.unshift([118.050, 24.621]);
					// #endif
					this.handleCenterPoint()
				} else {
					this.$ownerInstance.callMethod('showToast', '请先点击中心标记');
				}
			},
			handleStop() {
				console.log("停止绘制路径")
				// #ifdef APP
				plus.geolocation.clearWatch(this.watchPosition)
				// #endif
				// 测试用,清除随机模拟定时器
				clearInterval(this.watchPosition)
				this.watchPosition = null
			},

			// 间隔10秒监听定位路径变化
			handleCenterPoint() {
				let that = this;

				let step = 0.01;
				// 模拟定位路径变化
				this.watchPosition = setInterval(() => {
					const coords = [118.050 + step * Math.random(), 24.621 + step * Math.random()];
					step = step + 0.01;
					console.log("==当前定位==", coords[0], coords[1]);
					this.changeMapCenter({
						lng: coords[0],
						lat: coords[1]
					}, 15)

					// 动态改变当前定位图标
					let newGeometry = new Point(coords);
					that.iconFeature.setGeometry(newGeometry)

					that.$ownerInstance.callMethod('emitPath', coords);
					// 存储定位数据
					that.patrolPath.unshift(coords);
					// 画路径
					that.handleAddPath()

				}, 1000 * 10)

				return false
				// --------------------------------------------
				// 实际生产环境使用,以下需要真机执行
				const source = new VectorSource();
				this.watchPosition = plus.geolocation.watchPosition(function(pos) {
					console.log("==当前定位数据==", JSON.stringify(pos.coords));
					// 获取当前定位的同时,更新中心点位置与方向
					if (pos.coords.heading) {
						let style = that.iconFeature.getStyle()
						style.getImage().setRotation(Math.PI / 180 * (pos.coords.heading || 1));
						that.iconFeature.setStyle(style)
					}

					const coords = [pos.coords.longitude, pos.coords.latitude];
					// 动态改变当前定位图标
					let newGeometry = new Point(coords);
					that.iconFeature.setGeometry(newGeometry)

					// 存储定位数据
					that.patrolPath.unshift(coords);
					// 绘制路径
					that.handleAddPath()
				}, function(error) {
					console.error(`地理信息报错ERROR: ${error.message}`);
					uni.showToast({
						icon: 'none',
						title: "定位数据获取异常,将自动重试中"
					})
					plus.geolocation.clearWatch(that.watchPosition)
					setTimeout(() => {
						that.handleCenterPoint()
					}, 1500);
				}, {
					enableHighAccuracy: true,
					timeout: 20000,
					maximumAge: 10000
				});

				// 陀螺仪变化监听,改变中心箭头方向
				const compass = new Kompas();
				compass.watch();
				compass.on('heading', function(heading) {
					console.log("陀螺仪变化", heading);
					let style = that.iconFeature.getStyle()
					style.getImage().setRotation(Math.PI / 180 * heading);
					that.iconFeature.setStyle(style)
				});
			},
			// 绘制路径
			handleAddPath() {
				let line = this.patrolPath;
				let lineString = new LineString(line);
				let pathFeature = new Feature(lineString);
				const source = new VectorSource({
					features: [pathFeature]
				})
				this.pathLayer = new VectorLayer({
					source: source,
					style: new Style({
						fill: new Fill({ //填充
							color: 'rgba(255,255,255,0.5)'
						}),
						stroke: new Stroke({
							color: '#d70f19',
							width: 3
						})
					})
				})
				this.map.addLayer(this.pathLayer)
				console.log("路径渲染完成", this.distance);

				// 计算距离并抛出到父组件
				this.distance = this.handlePathLength(lineString);
				this.$ownerInstance.callMethod('emitDistance', this.distance);
			},
			// 计算长度
			handlePathLength(line) {
				let length = line.getLength({
					projection: 'EPSG:4326'
				})
				let output = ''
				output = Math.round(length * 1000) / 10 + ' '
				return output
			}
		}
	}
</script>