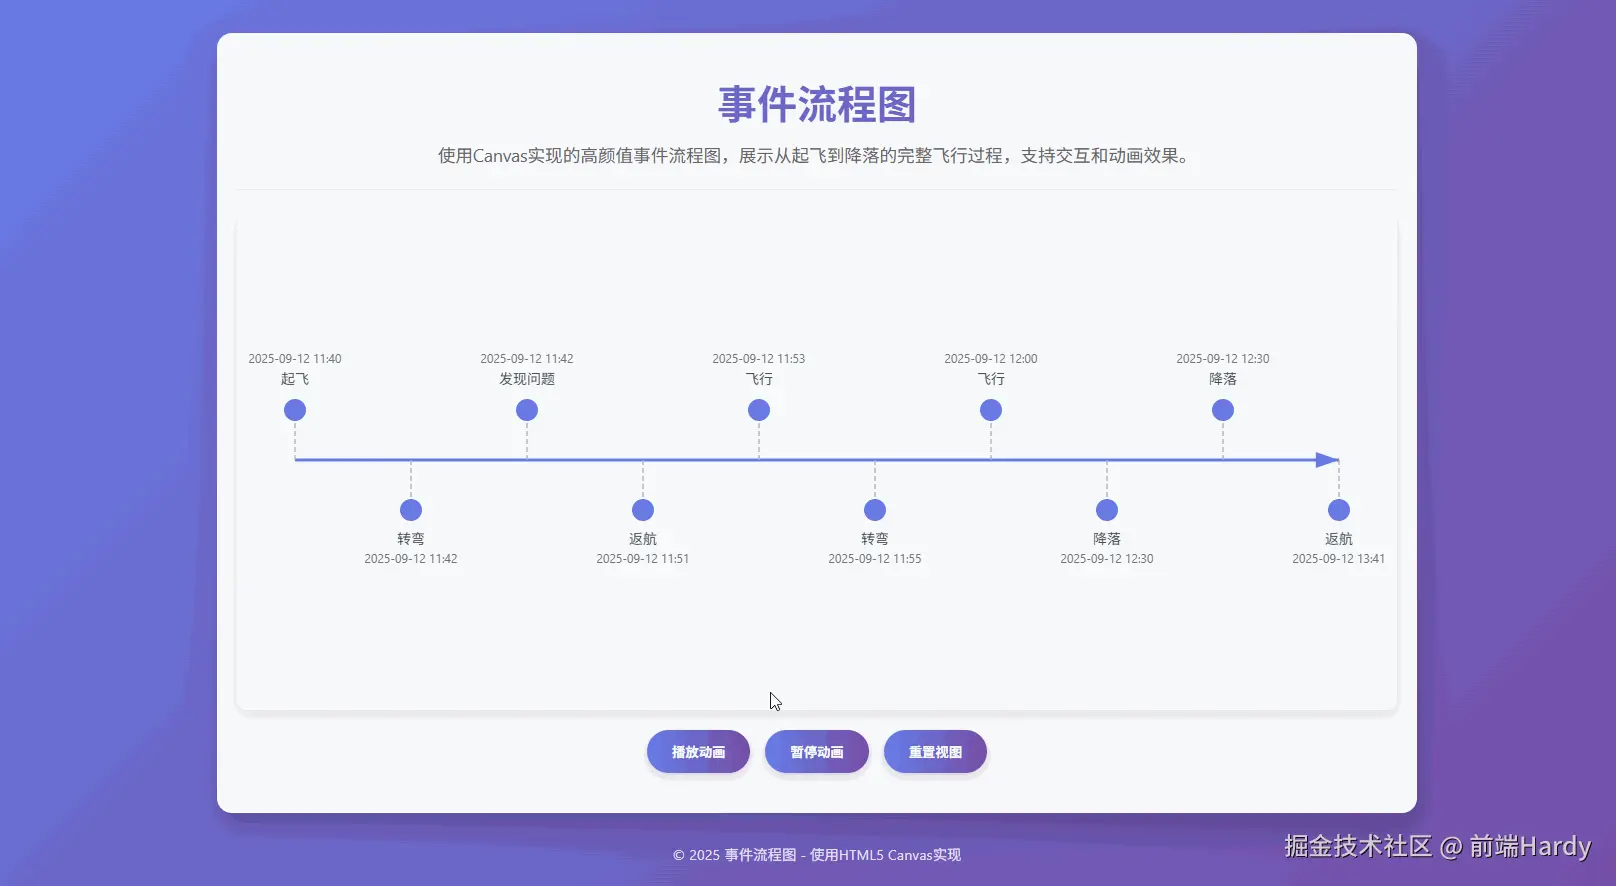
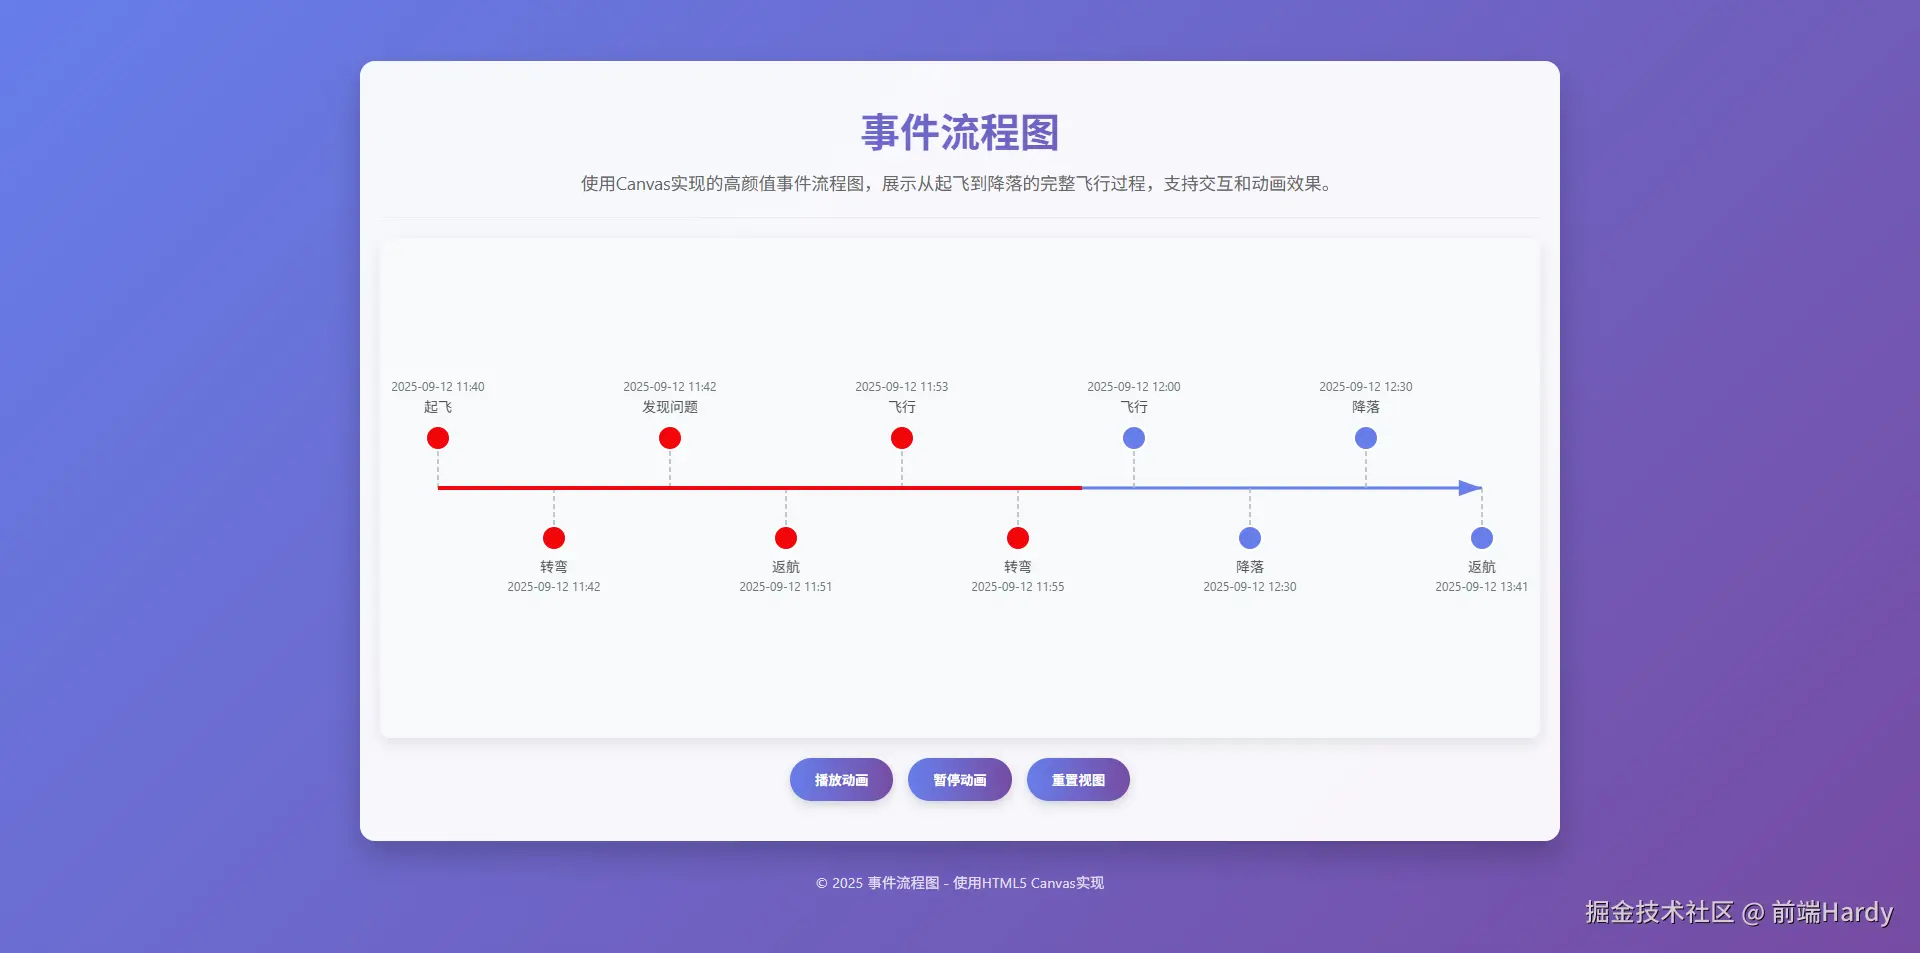
HTML5 Canvas 绘制一个高颜值、支持交互的事件流程图,展示从起飞 到降落的完整飞行事件时间线,包含播放 / 暂停 / 重置动画控制功能。
大家复制代码时,可能会因格式转换出现错乱,导致样式失效。建议先少量复制代码进行测试,若未能解决问题,私信回复源码两字,我会发送完整的压缩包给你。
演示效果
HTML&CSS
html
<!DOCTYPE html>
<html lang="zh-CN">

<head>
    <meta charset="UTF-8">
    <meta name="viewport" content="width=device-width, initial-scale=1.0">
    <title>Canvas事件流程图</title>
    <style>
        * {
            margin: 0;
            padding: 0;
            box-sizing: border-box;
            font-family: 'Segoe UI', Tahoma, Geneva, Verdana, sans-serif;
        }

        body {
            display: flex;
            flex-direction: column;
            align-items: center;
            justify-content: center;
            min-height: 100vh;
            background: linear-gradient(135deg, #667eea 0%, #764ba2 100%);
            padding: 20px;
            color: #333;
        }

        .container {
            width: 100%;
            max-width: 1200px;
            background-color: rgba(255, 255, 255, 0.95);
            border-radius: 15px;
            box-shadow: 0 15px 30px rgba(0, 0, 0, 0.2);
            overflow: hidden;
            padding: 20px;
        }

        header {
            text-align: center;
            padding: 20px 0;
            margin-bottom: 20px;
            border-bottom: 1px solid #eee;
        }

        h1 {
            font-size: 2.5rem;
            color: #4a4a4a;
            margin-bottom: 10px;
            background: linear-gradient(to right, #667eea, #764ba2);
            -webkit-background-clip: text;
            -webkit-text-fill-color: transparent;
        }

        .description {
            color: #666;
            font-size: 1.1rem;
            max-width: 800px;
            margin: 0 auto;
            line-height: 1.6;
        }

        .canvas-container {
            position: relative;
            width: 100%;
            height: 500px;
            margin: 20px 0;
            border-radius: 10px;
            overflow: hidden;
            background-color: #f8f9fa;
            box-shadow: 0 5px 15px rgba(0, 0, 0, 0.1);
        }

        canvas {
            display: block;
            width: 100%;
            height: 100%;
        }

        .controls {
            display: flex;
            justify-content: center;
            gap: 15px;
            margin: 20px 0;
            flex-wrap: wrap;
        }

        button {
            padding: 12px 25px;
            border: none;
            border-radius: 50px;
            background: linear-gradient(to right, #667eea, #764ba2);
            color: white;
            font-weight: 600;
            cursor: pointer;
            transition: all 0.3s ease;
            box-shadow: 0 4px 10px rgba(0, 0, 0, 0.15);
        }

        button:hover {
            transform: translateY(-3px);
            box-shadow: 0 7px 15px rgba(0, 0, 0, 0.2);
        }

        button:active {
            transform: translateY(0);
        }

        footer {
            text-align: center;
            margin-top: 30px;
            color: rgba(255, 255, 255, 0.8);
            font-size: 0.9rem;
        }

        @media (max-width: 768px) {
            h1 {
                font-size: 2rem;
            }

            .canvas-container {
                height: 400px;
            }

            .event-list {
                grid-template-columns: 1fr;
            }
        }
    </style>
</head>

<body>
    <div class="container">
        <header>
            <h1>事件流程图</h1>
            <p class="description">使用Canvas实现的高颜值事件流程图,展示从起飞到降落的完整飞行过程,支持交互和动画效果。</p>
        </header>

        <div class="canvas-container">
            <canvas id="flowchartCanvas"></canvas>
        </div>

        <div class="controls">
            <button id="playBtn">播放动画</button>
            <button id="pauseBtn">暂停动画</button>
            <button id="resetBtn">重置视图</button>
        </div>
    </div>

    <footer>
        <p>© 2025 事件流程图 - 使用HTML5 Canvas实现</p>
    </footer>

    <script>
        document.addEventListener('DOMContentLoaded', function () {
            const canvas = document.getElementById('flowchartCanvas');
            const ctx = canvas.getContext('2d');
            const playBtn = document.getElementById('playBtn');
            const pauseBtn = document.getElementById('pauseBtn');
            const resetBtn = document.getElementById('resetBtn');

            // 设置Canvas尺寸
            function resizeCanvas() {
                canvas.width = canvas.offsetWidth;
                canvas.height = canvas.offsetHeight;
                drawFlowchart();
            }

            // 初始化事件数据
            const events = [
                { time: '2025-09-12 11:40', event: '起飞', position: 0.05 },
                { time: '2025-09-12 11:42', event: '转弯', position: 0.15 },
                { time: '2025-09-12 11:42', event: '发现问题', position: 0.25 },
                { time: '2025-09-12 11:51', event: '返航', position: 0.35 },
                { time: '2025-09-12 11:53', event: '飞行', position: 0.45 },
                { time: '2025-09-12 11:55', event: '转弯', position: 0.55 },
                { time: '2025-09-12 12:00', event: '飞行', position: 0.65 },
                { time: '2025-09-12 12:30', event: '降落', position: 0.75 },
                { time: '2025-09-12 12:30', event: '降落', position: 0.85 },
                { time: '2025-09-12 13:41', event: '返航', position: 0.95 }
            ];

            // 动画状态
            let animationProgress = 0;
            let animationId = null;
            let isAnimating = false;

            // 绘制流程图
            function drawFlowchart() {
                const width = canvas.width;
                const height = canvas.height;
                const timelineY = height / 2;
                const nodeRadius = 12;

                // 清除画布
                ctx.clearRect(0, 0, width, height);

                // 绘制时间轴
                ctx.beginPath();
                ctx.moveTo(width * 0.05, timelineY);
                ctx.lineTo(width * 0.95, timelineY);
                ctx.strokeStyle = '#667eea';
                ctx.lineWidth = 3;
                ctx.stroke();

                // 绘制箭头
                ctx.beginPath();
                ctx.moveTo(width * 0.95, timelineY);
                ctx.lineTo(width * 0.93, timelineY - 8);
                ctx.lineTo(width * 0.93, timelineY + 8);
                ctx.closePath();
                ctx.fillStyle = '#667eea';
                ctx.fill();

                // 绘制事件节点和标签
                events.forEach((ev, index) => {
                    const x = width * ev.position;
                    const isEven = index % 2 === 0;
                    const nodeY = isEven ? timelineY - 50 : timelineY + 50;

                    // 绘制连接线
                    ctx.beginPath();
                    ctx.moveTo(x, timelineY);
                    ctx.lineTo(x, nodeY);
                    ctx.strokeStyle = '#adb5bd';
                    ctx.lineWidth = 1.5;
                    ctx.setLineDash([5, 3]);
                    ctx.stroke();
                    ctx.setLineDash([]);

                    // 绘制节点
                    ctx.beginPath();
                    ctx.arc(x, nodeY, nodeRadius, 0, Math.PI * 2);
                    ctx.fillStyle = isAnimating && animationProgress >= ev.position ?
                        '#F2050A' : '#667eea';
                    ctx.fill();
                    ctx.strokeStyle = 'white';
                    ctx.lineWidth = 2;
                    ctx.stroke();

                    // 绘制事件文本
                    ctx.font = '14px Segoe UI, sans-serif';
                    ctx.textAlign = 'center';
                    ctx.textBaseline = 'middle';
                    ctx.fillStyle = '#495057';
                    ctx.fillText(ev.event, x, nodeY + (isEven ? -30 : 30));

                    // 绘制时间文本
                    ctx.font = '12px Segoe UI, sans-serif';
                    ctx.fillStyle = '#6c757d';
                    ctx.fillText(ev.time, x, nodeY + (isEven ? -50 : 50));
                });

                // 绘制动画进度
                if (isAnimating) {
                    ctx.beginPath();
                    ctx.moveTo(width * 0.05, timelineY);
                    ctx.lineTo(width * animationProgress, timelineY);
                    ctx.strokeStyle = '#F2050A';
                    ctx.lineWidth = 4;
                    ctx.stroke();
                }
            }

            // 动画函数
            function animate() {
                if (animationProgress < 0.95) {
                    animationProgress += 0.005;
                    drawFlowchart();
                    animationId = requestAnimationFrame(animate);
                } else {
                    isAnimating = false;
                }
            }

            // 事件监听器
            playBtn.addEventListener('click', function () {
                if (!isAnimating) {
                    isAnimating = true;
                    animate();
                }
            });

            pauseBtn.addEventListener('click', function () {
                if (isAnimating) {
                    cancelAnimationFrame(animationId);
                    isAnimating = false;
                }
            });

            resetBtn.addEventListener('click', function () {
                if (isAnimating) {
                    cancelAnimationFrame(animationId);
                    isAnimating = false;
                }
                animationProgress = 0;
                drawFlowchart();
            });

            // 初始化和响应式调整
            window.addEventListener('resize', resizeCanvas);
            resizeCanvas();

            // 初始绘制
            drawFlowchart();
        });
    </script>
</body>

</html>
HTML
- container:包裹所有内容的核心容器,用于统一控制页面布局与背景
- header:包含页面标题与描述,用于引导用户理解页面功能
- h1:页面主标题,视觉焦点之一
- description:说明页面用途(飞行过程事件流展示),提升用户体验
- canvas-container:包裹 Canvas 标签,用于控制画布的尺寸、阴影与边框等样式
- flowchartCanvas:核心绘图元素,通过 JavaScript 获取其上下文(getContext('2d'))实现绘图
- controls:包含 "播放""暂停""重置" 三个按钮,用于控制动画交互
- playBtn:触发动画播放的交互入口
- pauseBtn:触发动画暂停的交互入口
- resetBtn:将画布恢复到初始状态的交互入口
- footer:显示版权信息,提升页面完整性
CSS
- .container :控制核心容器的宽度(最大 1200px)、白色半透明背景、圆角与阴影,增强立体感
- h1 :通过背景裁剪实现文字渐变效果,替代传统纯色文字
- .canvas-container :固定画布高度(500px)、浅灰色背景与轻微阴影,让画布与容器区分开
- button :按钮采用圆角(50px)、渐变背景、阴影,transition 实现 hover 动画过渡
- button:hover:鼠标悬浮时按钮向上偏移 3px,阴影加深,增强交互反馈
- button:active:点击按钮时恢复原位置,模拟 "按压" 手感
- @media (max-width: 768px):在移动设备上缩小标题字体、降低画布高度(400px),避免内容溢出
JavaScript 部分:交互与动画实现
负责 Canvas 绘图、动画控制与用户交互逻辑,核心分为初始化 、绘图 、动画 、事件监听四大模块。
1. 初始化:准备工作
首先通过 DOMContentLoaded 事件确保 DOM 加载完成后再执行代码,避免获取不到元素的问题:
js
document.addEventListener('DOMContentLoaded', function() {
  // 1. 获取DOM元素
  const canvas = document.getElementById('flowchartCanvas');
  const ctx = canvas.getContext('2d'); // 获取2D绘图上下文(核心)
  const playBtn = document.getElementById('playBtn');
  const pauseBtn = document.getElementById('pauseBtn');
  const resetBtn = document.getElementById('resetBtn');

  // 2. 响应式调整Canvas尺寸
  function resizeCanvas() {
    canvas.width = canvas.offsetWidth; // 让Canvas宽度等于父容器宽度
    canvas.height = canvas.offsetHeight; // 让Canvas高度等于父容器高度
    drawFlowchart(); // 尺寸变化后重新绘图
  }

  // 3. 定义事件数据(飞行过程的关键事件)
  const events = [
    { time: '2025-09-12 11:40', event: '起飞', position: 0.05 }, // position:事件在时间轴上的比例(0~1)
    { time: '2025-09-12 11:42', event: '转弯', position: 0.15 },
    { time: '2025-09-12 11:42', event: '发现问题', position: 0.25 },
    { time: '2025-09-12 11:51', event: '返航', position: 0.35 },
    { time: '2025-09-12 11:53', event: '飞行', position: 0.45 },
    { time: '2025-09-12 11:55', event: '转弯', position: 0.55 },
    { time: '2025-09-12 12:00', event: '飞行', position: 0.65 },
    { time: '2025-09-12 12:30', event: '降落', position: 0.75 },
    { time: '2025-09-12 12:30', event: '降落', position: 0.85 },
    { time: '2025-09-12 13:41', event: '返航', position: 0.95 }
  ];

  // 4. 动画状态变量
  let animationProgress = 0; // 动画进度(0~0.95,对应时间轴比例)
  let animationId = null; // 动画请求ID(用于暂停动画)
  let isAnimating = false; // 动画是否正在播放
});
2. 核心函数:drawFlowchart () 绘图逻辑
该函数是 Canvas 绘图的核心,负责绘制时间轴、箭头、事件节点、事件文本,并根据动画进度更新节点颜色:
js
function drawFlowchart() {
  const width = canvas.width; // 画布宽度
  const height = canvas.height; // 画布高度
  const timelineY = height / 2; // 时间轴的Y坐标(垂直居中)
  const nodeRadius = 12; // 事件节点的半径

  // 步骤1:清除画布(每次绘图前清空,避免重叠)
  ctx.clearRect(0, 0, width, height);

  // 步骤2:绘制时间轴(水平直线)
  ctx.beginPath(); // 开始路径绘制
  ctx.moveTo(width * 0.05, timelineY); // 起点(左侧留5%空白)
  ctx.lineTo(width * 0.95, timelineY); // 终点(右侧留5%空白)
  ctx.strokeStyle = '#667eea'; // 线条颜色(紫蓝色)
  ctx.lineWidth = 3; // 线条宽度
  ctx.stroke(); // 执行绘制

  // 步骤3:绘制时间轴箭头(终点处的三角形)
  ctx.beginPath();
  ctx.moveTo(width * 0.95, timelineY); // 箭头顶点
  ctx.lineTo(width * 0.93, timelineY - 8); // 左上点
  ctx.lineTo(width * 0.93, timelineY + 8); // 左下点
  ctx.closePath(); // 闭合路径(形成三角形)
  ctx.fillStyle = '#667eea'; // 填充颜色
  ctx.fill(); // 执行填充

  // 步骤4:绘制每个事件的节点、连接线与文本
  events.forEach((ev, index) => {
    const x = width * ev.position; // 事件节点的X坐标(按比例计算)
    const isEven = index % 2 === 0; // 判断索引是否为偶数(控制节点在时间轴上下两侧)
    const nodeY = isEven ? timelineY - 50 : timelineY + 50; // 节点Y坐标(偶数在上,奇数在下)

    // 4.1 绘制连接线(时间轴到节点的虚线)
    ctx.beginPath();
    ctx.moveTo(x, timelineY); // 起点(时间轴上的点)
    ctx.lineTo(x, nodeY); // 终点(事件节点)
    ctx.strokeStyle = '#adb5bd'; // 虚线颜色(浅灰色)
    ctx.lineWidth = 1.5; // 线条宽度
    ctx.setLineDash([5, 3]); // 设置虚线样式(5px实线,3px空白)
    ctx.stroke();
    ctx.setLineDash([]); // 重置为实线(避免影响后续绘图)

    // 4.2 绘制事件节点(圆形)
    ctx.beginPath();
    ctx.arc(x, nodeY, nodeRadius, 0, Math.PI * 2); // 画圆(x,y,半径,起始角度,结束角度)
    // 节点颜色:动画进度覆盖时为红色(#F2050A),否则为紫蓝色
    ctx.fillStyle = isAnimating && animationProgress >= ev.position ? '#F2050A' : '#667eea';
    ctx.fill(); // 填充圆形
    ctx.strokeStyle = 'white'; // 节点边框颜色(白色)
    ctx.lineWidth = 2; // 边框宽度
    ctx.stroke(); // 绘制边框

    // 4.3 绘制事件名称(如"起飞""转弯")
    ctx.font = '14px Segoe UI, sans-serif'; // 字体样式
    ctx.textAlign = 'center'; // 文本水平居中
    ctx.textBaseline = 'middle'; // 文本垂直居中
    ctx.fillStyle = '#495057'; // 文本颜色(深灰色)
    ctx.fillText(ev.event, x, nodeY + (isEven ? -30 : 30)); // 文本位置(节点上下30px处)

    // 4.4 绘制事件时间(如"2025-09-12 11:40")
    ctx.font = '12px Segoe UI, sans-serif'; // 字体缩小
    ctx.fillStyle = '#6c757d'; // 文本颜色(浅灰色)
    ctx.fillText(ev.time, x, nodeY + (isEven ? -50 : 50)); // 文本位置(事件名称外侧)
  });

  // 步骤5:绘制动画进度条(红色实线,跟随动画进度)
  if (isAnimating) {
    ctx.beginPath();
    ctx.moveTo(width * 0.05, timelineY); // 起点(与时间轴一致)
    ctx.lineTo(width * animationProgress, timelineY); // 终点(随进度变化)
    ctx.strokeStyle = '#F2050A'; // 进度条颜色(红色)
    ctx.lineWidth = 4; // 进度条宽度(比时间轴粗)
    ctx.stroke();
  }
}
3. 动画控制:animate () 与按钮事件
动画通过 requestAnimationFrame(浏览器原生动画 API)实现,配合按钮事件控制播放、暂停、重置:
js
// 动画函数:逐帧更新进度并重新绘图
function animate() {
  if (animationProgress < 0.95) { // 进度未到终点(0.95)
    animationProgress += 0.005; // 每次帧更新进度(控制动画速度)
    drawFlowchart(); // 重新绘图(更新进度条与节点颜色)
    animationId = requestAnimationFrame(animate); // 请求下一帧动画
  } else {
    isAnimating = false; // 进度到终点,停止动画
  }
}

// 播放按钮事件:启动动画(仅当未播放时)
playBtn.addEventListener('click', function() {
  if (!isAnimating) {
    isAnimating = true;
    animate();
  }
});

// 暂停按钮事件:取消动画请求(停止动画)
pauseBtn.addEventListener('click', function() {
  if (isAnimating) {
    cancelAnimationFrame(animationId); // 取消下一帧动画
    isAnimating = false;
  }
});

// 重置按钮事件:恢复初始状态
resetBtn.addEventListener('click', function() {
  if (isAnimating) {
    cancelAnimationFrame(animationId); // 先停止动画
    isAnimating = false;
  }
  animationProgress = 0; // 进度重置为0
  drawFlowchart(); // 重新绘图(恢复初始样式)
});

// 窗口 resize 事件:响应式调整画布尺寸
window.addEventListener('resize', resizeCanvas);

// 初始化:首次加载时调整尺寸并绘图
resizeCanvas();
drawFlowchart();各位互联网搭子,要是这篇文章成功引起了你的注意,别犹豫,关注、点赞、评论、分享走一波,让我们把这份默契延续下去,一起在知识的海洋里乘风破浪!